VCE Maths Methods Statistics Mini Test 1
Number of marks: 10
Reading time: 2 minutes
Writing time: 15 minutes
Section A – Calculator Allowed
Instructions
• Answer all questions in pencil on your Multiple-Choice Answer Sheet.
• Choose the response that is correct for the question.
• A correct answer scores 1; an incorrect answer scores 0.
• Marks will not be deducted for incorrect answers.
• No marks will be given if more than one answer is completed for any question.
• Unless otherwise indicated, the diagrams in this book are not drawn to scale.
An organisation randomly surveyed 1000 Australian adults and found that 55% of those surveyed were happy with their level of physical activity.
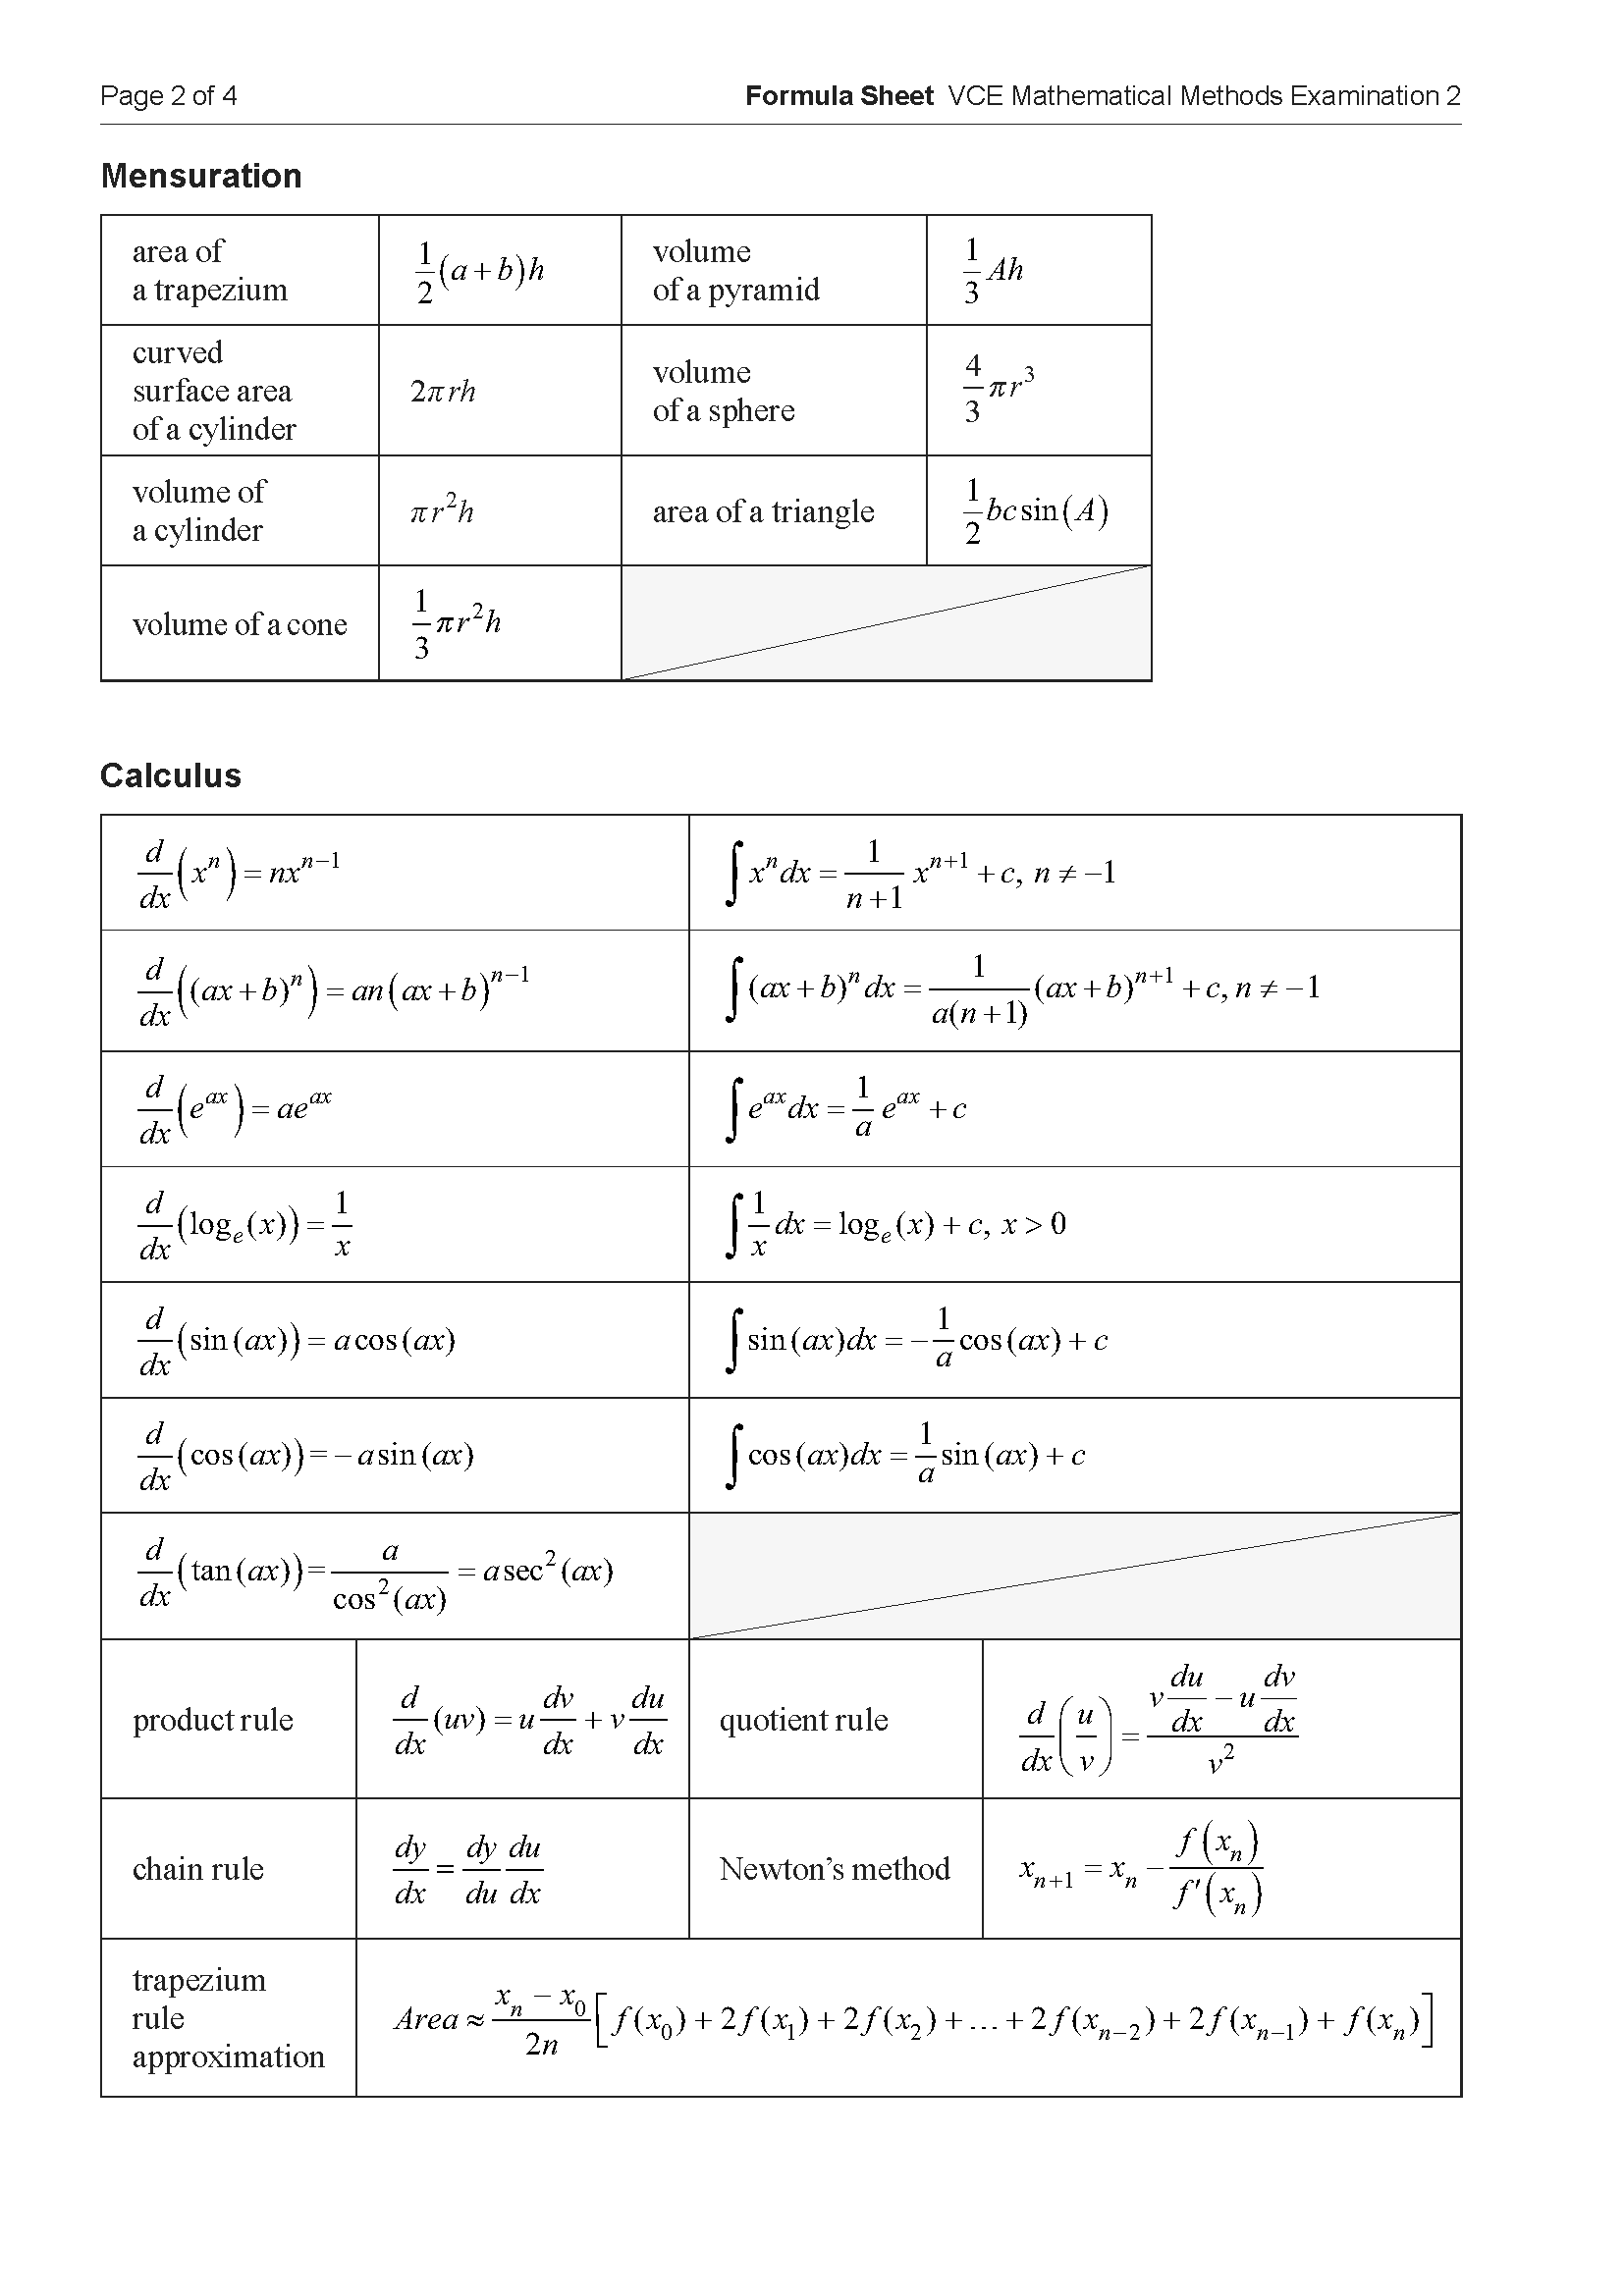
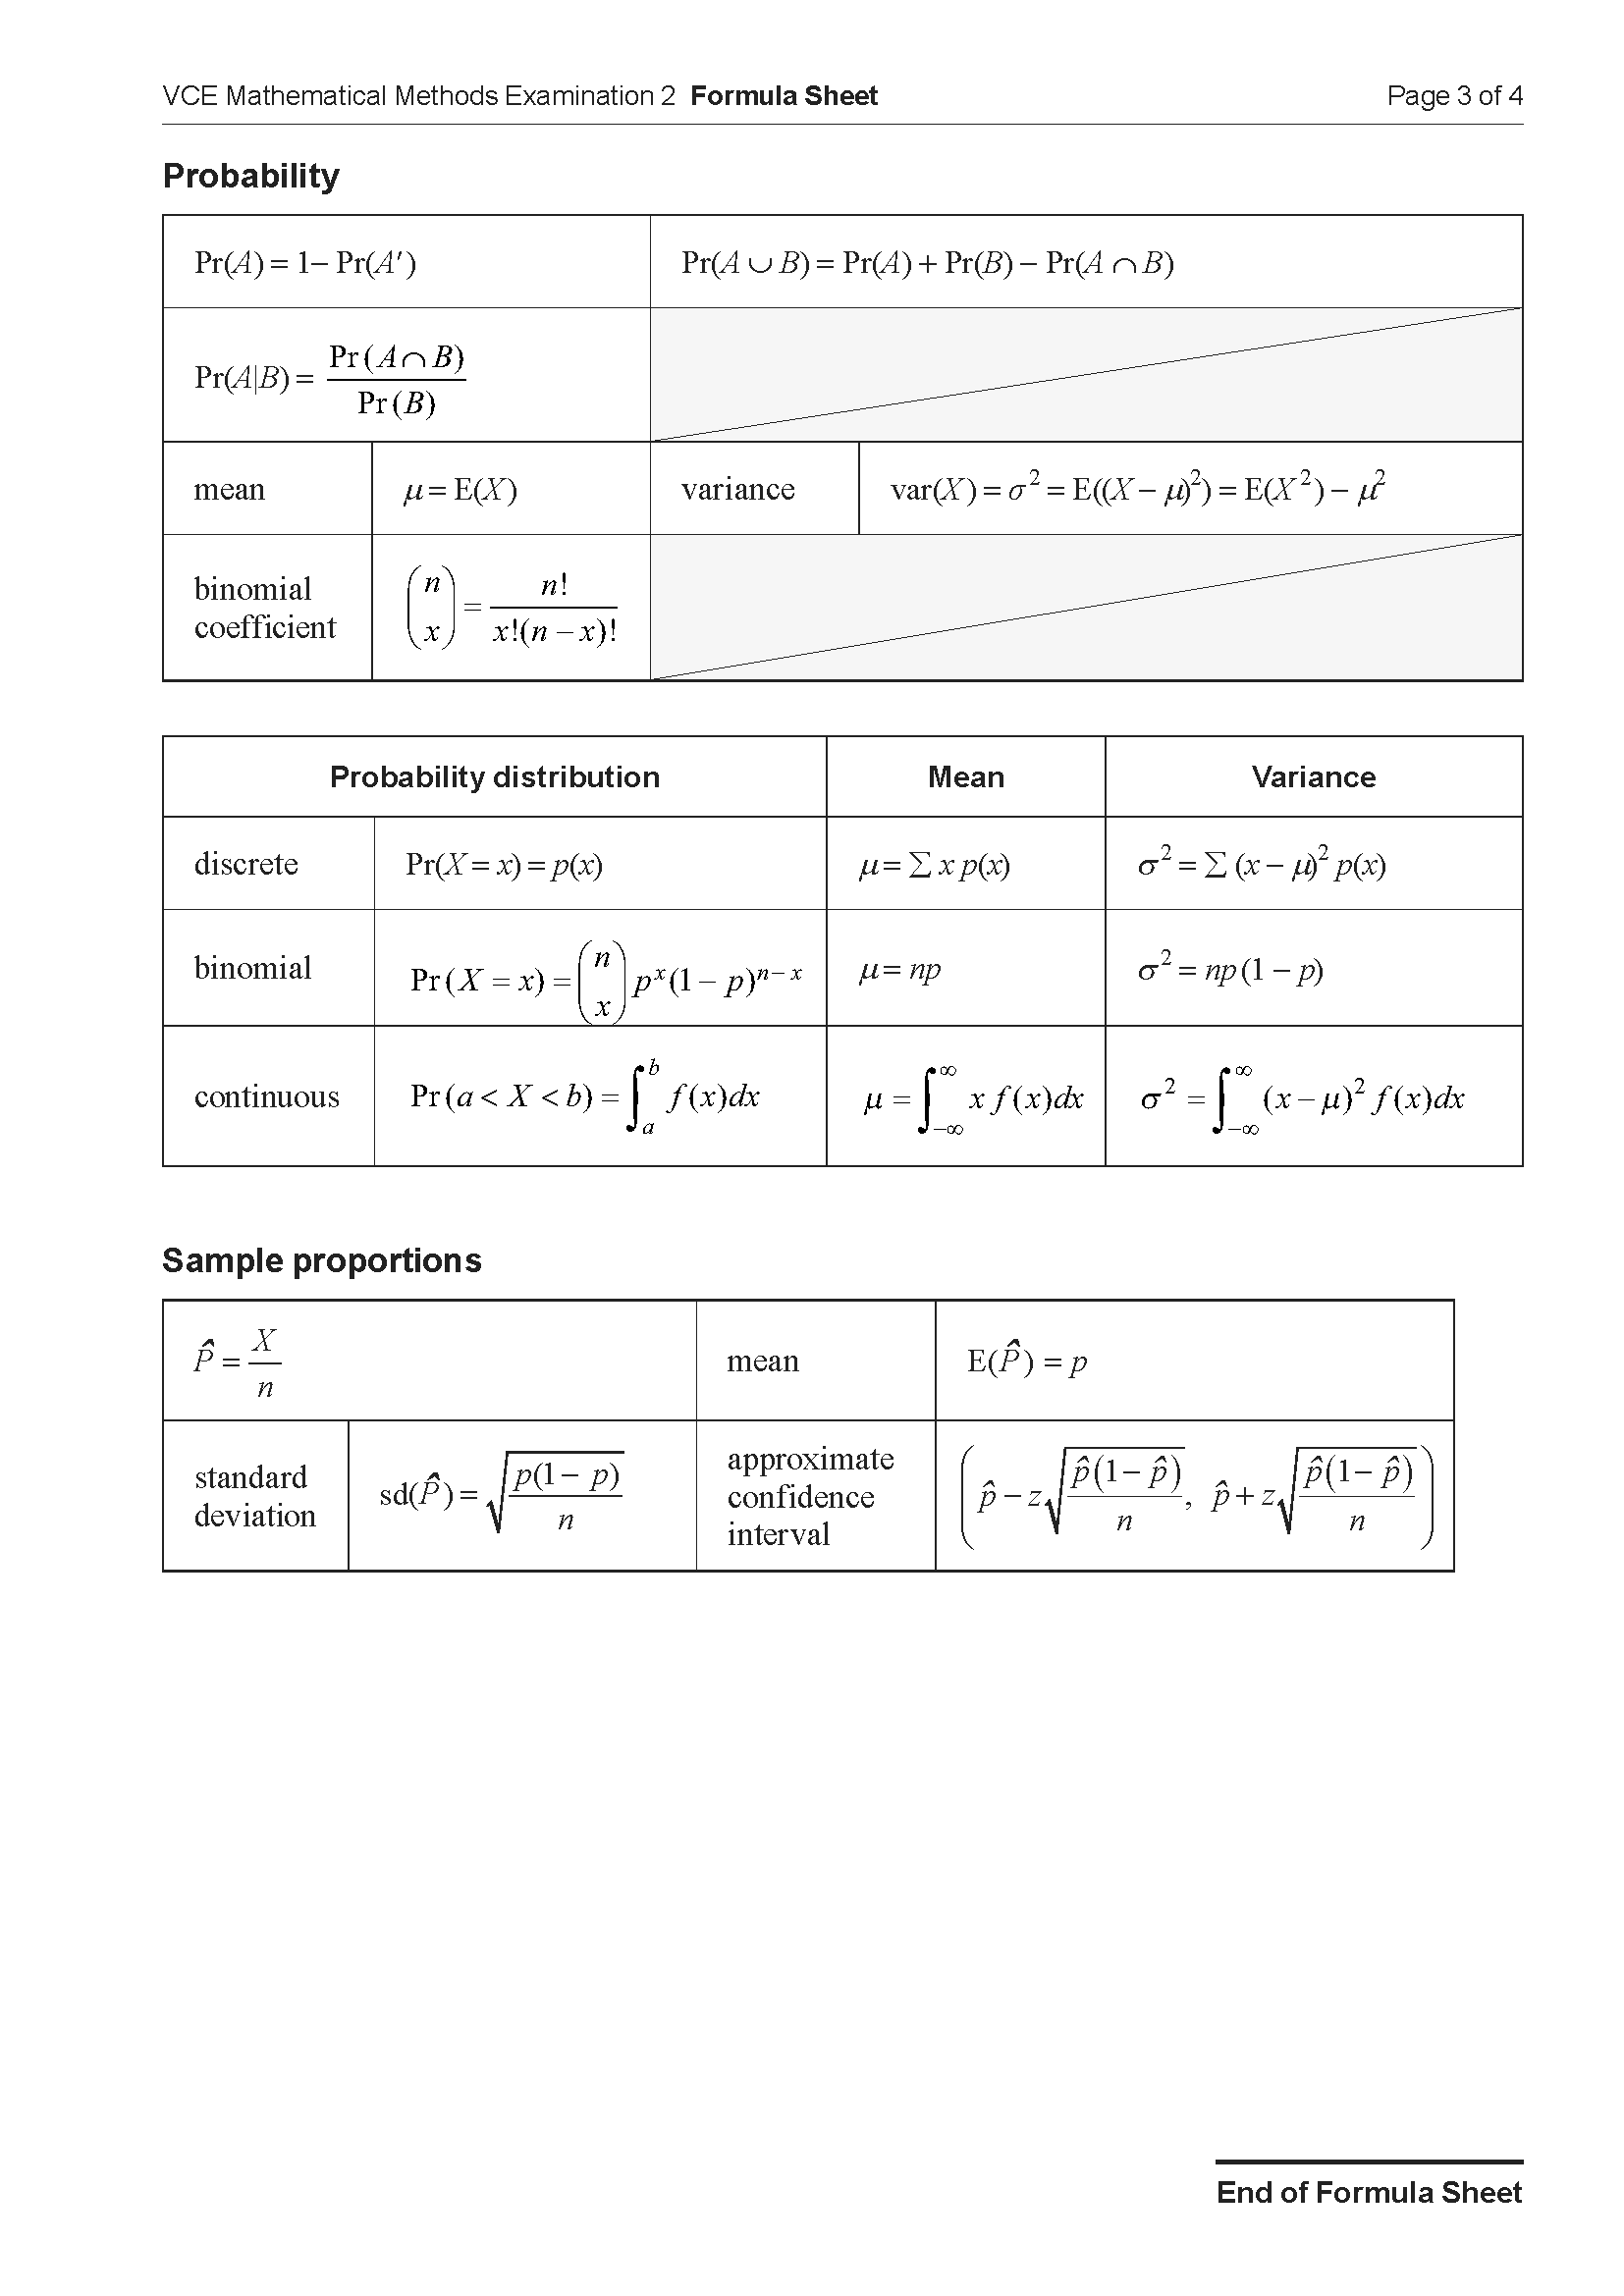
An approximate 95% confidence interval for the percentage of Australian adults who were happy with their level of physical activity is closest to
- A. (4.1, 6.9)
- B. (50.9, 59.1)
- C. (52.4, 57.6)
- D. (51.9, 58.1)
- E. (45.2, 64.8)
A box contains many coloured glass beads.
A random sample of 48 beads is selected and it is found that the proportion of blue-coloured beads in this sample is 0.125
Based on this sample, a 95% confidence interval for the proportion of blue-coloured glass beads is
- A. (0.0314, 0.2186)
- B. (0.0465, 0.2035)
- C. (0.0018, 0.2482)
- D. (0.0896, 0.1604)
- E. (0.0264, 0.2136)
The 95% confidence interval for the proportion of ferry tickets that are cancelled on the intended departure day is calculated from a large sample to be \((0.039, 0.121)\).
The sample proportion from which this interval was constructed is
- A. 0.080
- B. 0.041
- C. 0.100
- D. 0.062
- E. 0.059
For random samples of five Australians, \(\hat{P}\) is the random variable that represents the proportion who live in a capital city.
Given that \(\Pr(\hat{P}=0) = \frac{1}{243}\), then \(\Pr(\hat{P} > 0.6)\), correct to four decimal places, is
- A. 0.0453
- B. 0.3209
- C. 0.4609
- D. 0.5390
- E. 0.7901
End of Section A
Section B – No Calculator
Instructions
• Answer all questions in the spaces provided.
• Write your responses in English.
• In questions where a numerical answer is required, an exact value must be given unless otherwise specified.
• In questions where more than one mark is available, appropriate working must be shown.
• Unless otherwise indicated, the diagrams in this book are not drawn to scale.
Let \( \hat{P} \) be the random variable that represents the sample proportion of households in a given suburb that have solar panels installed.
From a sample of randomly selected households in a given suburb, an approximate 95% confidence interval for the proportion \( p \) of households having solar panels installed was determined to be (0.04, 0.16).
a. Find the value of \( \hat{p} \) that was used to obtain this approximate 95% confidence interval. 1 mark
b. Find the size of the sample from which this 95% confidence interval was obtained.
Use \( z = 2 \) to approximate the 95% confidence interval. 2 marks
c. A larger sample of households is selected, with a sample size four times the original sample. The sample proportion of households having solar panels installed is found to be the same.
By what factor will the increased sample size affect the width of the confidence interval? 1 mark
Fred owns a company that produces thousands of pegs each day. He randomly selects 41 pegs that are produced on one day and finds eight faulty pegs.
a. What is the proportion of faulty pegs in this sample? 1 mark
b. Pegs are packed each day in boxes. Each box holds 12 pegs. Let \(\hat{P}\) be the random variable that represents the proportion of faulty pegs in a box.
The actual proportion of faulty pegs produced by the company each day is \(\frac{1}{6}\).
Find \(\Pr(\hat{P} < \frac{1}{6})\). Express your answer in the form \(a(b)^n\), where \(a\) and \(b\) are positive rational numbers and \(n\) is a positive integer. 2 marks
End of examination questions
VCE is a registered trademark of the VCAA. The VCAA does not endorse or make any warranties regarding this study resource. Past VCE exams and related content can be accessed directly at www.vcaa.vic.edu.au

