VCE General Maths Data Analysis 2020 Mini Test 1
VCAA General Maths Exam 2
This is the full VCE General Maths Exam with worked solutions. You can also try Mini-Tests, which are official VCAA exams split into short tests you can do anytime.
Number of marks: 10
Reading time: 2.5 minutes
Writing time: 15 minutes
Instructions
• Answer all questions in the spaces provided.
• Write your responses in English.
• In all questions where a numerical answer is required, you should only round your answer when instructed to do so.
• Unless otherwise indicated, the diagrams in this book are not drawn to scale.
Data analysis - 2020 - Exam 2 (Part 1)
The neck size, in centimetres, of 250 men was recorded and displayed in the dot plot below.
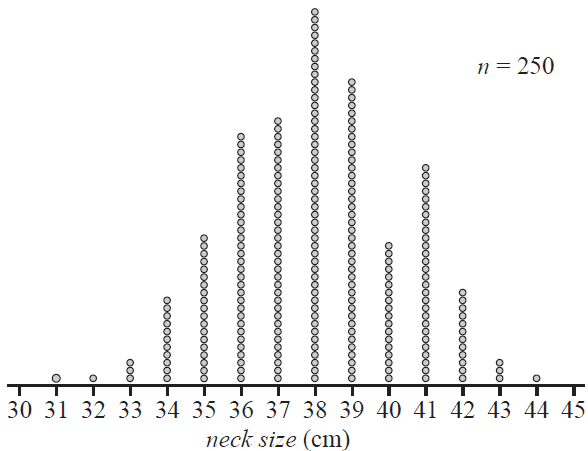
a. Write down the modal neck size, in centimetres, for these 250 men. 1 mark
b. Assume that this sample of 250 men has been drawn at random from a population of men whose neck size is normally distributed with a mean of 38 cm and a standard deviation of 2.3 cm.
i. How many of these 250 men are expected to have a neck size that is more than three standard deviations above or below the mean?
Round your answer to the nearest whole number. 1 mark
ii. How many of these 250 men actually have a neck size that is more than three standard deviations above or below the mean? 1 mark
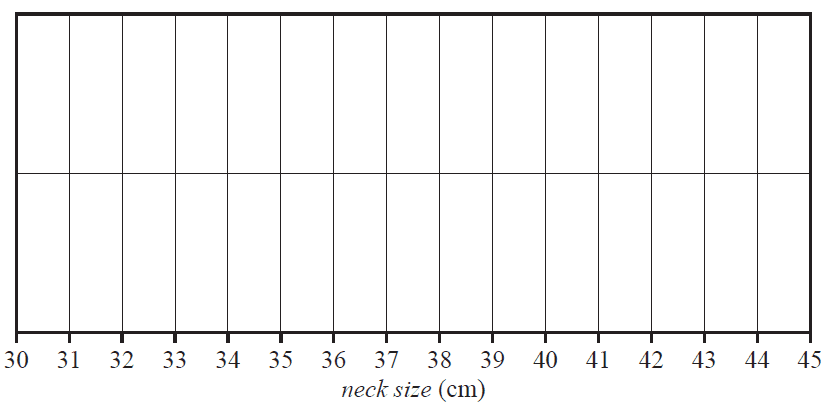
c. The five-number summary for this sample of neck sizes, in centimetres, is given below.
| Minimum | First quartile (\(Q_1\)) | Median | Third quartile (\(Q_3\)) | Maximum |
| 31 | 36 | 38 | 39 | 44 |
Use the five-number summary to construct a boxplot, showing any outliers if appropriate, on the grid below. 2 marks
In a study of the association between BMI and neck size, 250 men were grouped by neck size (below average, average and above average) and their BMI recorded. Five-number summaries describing the distribution of BMI for each group are displayed in the table below along with the group size. The associated boxplots are shown below the table.
| Neck size | Group size | BMI (kg/m²) | ||||
|---|---|---|---|---|---|---|
| Min. | \(Q_1\) | Median | \(Q_3\) | Max. | ||
| below average | 50 | 18.1 | 20.6 | 21.6 | 23.2 | 26.8 |
| average | 124 | 19.8 | 23.4 | 24.6 | 26.0 | 33.9 |
| above average | 76 | 23.1 | 26.25 | 28.1 | 29.95 | 39.1 |
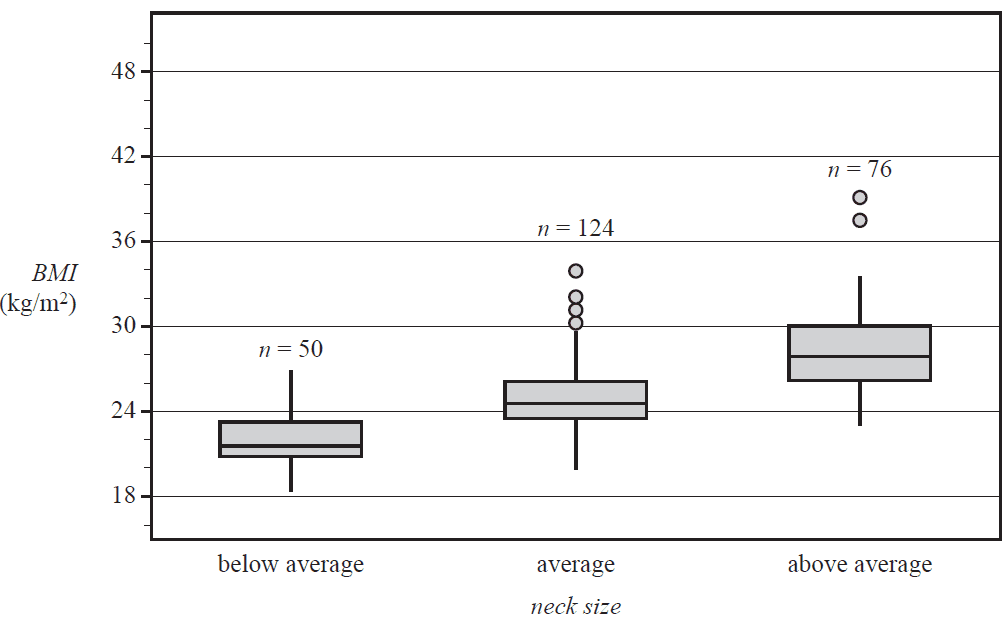
a. What percentage of these 250 men are classified as having a below average neck size? 1 mark
b. What is the interquartile range (IQR) of BMI for the men with an average neck size? 1 mark
c. People with a BMI of 30 or more are classified as being obese.
Using this criterion, how many of these 250 men would be classified as obese? Assume that the BMI values were all rounded to one decimal place. 1 mark
d. Do the boxplots support the contention that BMI is associated with neck size? Refer to the values of an appropriate statistic in your response. 2 marks
End of Multiple-Choice Question Book
VCE is a registered trademark of the VCAA. The VCAA does not endorse or make any warranties regarding this study resource. Past VCE exams and related content can be accessed directly at www.vcaa.vic.edu.au
