VCE General Maths Data Analysis 2019 Mini Test 2
VCAA General Maths Exam 2
This is the full VCE General Maths Exam with worked solutions. You can also try Mini-Tests, which are official VCAA exams split into short tests you can do anytime.
Number of marks: 8
Reading time: 2 minutes
Writing time: 12 minutes
Instructions
• Answer all questions in the spaces provided.
• Write your responses in English.
• In all questions where a numerical answer is required, you should only round your answer when instructed to do so.
• Unless otherwise indicated, the diagrams in this book are not drawn to scale.
Data analysis - 2019 - Exam 2 (Part 2)
The scatterplot below shows the atmospheric pressure, in hectopascals (hPa), at 3 pm (pressure 3 pm) plotted against the atmospheric pressure, in hectopascals, at 9 am (pressure 9 am) for 23 days in November 2017 at a particular weather station.
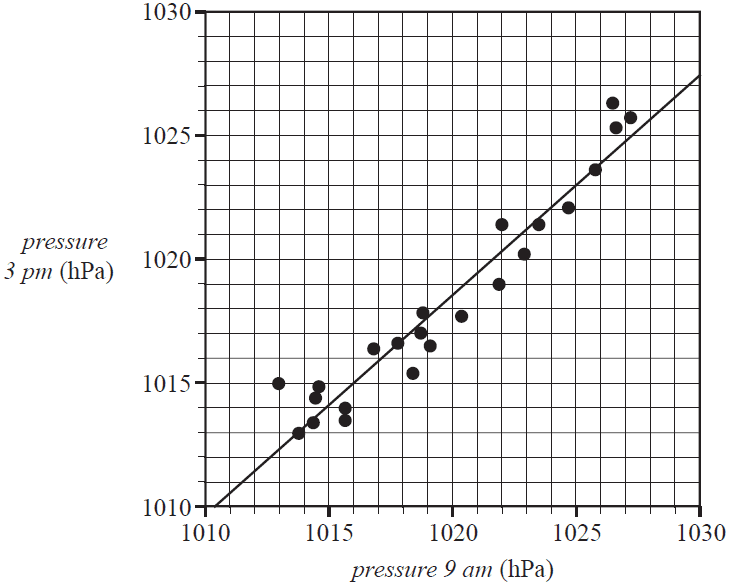
A least squares line has been fitted to the scatterplot as shown.
The equation of this line is
pressure 3 pm = 111.4 + 0.8894 × pressure 9 am
a. Interpret the slope of this least squares line in terms of the atmospheric pressure at this weather station at 9 am and at 3 pm. 1 mark
b. Use the equation of the least squares line to predict the atmospheric pressure at 3 pm when the atmospheric pressure at 9 am is 1025 hPa.
Round your answer to the nearest whole number. 1 mark
c. Is the prediction made in part b. an example of extrapolation or interpolation? 1 mark
d. Determine the residual when the atmospheric pressure at 9 am is 1013 hPa.
Round your answer to the nearest whole number. 1 mark
e. The mean and the standard deviation of pressure 9 am and pressure 3 pm for these 23 days are shown in Table 4 below.
| Pressure 9 am | Pressure 3 pm | |
|---|---|---|
| Mean | 1019.7 | 1018.3 |
| Standard deviation | 4.5477 | 4.1884 |
i. Use the equation of the least squares line and the information in Table 4 to show that the correlation coefficient for this data, rounded to three decimal places, is \(r = 0.966\) 1 mark
ii. What percentage of the variation in pressure 3 pm is explained by the variation in pressure 9 am?
Round your answer to one decimal place. 1 mark
f. The residual plot associated with the least squares line is shown below.
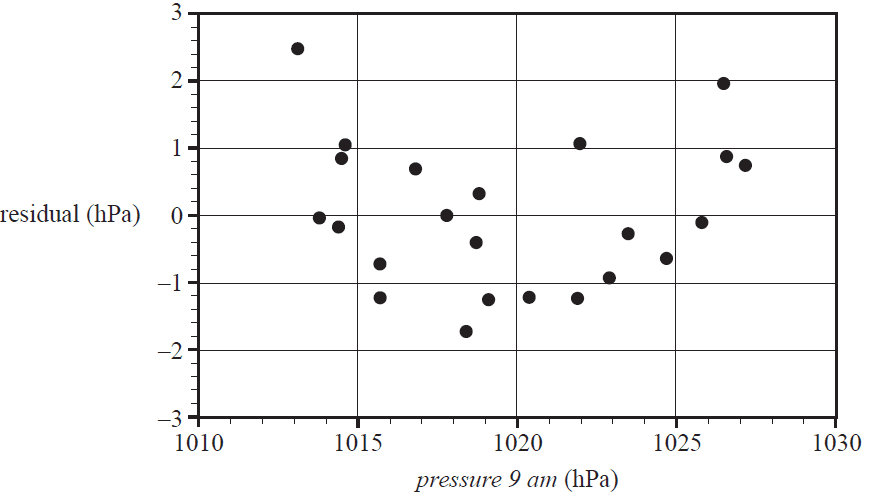
i. The residual plot above can be used to test one of the assumptions about the nature of the association between the atmospheric pressure at 3 pm and the atmospheric pressure at 9 am.
What is this assumption? 1 mark
ii. The residual plot above does not support this assumption.
Explain why. 1 mark
End of Multiple-Choice Question Book
VCE is a registered trademark of the VCAA. The VCAA does not endorse or make any warranties regarding this study resource. Past VCE exams and related content can be accessed directly at www.vcaa.vic.edu.au
