2020 VCE Further Maths Exam 2
This is the full VCE Further Maths Exam with worked solutions. You can also try Mini-Tests, which are official VCAA exams split into short tests you can do anytime.
Number of marks: 60
Reading time: 15 minutes
Writing time: 1.5 hours
Instructions
• Answer all questions in pencil on your Multiple-Choice Answer Sheet.
• Choose the response that is correct for the question.
• A correct answer scores 1; an incorrect answer scores 0.
• Marks will not be deducted for incorrect answers.
• No marks will be given if more than one answer is completed for any question.
• Unless otherwise indicated, the diagrams in this book are not drawn to scale.
SECTION A – Core
Data analysis
Question 1 (3 marks)Body mass index (BMI), in kilograms per square metre, was recorded for a sample of 32 men and displayed in the ordered stem plot below.
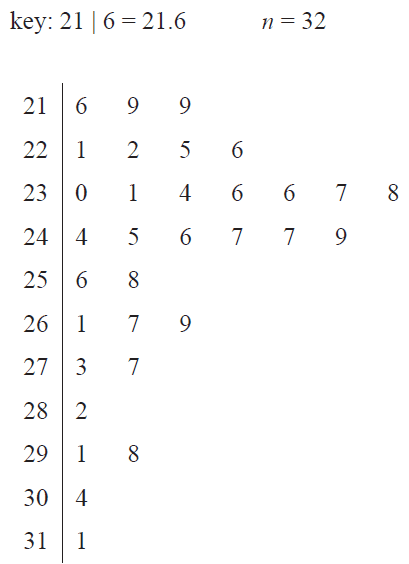
a. Describe the shape of the distribution. 1 mark
b. Determine the median BMI for this group of men. 1 mark
c. People with a BMI of 25 or over are considered to be overweight.
What percentage of these men would be considered to be overweight? 1 mark
The neck size, in centimetres, of 250 men was recorded and displayed in the dot plot below.
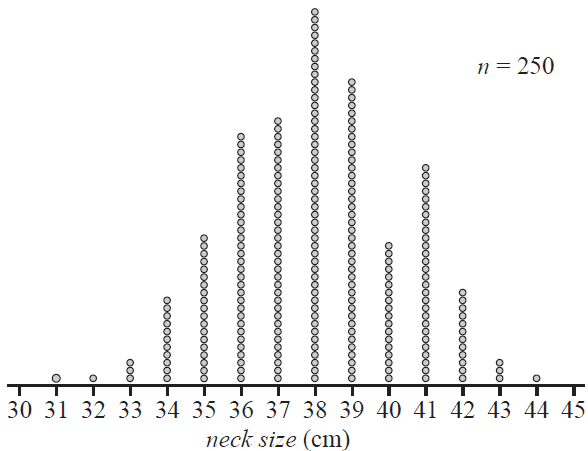
a. Write down the modal neck size, in centimetres, for these 250 men. 1 mark
b. Assume that this sample of 250 men has been drawn at random from a population of men whose neck size is normally distributed with a mean of 38 cm and a standard deviation of 2.3 cm.
i. How many of these 250 men are expected to have a neck size that is more than three standard deviations above or below the mean?
Round your answer to the nearest whole number. 1 mark
ii. How many of these 250 men actually have a neck size that is more than three standard deviations above or below the mean? 1 mark
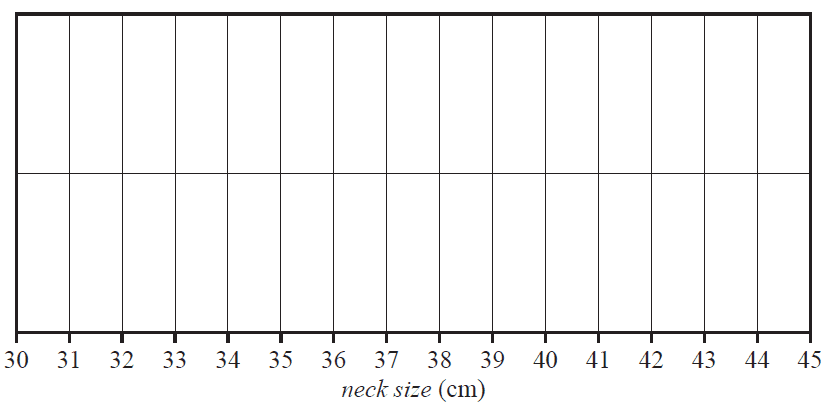
c. The five-number summary for this sample of neck sizes, in centimetres, is given below.
| Minimum | First quartile (\(Q_1\)) | Median | Third quartile (\(Q_3\)) | Maximum |
| 31 | 36 | 38 | 39 | 44 |
Use the five-number summary to construct a boxplot, showing any outliers if appropriate, on the grid below. 2 marks
In a study of the association between BMI and neck size, 250 men were grouped by neck size (below average, average and above average) and their BMI recorded. Five-number summaries describing the distribution of BMI for each group are displayed in the table below along with the group size. The associated boxplots are shown below the table.
| Neck size | Group size | BMI (kg/m²) | ||||
|---|---|---|---|---|---|---|
| Min. | \(Q_1\) | Median | \(Q_3\) | Max. | ||
| below average | 50 | 18.1 | 20.6 | 21.6 | 23.2 | 26.8 |
| average | 124 | 19.8 | 23.4 | 24.6 | 26.0 | 33.9 |
| above average | 76 | 23.1 | 26.25 | 28.1 | 29.95 | 39.1 |
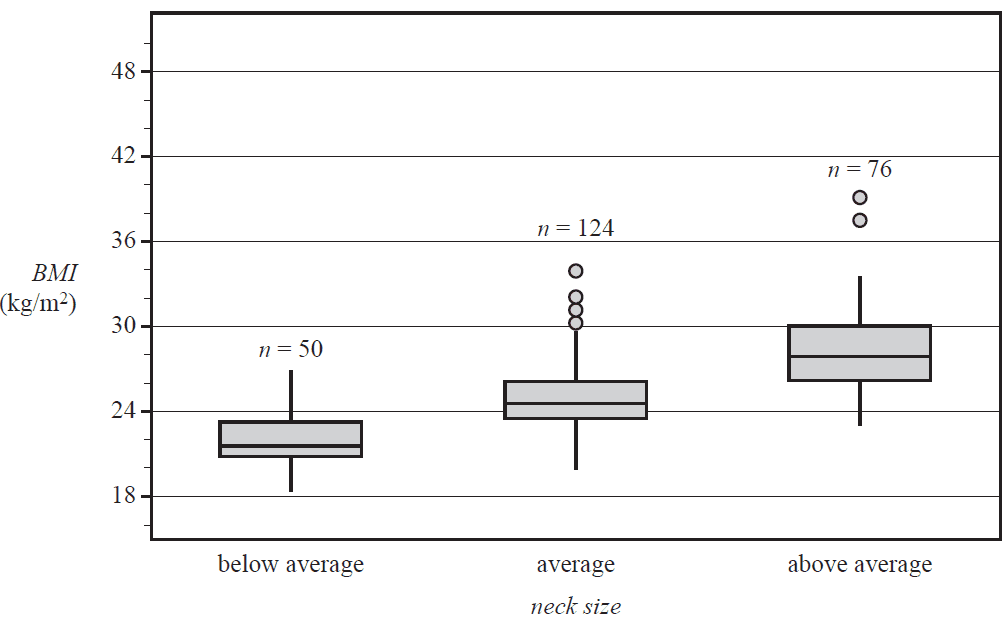
a. What percentage of these 250 men are classified as having a below average neck size? 1 mark
b. What is the interquartile range (IQR) of BMI for the men with an average neck size? 1 mark
c. People with a BMI of 30 or more are classified as being obese.
Using this criterion, how many of these 250 men would be classified as obese? Assume that the BMI values were all rounded to one decimal place. 1 mark
d. Do the boxplots support the contention that BMI is associated with neck size? Refer to the values of an appropriate statistic in your response. 2 marks
The age, in years, body density, in kilograms per litre, and weight, in kilograms, of a sample of 12 men aged 23 to 25 years are shown in the table below.
| Age (years) |
Body density (kg/litre) |
Weight (kg) |
|---|---|---|
| 23 | 1.07 | 70.1 |
| 23 | 1.07 | 90.4 |
| 23 | 1.08 | 73.2 |
| 23 | 1.08 | 85.0 |
| 24 | 1.03 | 84.3 |
| 24 | 1.05 | 95.6 |
| 24 | 1.07 | 71.7 |
| 24 | 1.06 | 95.0 |
| 25 | 1.07 | 80.2 |
| 25 | 1.09 | 87.4 |
| 25 | 1.02 | 94.9 |
| 25 | 1.09 | 65.3 |
a. For these 12 men, determine
i. their median age, in years 1 mark
ii. the mean of their body density, in kilograms per litre. 1 mark
b. A least squares line is to be fitted to the data with the aim of predicting body density from weight.
i. Name the explanatory variable for this least squares line. 1 mark
ii. Determine the slope of this least squares line.
Round your answer to three significant figures. 1 mark
c. What percentage of the variation in body density can be explained by the variation in weight? Round your answer to the nearest percentage. 1 mark
The scatterplot below shows body density, in kilograms per litre, plotted against waist measurement, in centimetres, for 250 men.
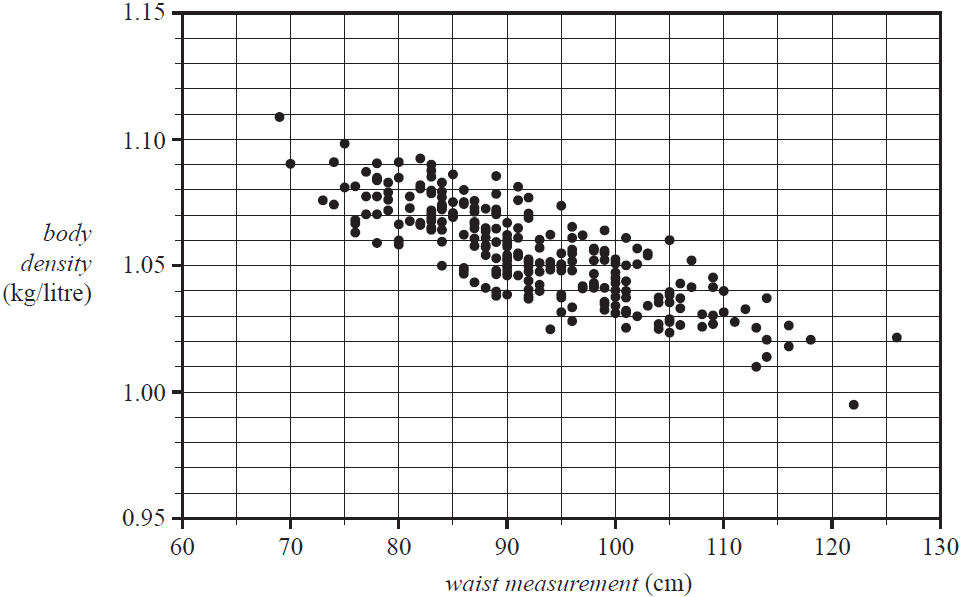
When a least squares line is fitted to the scatterplot, the equation of this line is
\( \textit{body density} = 1.195 - 0.001512 \times \textit{waist measurement} \)
a. Draw the graph of this least squares line on the scatterplot above. 1 mark
b. Use the equation of this least squares line to predict the body density of a man whose waist measurement is 65 cm.
Round your answer to two decimal places. 1 mark
c. When using the equation of this least squares line to make the prediction in part b., are you extrapolating or interpolating? 1 mark
d. Interpret the slope of this least squares line in terms of a man’s body density and waist measurement. 1 mark
e. In this study, the body density of the man with a waist measurement of 122 cm was 0.995 kg/litre.
Show that, when this least squares line is fitted to the scatterplot, the residual, rounded to two decimal places, is –0.02. 1 mark
f. The coefficient of determination for this data is 0.6783.
Write down the value of the correlation coefficient \(r\).
Round your answer to three decimal places. 1 mark
g. The residual plot associated with fitting a least squares line to this data is shown below.
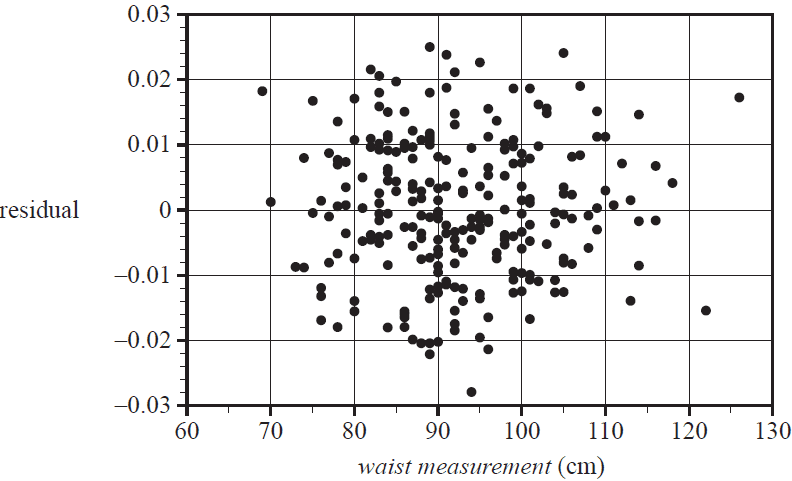
Does this residual plot support the assumption of linearity that was made when fitting this line to this data? Briefly explain your answer. 1 mark
The table below shows the mean age, in years, and the mean height, in centimetres, of 648 women from seven different age groups.
| Age group | |||||||
|---|---|---|---|---|---|---|---|
| Twenties | Thirties | Forties | Fifties | Sixties | Seventies | Eighties | |
| Mean age (years) | 26.3 | 35.2 | 45.2 | 55.3 | 65.1 | 74.8 | 83.1 |
| Mean height (cm) | 167.1 | 164.9 | 164.8 | 163.4 | 161.2 | 158.4 | 156.7 |
a. What was the difference, in centimetres, between the mean height of the women in their twenties and the mean height of the women in their eighties? 1 mark
A scatterplot displaying this data shows an association between the mean height and the mean age of these women. In an initial analysis of the data, a line is fitted to the data by eye, as shown.
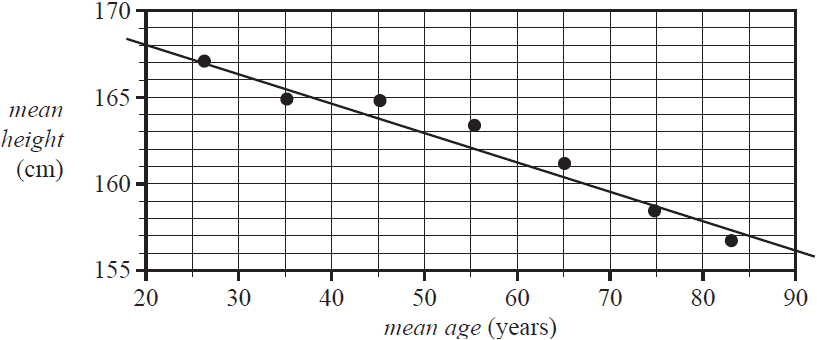
b. Describe this association in terms of strength and direction. 1 mark
c. The line on the scatterplot passes through the points (20, 168) and (85, 157).
Using these two points, determine the equation of this line. Write the values of the intercept and the slope in the appropriate boxes below.
Round your answers to three significant figures. 1 mark
\( \textit{mean height} = \) \( + \) \( \times \textit{mean age} \)
d. In a further analysis of the data, a least squares line was fitted. The associated residual plot that was generated is shown below.
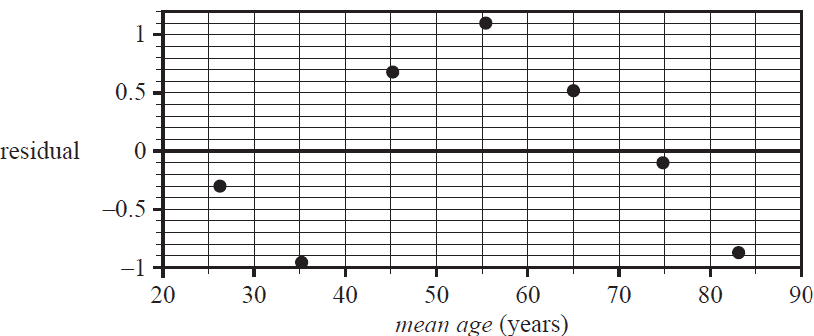
The residual plot indicates that the association between the mean height and the mean age of women is non-linear.
The data presented in the table on page 12 is repeated below. It can be linearised by applying an appropriate transformation to the variable mean age.
| Mean age (years) | 26.3 | 35.2 | 45.2 | 55.3 | 65.1 | 74.8 | 83.1 |
| Mean height (cm) | 167.1 | 164.9 | 164.8 | 163.4 | 161.2 | 158.4 | 156.7 |
Apply an appropriate transformation to the variable mean age to linearise the data. Fit a least squares line to the transformed data and write its equation below.
Round the values of the intercept and the slope to four significant figures. 2 marks
Recursion and financial modelling
Question 7 (4 marks)Samuel owns a printing machine.
The printing machine is depreciated in value by Samuel using flat rate depreciation.
The value of the machine, in dollars, after \(n\) years, \(V_n\), can be modelled by the recurrence relation
\( V_0 = 120\,000, \quad V_{n+1} = V_n - 15\,000 \)
a. By what amount, in dollars, does the value of the machine decrease each year? 1 mark
b. Showing recursive calculations, determine the value of the machine, in dollars, after two years. 1 mark
c. What annual flat rate percentage of depreciation is used by Samuel? 1 mark
d. The value of the machine, in dollars, after \(n\) years, \(V_n\), could also be determined using a rule of the form \(V_n = a + bn\).
Write down this rule for \(V_n\). 1 mark
Samuel has a reducing balance loan.
The first five lines of the amortisation table for Samuel’s loan are shown below.
| Payment number | Payment (\$) |
Interest (\$) |
Principal reduction (\$) |
Balance (\$) |
|---|---|---|---|---|
| 0 | 0.00 | 0.00 | 0.00 | 320 000.00 |
| 1 | 1600.00 | 960.00 | 640.00 | 319 360.00 |
| 2 | 1600.00 | 958.08 | 641.92 | 318 718.08 |
| 3 | 1600.00 | 956.15 | 318 074.23 | |
| 4 | 1600.00 |
Interest is calculated monthly and Samuel makes monthly payments of \$1600.
Interest is charged on this loan at the rate of 3.6% per annum.
a. Using the values in the amortisation table
i. calculate the principal reduction associated with payment number 3 1 mark
ii. calculate the balance of the loan after payment number 4 is made.
Round your answer to the nearest cent. 1 mark
b. Let \(S_n\) be the balance of Samuel’s loan after \(n\) months.
Write down a recurrence relation, in terms of \(S_0\), \(S_{n+1}\) and \(S_n\), that could be used to model the month-to-month balance of the loan. 1 mark
Samuel opens a savings account.
Let \(B_n\) be the balance of this savings account, in dollars, \(n\) months after it was opened.
The month-to-month value of \(B_n\) can be determined using the recurrence relation shown below.
\( B_0 = 5000, \quad B_{n+1} = 1.003 B_n \)
a. Write down the value of \(B_4\), the balance of the savings account after four months.
Round your answer to the nearest cent. 1 mark
b. Calculate the monthly interest rate percentage for Samuel’s savings account. 1 mark
c. After one year, the balance of Samuel’s savings account, to the nearest dollar, is \$5183.
If Samuel had deposited an additional \$50 at the end of each month immediately after the interest was added, how much extra money would be in the savings account after one year?
Round your answer to the nearest dollar. 1 mark
Samuel now invests \$500 000 in an annuity from which he receives a regular monthly payment.
The balance of the annuity, in dollars, after \(n\) months, \(A_n\), can be modelled by a recurrence relation of the form
\( A_0 = 500\,000, \quad A_{n+1} = kA_n - 2000 \)
a. Calculate the balance of this annuity after two months if \(k = 1.0024\). 1 mark
b. Calculate the annual compound interest rate percentage for this annuity if \(k = 1.0024\). 1 mark
c. For what value of \(k\) would this investment act as a simple perpetuity? 1 mark
Later, Samuel took out a new reducing balance loan.
The interest rate for this loan was 4.1% per annum, compounding monthly.
The balance of the loan after four years of monthly repayments was \$329 587.25
The balance of the loan after seven years of monthly repayments was \$280 875.15
Samuel will continue to make the same monthly repayment.
To ensure the loan is fully repaid, to the nearest cent, the required final repayment will be lower.
In the first seven years, Samuel made 84 monthly repayments.
From this point on, how many more monthly repayments will Samuel make to fully repay the loan?
SECTION B – Modules
Module 1 – Matrices
Question 1 (6 marks)The three major shopping centres in a large city, Eastmall (E), Grandmall (G) and Westmall (W), are owned by the same company.
The total number of shoppers at each of the centres at 1.00 pm on a typical day is shown in matrix V.
\[ V = \begin{array}{c} \begin{array}{ccc} E & G & W \end{array} \\ \begin{bmatrix} 2300 & 2700 & 2200 \end{bmatrix} \end{array} \]
a. Write down the order of matrix V. 1 mark
Each of these centres has three major shopping areas: food (F), clothing (C) and merchandise (M).
The proportion of shoppers in each of these three areas at 1.00 pm on a typical day is the same at all three centres and is given in matrix P below.
\[ P = \begin{bmatrix} 0.48 \\ 0.27 \\ 0.25 \end{bmatrix} \begin{matrix} F \\ C \\ M \end{matrix} \]
b. Grandmall’s management would like to see 700 shoppers in its merchandise area at 1.00 pm.
If this were to happen, how many shoppers, in total, would be at Grandmall at this time? 1 mark
c. The matrix \( Q = P \times V \) is shown below. Two of the elements of this matrix are missing.
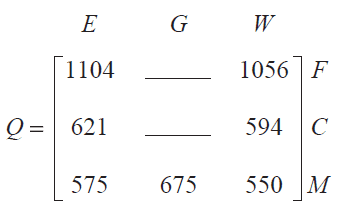
i. Complete matrix Q above by filling in the missing elements. 1 mark
ii. The element in row i and column j of matrix Q is \(q_{ij}\).
What does the element \(q_{23}\) represent? 1 mark
The average daily amount spent, in dollars, by each shopper in each of the three areas at Grandmall in 2019 is shown in matrix \(A_{2019}\) below.
\[ A_{2019} = \begin{bmatrix} 21.30 \\ 34.00 \\ 14.70 \end{bmatrix} \begin{matrix} F \\ C \\ M \end{matrix} \]
On one particular day, 135 shoppers spent the average daily amount on food, 143 shoppers spent the average daily amount on clothing and 131 shoppers spent the average daily amount on merchandise.
d. Write a matrix calculation, using matrix \(A_{2019}\), showing that the total amount spent by all these shoppers is \$9663.20. 1 mark
e. In 2020, the average daily amount spent by each shopper was expected to change by the percentage shown in the table below.
| Area | food | clothing | merchandise |
| Expected change | increase by 5% | decrease by 15% | decrease by 1% |
The average daily amount, in dollars, expected to be spent in each area in 2020 can be determined by forming the matrix product
\( A_{2020} = K \times A_{2019} \)
Write down matrix \(K\). 1 mark
\( K = \)
The preferred number of cafes (x) and sandwich bars (y) in Grandmall’s food court can be determined by solving the following equations written in matrix form.
\[ \begin{bmatrix} 5 & -9 \\ 4 & -7 \end{bmatrix} \begin{bmatrix} x \\ y \end{bmatrix} = \begin{bmatrix} 7 \\ 6 \end{bmatrix} \]
a. The value of the determinant of the \( 2 \times 2 \) matrix is 1.
Use this information to explain why this matrix has an inverse. 1 mark
b. Write the three missing values of the inverse matrix that can be used to solve these equations. 1 mark
![A 2x2 matrix with some blank entries. The matrix shown is: [blank, 9; blank, blank].](https://mathsmethods.com.au/wp-content/uploads/2025/08/2020-FM-Exam-2-M1-Q2b.png)
c. Determine the preferred number of sandwich bars for Grandmall’s food court. 1 mark
An offer to buy the Westmall shopping centre was made by a competitor.
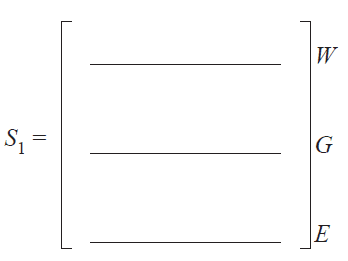
One market research project suggested that if the Westmall shopping centre were sold, each of the three centres (Westmall, Grandmall and Eastmall) would continue to have regular shoppers but would attract and lose shoppers on a weekly basis.
Let \(S_n\) be the state matrix that shows the expected number of shoppers at each of the three centres \(n\) weeks after Westmall is sold.
A matrix recurrence relation that generates values of \(S_n\) is
\(S_{n+1} = T \times S_n\)
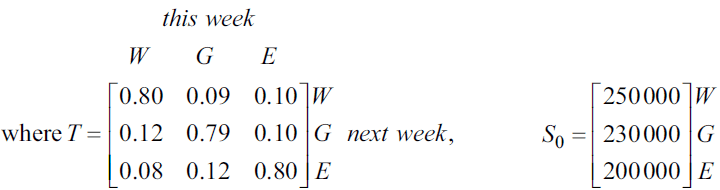
a. Calculate the state matrix, \(S_1\), to show the expected number of shoppers at each of the three centres one week after Westmall is sold. 1 mark
Using values from the recurrence relation on page 23, the graph below shows the expected number of shoppers at Westmall, Grandmall and Eastmall for each of the 10 weeks after Westmall is sold.
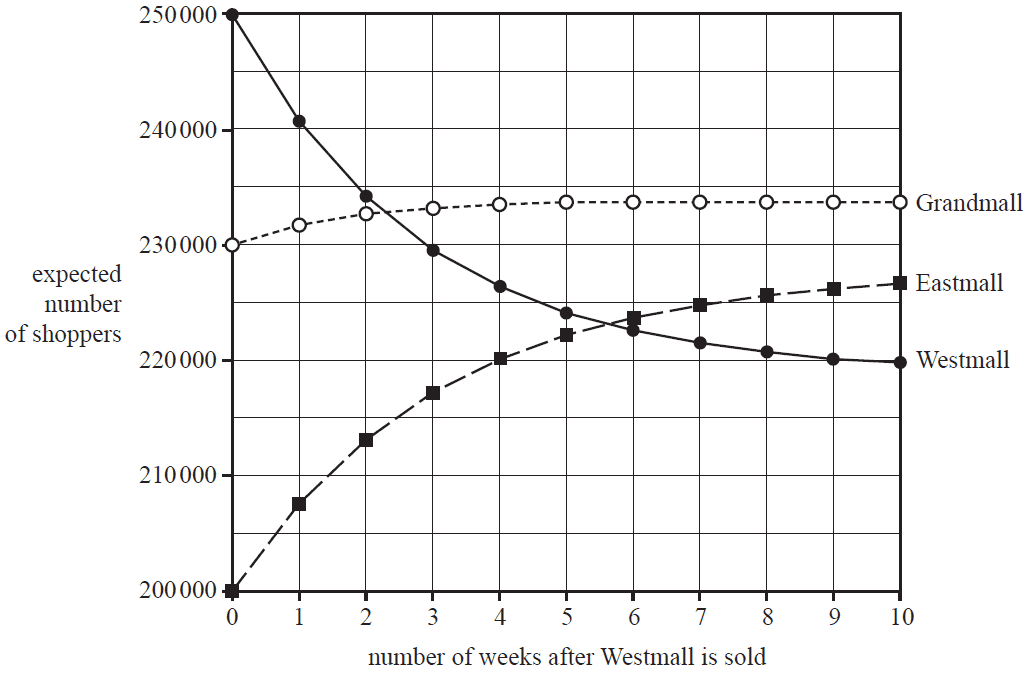
b. What is the difference in the expected weekly number of shoppers at Westmall from the time Westmall is sold to 10 weeks after Westmall is sold?
Give your answer correct to the nearest thousand. 1 mark
c. Grandmall is expected to achieve its maximum number of shoppers sometime between the fourth and the tenth week after Westmall is sold.
Write down the week number in which this is expected to occur. 1 mark
d. In the long term, what is the expected weekly number of shoppers at Westmall?
Round your answer to the nearest whole number. 1 mark
A second market research project also suggested that if the Westmall shopping centre were sold, each of the three centres (Westmall, Grandmall and Eastmall) would continue to have regular shoppers but would attract and lose shoppers on a weekly basis.
Let \(R_n\) be the state matrix that shows the expected number of shoppers at each of the three centres \(n\) weeks after Westmall is sold.
A matrix recurrence relation that generates values of \(R_n\) is
\( R_{n+1} = TR_n + B \)
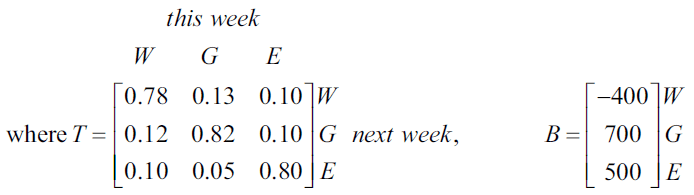
The matrix \(R_2\) is the state matrix that shows the expected number of shoppers at each of the three centres in the second week after Westmall is sold.
\[ R_2 = \begin{bmatrix} 239\,060 \\ 250\,840 \\ 192\,900 \end{bmatrix} \begin{matrix} W \\ G \\ E \end{matrix} \]
a. Determine the expected number of shoppers at Westmall in the third week after it is sold. 1 mark
b. Determine the expected number of shoppers at Westmall in the first week after it is sold. 1 mark
Module 2 – Networks and decision mathematics
Question 1 (3 marks)The Sunny Coast Cricket Club has five new players join its team: Alex, Bo, Cameron, Dale and Emerson.
The graph below shows the players who have played cricket together before joining the team.
For example, the edge between Alex and Bo shows that they have previously played cricket together.
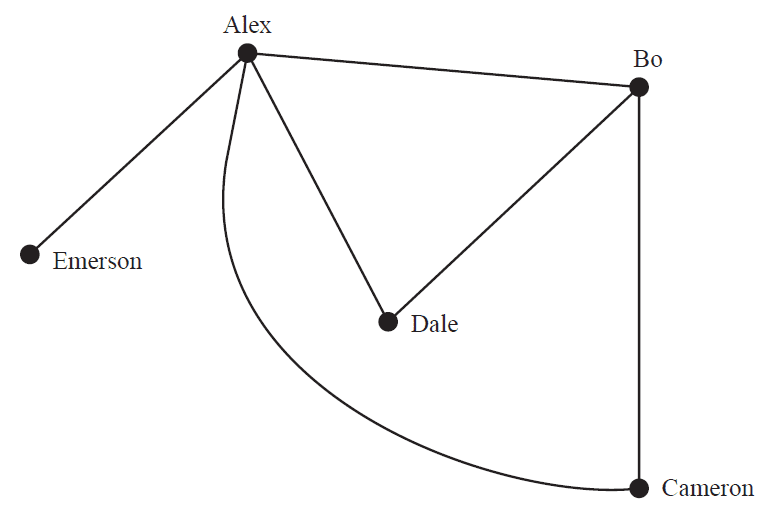
a. How many of these players had Emerson played cricket with before joining the team? 1 mark
b. Who had played cricket with both Alex and Bo before joining the team? 1 mark
c. During the season, another new player, Finn, joined the team.
Finn had not played cricket with any of these players before.
Represent this information on the graph above. 1 mark
A cricket team has 11 players who are each assigned to a batting position.
Three of the new players, Alex, Bo and Cameron, can bat in position 1, 2 or 3.
The table below shows the average scores, in runs, for each player for the batting positions 1, 2 and 3.
| Batting position | ||||
|---|---|---|---|---|
| 1 | 2 | 3 | ||
| Player | Alex | 22 | 24 | 24 |
| Bo | 25 | 25 | 21 | |
| Cameron | 24 | 25 | 19 | |
Each player will be assigned to one batting position.
To which position should each player be assigned to maximise the team’s score? Write your answer in the table below.
| Player | Batting position |
| Alex | |
| Bo | |
| Cameron |
A local fitness park has 10 exercise stations: \(M\) to \(V\).
The edges on the graph below represent the tracks between the exercise stations.
The number on each edge represents the length, in kilometres, of each track.
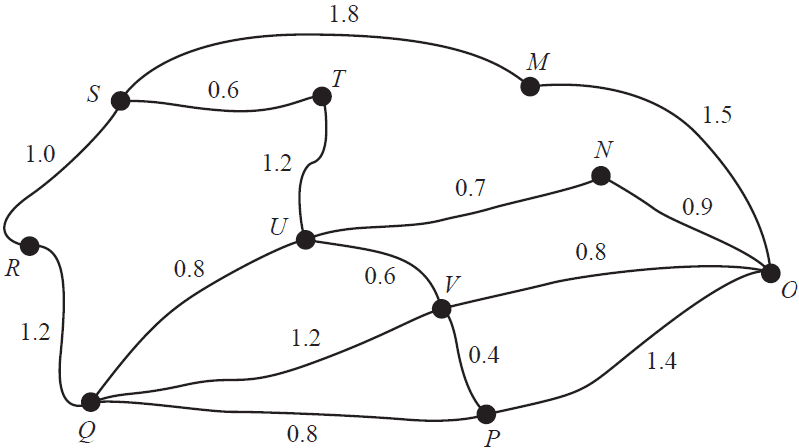
The Sunny Coast cricket coach designs three different training programs, all starting at exercise station S.
| Training program number |
Training details |
|---|---|
| 1 | The team must run to exercise station O. |
| 2 | The team must run along all tracks just once. |
| 3 | The team must visit each exercise station and return to exercise station S. |
a. What is the shortest distance, in kilometres, covered in training program 1? 1 mark
b. i. What mathematical term is used to describe training program 2? 1 mark
ii. At which exercise station would training program 2 finish? 1 mark
c. To complete training program 3 in the minimum distance, one track will need to be repeated.
Complete the following sentence by filling in the boxes provided. 1 mark
This track is between exercise station and exercise station .
Training program 1 has the cricket team starting from exercise station S and running to exercise station O.
For safety reasons, the cricket coach has placed a restriction on the maximum number of people who can use the tracks in the fitness park.
The directed graph below shows the capacity of the tracks, in number of people per minute.
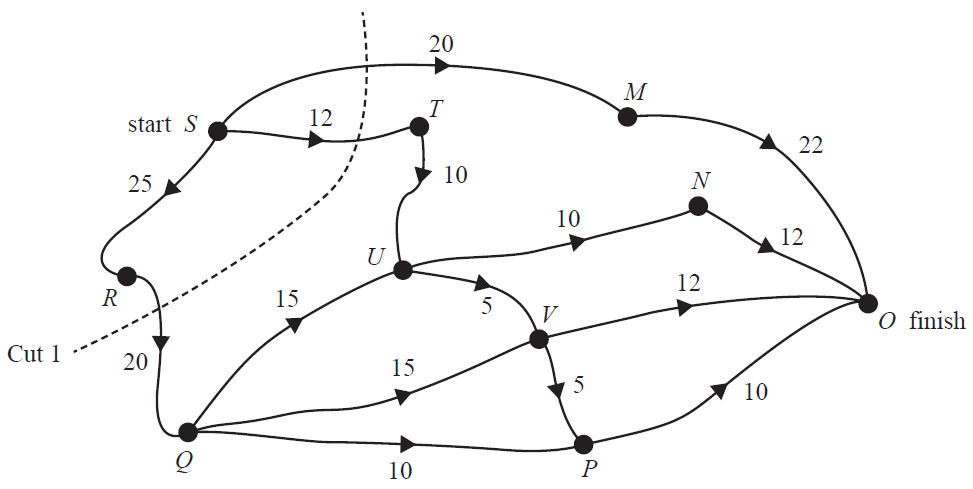
a. How many different routes from S to O are possible? 1 mark
When considering the possible flow of people through this network, many different cuts can be made.
b. Determine the capacity of Cut 1, shown above. 1 mark
c. What is the maximum flow from S to O, in number of people per minute? 1 mark
The Sunny Coast cricket clubroom is undergoing a major works project.
This project involves nine activities: A to I.
The table below shows the earliest start time (EST) and duration, in months, for each activity.
The immediate predecessor(s) is also shown.
The duration for activity C is missing.
| Activity | EST | Duration | Immediate predecessor(s) |
|---|---|---|---|
| A | 0 | 2 | – |
| B | 0 | 5 | – |
| C | 5 | A, B | |
| D | 7 | 7 | C |
| E | 7 | 9 | C |
| F | 5 | 3 | B |
| G | 14 | 4 | D |
| H | 8 | 9 | F |
| I | 18 | 2 | E, G, H |
The information in the table above can be used to complete a directed network.
This network will require a dummy activity.
a. Complete the following sentence by filling in the boxes provided. 1 mark
This dummy activity could be drawn as a directed edge from the end of activity to the start of activity
b. What is the duration, in months, of activity C? 1 mark
c. Name the four activities that have a float time. 1 mark
d. The project is to be crashed by reducing the completion time of one activity only.
What is the minimum time, in months, that the project can be completed in? 1 mark
Module 3 – Geometry and measurement
Question 1 (6 marks)Khaleda manufactures a face cream. The cream comes in a cylindrical container.
The area of the circular base is 43 cm2. The container has a height of 7 cm, as shown in the diagram below.
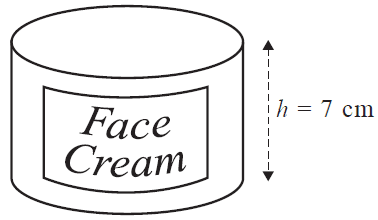
a. What is the volume of the container, in cubic centimetres? 1 mark
b. Write a calculation that shows that the radius of the cylindrical container, rounded to one decimal place, is 3.7 cm. 1 mark
c. What is the total surface area of the container, in square centimetres, including the base and the lid?
Round your answer to the nearest square centimetre. 1 mark
The diagram below shows the dimensions of a shelf that will display the containers.
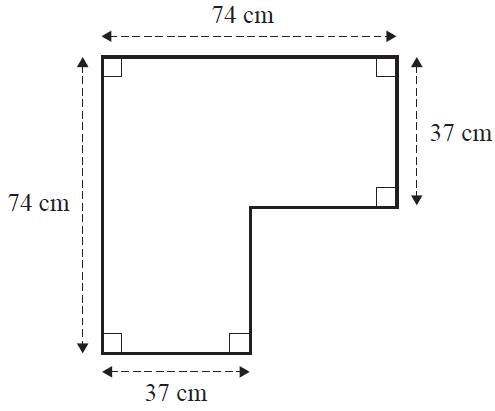
d. What is the perimeter of the shelf, in centimetres? 1 mark
e. The shelf will display the containers in a single layer. Each container will stand upright on the shelf.
What is the maximum number of containers that can fit on the shelf? 1 mark
f. The shelf sits against a wall at a 90° angle.
The shelf is supported by a 26 cm bracket that forms a 30° angle with the wall, as shown in the diagram below.
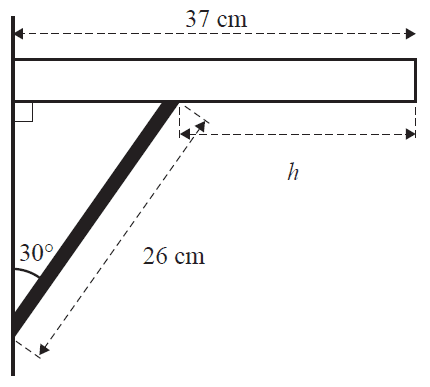
Find the value of \(h\), the distance between the edge of the shelf and the bracket, in centimetres. 1 mark
Khaleda has designed a logo for her business.
The logo contains two identical equilateral triangles.
The side length of each triangle is 4.8 cm, as shown in the diagram below.
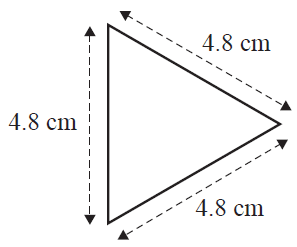
a. Write a calculation to show that the area of one of the triangles, rounded to the nearest centimetre, is 10 cm2. 1 mark
In the logo, the two triangles overlap, as shown below. Part of the logo is shaded and part of the logo is not shaded.
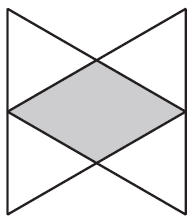
b. What is the area of the entire logo?
Round your answer to the nearest square centimetre. 1 mark
c. What is the ratio of the area of the shaded region to the area of the non-shaded region of the logo? 1 mark
d. The logo is enlarged and printed on boxes for shipping.
The enlarged logo and the original logo are similar in shape.
The area of the enlarged logo is four times the area of the original logo.
What is the height, in centimetres, of the enlarged logo? 1 mark
Khaleda manufactures the face cream in Dhaka, Bangladesh.
Dhaka is located at latitude 24° N and longitude 90° E.
Assume that the radius of Earth is 6400 km.
a. Write a calculation that shows that the radius of the small circle of Earth at latitude 24° N is 5847 km, rounded to the nearest kilometre. 1 mark
Khaleda receives an order from Abu Dhabi, United Arab Emirates (24° N, 54° E).
b. Find the shortest small circle distance between Dhaka and Abu Dhabi.
Round your answer to the nearest kilometre. 1 mark
Khaleda sends the order by plane from Dhaka (24° N, 90° E) to Abu Dhabi (24° N, 54° E).
The flight departs Dhaka at 1.00 pm and arrives in Abu Dhabi 11 hours later.
The time difference between Dhaka and Abu Dhabi is two hours.
c. What time did the flight arrive in Abu Dhabi? 1 mark
A helicopter takes the order from the airport to the customer’s hotel.
The hotel is 27 km south and 109 km east of the airport.
d. Show that the bearing of the hotel from the airport is 104°, correct to the nearest degree. 1 mark
e. After the delivery to the hotel, the helicopter returns to its hangar.
The hangar is located due south of the airport.
The helicopter flies directly from the hotel to the hangar on a bearing of 282°.
How far south of the airport is the hangar?
Round your answer to the nearest kilometre. 1 mark
Module 4 – Graphs and relations
Question 1 (3 marks)Kyla owns and manages a truck and car care business.
After a major repair on a truck, one of the mechanics took it on a long test drive.
The test drive started at 12 noon.
After four hours, the mechanic stopped to rest for one hour and then returned to the workshop.
The graph below shows the truck’s distance from the workshop, \(d\), in kilometres, and the number of hours of test driving, \(n\), after 12 noon.
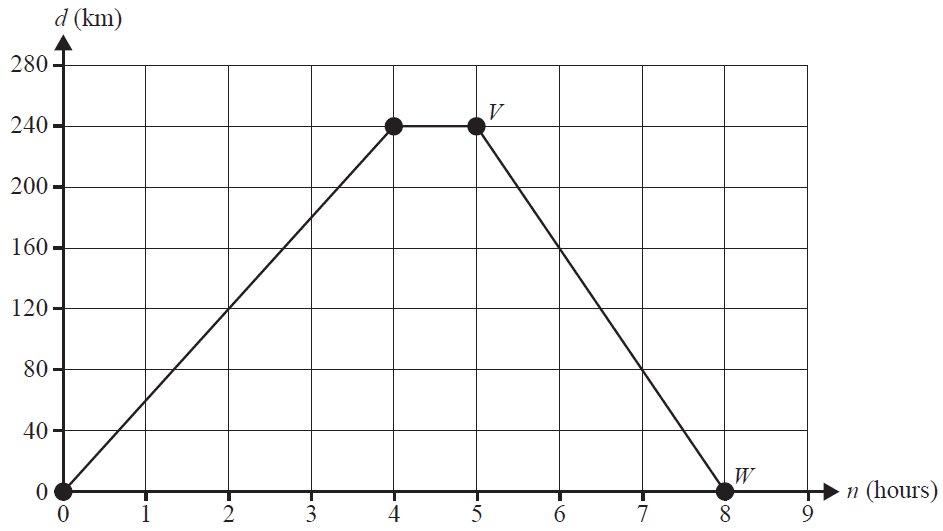
a. At what time of the day did the mechanic arrive back at the workshop? 1 mark
b. Find the average speed, in kilometres per hour, of the truck during the first four hours of the test drive. 1 mark
c. On the return trip, the truck travelled at an average speed of 80 km/h.
The equation of the line segment VW that represents this part of the test drive is of the form
\( d = k - 80n \)
Find the value of \(k\). 1 mark
Kyla organises fundraiser car shows at the business.
a. Fifteen stallholders pay a set-up fee of \$120 each.
Twenty-six competitors pay \$30 each to enter their cars to win prizes.
How much money in total is raised from stallholders and competitors at each car show? 1 mark
b. Admission fees for the show are \$5 per adult and \$2 per child.
\$1644 was raised from the 537 people who attended the most recent car show.
How many children attended this car show? 1 mark
c. The table below displays the speed of the car, \(s\), in kilometres per hour, and the fuel consumption, \(F\), in kilometres per litre, of one of the cars at two particular speeds.
| speed of the car (s) | 60 km/h | 100 km/h |
| fuel consumption (F) | 10 km/litre | 6 km/litre |
The equation \( F = \frac{k}{s} \), where \(k\) is the constant of proportionality, is used to model the relationship between fuel consumption and speed of the car.
Determine the fuel consumption of the car, in kilometres per litre, when it is travelling at 80 km/h. 1 mark
Kyla’s business also manufactures car seat covers.
The monthly revenue, \(R\), in dollars, from selling \(n\) seat covers is given by
\( R = 80n \)
This relationship is shown on the graph below.
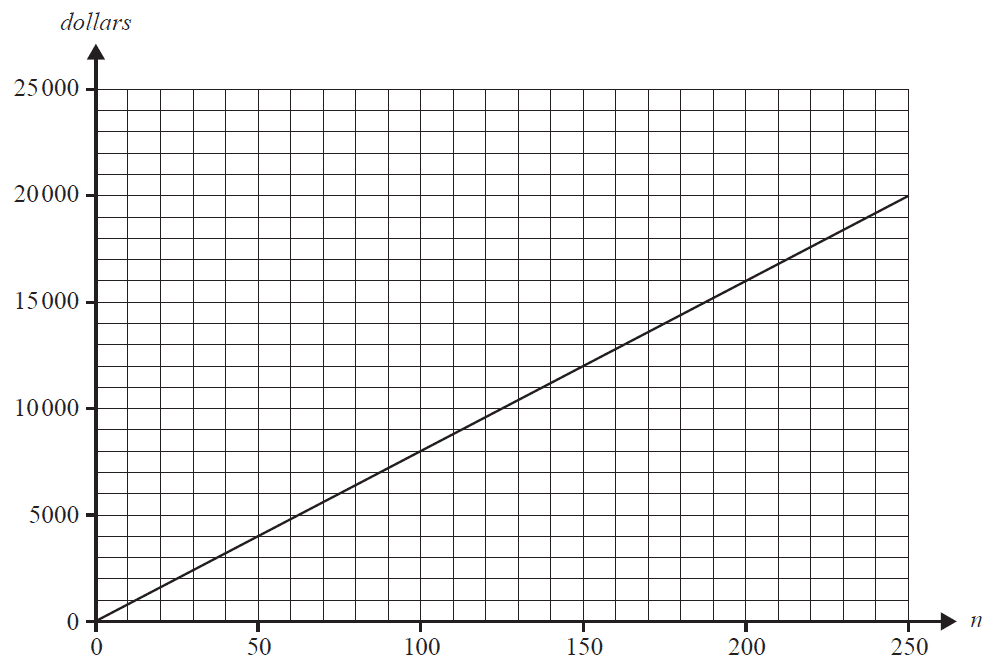
The monthly cost, \(C\), in dollars, of making \(n\) seat covers is given by
\( C = 36n + 5000 \)
a. Sketch the monthly cost, \(C\), of making \(n\) seat covers on the graph above. 1 mark
b. Find the least number of seat covers that need to be sold in order to make a profit. 1 mark
Last month, 180 seat covers were sold and the profit was \$2920.
Kyla believes that if she lowers the selling price of the seat covers she will sell 60 more seat covers this month.
c. If Kyla maintains the same profit of \$2920 this month, find the new selling price of the seat covers. 1 mark
d. Kyla finds that the monthly cost, \(C\), of making \(n\) seat covers changes when more than 300 seat covers are made.
The monthly cost, \(C\), of making \(n\) seat covers is now given by
\[ C = \begin{cases} 36n+5000 & 0 \leq n \leq 300 \\ mn+p & n > 300 \end{cases} \]
This is represented on the graph below.
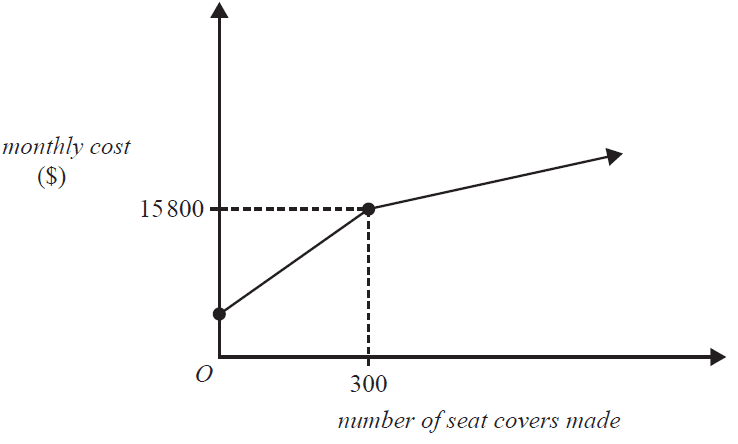
If 350 seat covers cost \$17 100 to make, find the value of \(m\). 1 mark
Another section of Kyla’s business services and details cars and trucks.
Every vehicle is both serviced and detailed.
Each car takes two hours to service and one hour to detail.
Each truck takes three hours to service and three hours to detail.
Let \(x\) represent the number of cars that are serviced and detailed each day.
Let \(y\) represent the number of trucks that are serviced and detailed each day.
Past records suggest there are constraints on the servicing and detailing of vehicles each day.
These constraints are represented by Inequalities 1 to 4 below.
Inequality 1 \(x \geq 16\)
Inequality 2 \(y \geq 10\)
Inequality 3 \(2x + 3y \leq 96\) (servicing department)
Inequality 4 \(x + 3y \leq 72\) (detailing department)
a. Explain the meaning of Inequality 1 in the context of this problem. 1 mark
b. Each employee at the business works eight hours per day.
What is the maximum number of employees who can work in the servicing department each day? 1 mark
The graph below shows the feasible region (shaded) that satisfies Inequalities 1 to 4.
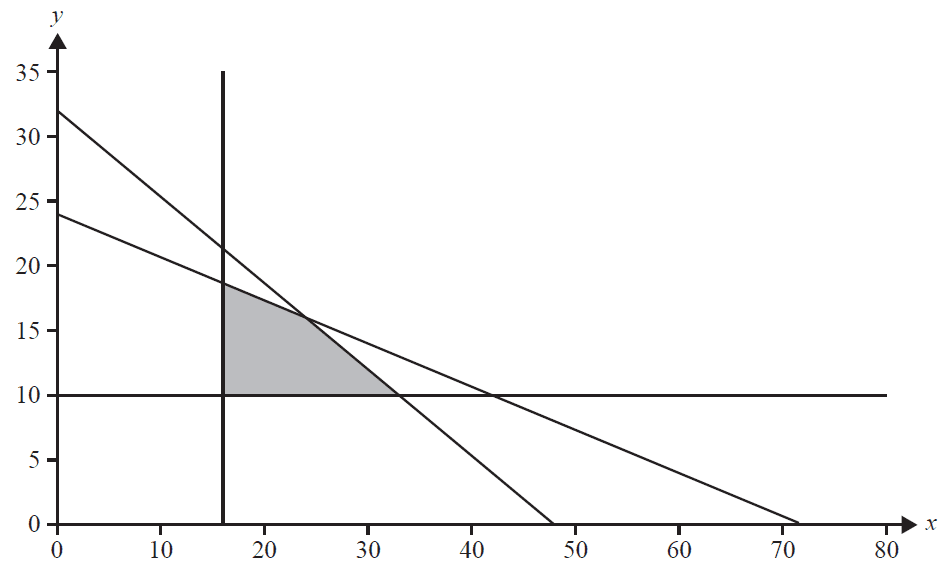
c. On a day when 20 cars are serviced and detailed, what is the maximum number of trucks that can be serviced and detailed? 1 mark
d. When servicing and detailing, the business makes a profit of \$150 per car and \$225 per truck.
List the points within the feasible region that will result in a maximum profit for the day. 2 marks
End of Multiple-Choice Question Book
VCE is a registered trademark of the VCAA. The VCAA does not endorse or make any warranties regarding this study resource. Past VCE exams and related content can be accessed directly at www.vcaa.vic.edu.au
