2023 QCE Maths Methods Paper 2 Mini Test 1
External Assessment Paper 2 — Technology-active
Number of marks: 10
Perusal time: 1 minute
Writing time: 15 minutes
Section 1
Instructions
• This section has 10 questions and is worth 10 marks.
• Use a 2B pencil to fill in the A, B, C or D answer bubble completely.
• Choose the best answer for Questions 1 10.
• If you change your mind or make a mistake, use an eraser to remove your response and fill in the new answer bubble completely.
If \(f(x) = \sin(3x)\), determine the value of \(f'(\frac{\pi}{8})\).
- (A) 2.772
- (B) 1.148
- (C) 0.929
- (D) 0.383
The probability of hitting a bullseye on a standard dartboard is 1 in 1250. What is the probability of hitting a bullseye exactly once in 10 attempts?
- (A) \(\binom{9}{1} \times (\frac{1}{1250})^1 \times (\frac{1249}{1250})^9\)
- (B) \(\binom{9}{1} \times (\frac{1}{1250})^0 \times (\frac{1249}{1250})^1\)
- (C) \(\binom{10}{1} \times (\frac{1}{1250})^1 \times (\frac{1249}{1250})^9\)
- (D) \(\binom{10}{1} \times (\frac{1}{1250})^9 \times (\frac{1249}{1250})^1\)
Section 2
Instructions
• Write using black or blue pen.
• Questions worth more than one mark require mathematical reasoning and/or working to be shown to support answers.
• If you need more space for a response, use the additional pages at the back of this book.
– On the additional pages, write the question number you are responding to.
– Cancel any incorrect response by ruling a single diagonal line through your work.
– Write the page number of your alternative/additional response, i.e. See page …
– If you do not do this, your original response will be marked.
• This section has nine questions and is worth 45 marks.
A researcher found that 17 out of 50 randomly selected people had used public transport in the past week.
a) Determine the sample proportion of people who had used public transport in the past week. [1 mark]
b) Determine an approximate 95% confidence interval for the proportion of people who had used public transport in the past week. [2 marks]
c) Someone claims that: 50% of people use public transport each week.
Use your answer from Question 11b) to explain whether the data can or cannot support this claim. [1 mark]
The graph shows the water level under a bridge over a 12-hour period.
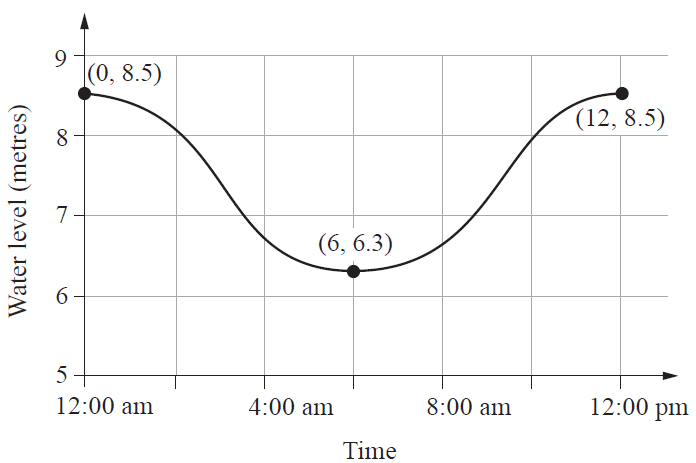
a) Determine the equation of the cosine function that models the water level as a function of time after 12:00 am. [1 mark]
b) How long in the 12-hour period shown is the rate of change of water level more than 0.55 metres per hour? [3 marks]
END OF PAPER