WACE Maths Methods ATAR Section 2 Topic Tests
Confidence Intervals for Proportions Topic Test 1
Section Two: Technology-active
Number of marks: 10
Reading time: 1 minute
Writing time: 10 minutes
Section Two:
Answer all questions. Write your answers in the spaces provided.
Supplementary pages for planning/continuing your answers to questions are provided at the end of this Question/Answer booklet. If you use these pages to continue an answer, indicate at the original answer where the answer is continued, i.e. give the page number.
A protest group looking to abolish the circulation of physical money (notes and coins) claims that 74% of Perth residents have not used physical money in the past 12 months. To investigate this claim, a data scientist surveys a random sample of Perth residents, with 70% claiming they had not used physical money in the past 12 months.
Let \(p\) denote the proportion of Perth residents who have not used physical money in the past 12 months.
(a) Given that the width of the 95% confidence interval for \(p\) is 0.096
(i) determine the 95% confidence interval for \(p\). (2 marks)
(ii) determine the number of people surveyed. (2 marks)
(b) What does the data scientist's confidence interval suggest about the protest group's claim? (2 marks)
The data scientist is interested in whether the proportion is similar to that in other Australian capital cities, and conducts surveys in Brisbane, Sydney and Hobart. The following information was recorded based on the survey results:
| City | Sample size | Sample proportion |
|---|---|---|
| Brisbane | \(N\) | \(0.65\) |
| Sydney | \(2N\) | \(0.65\) |
| Hobart | \(N\) | \(0.75\) |
(c) For each of the following city pairs, identify which had the widest 95% confidence interval. Justify your answer.
(i) Brisbane and Sydney (2 marks)
(ii) Brisbane and Hobart (2 marks)
End of questions
Confidence Intervals for Proportions Topic Test 2
Section Two: Technology-active
Number of marks: 13
Reading time: 1 minute
Writing time: 13 minutes
Section Two:
Answer all questions. Write your answers in the spaces provided.
Supplementary pages for planning/continuing your answers to questions are provided at the end of this Question/Answer booklet. If you use these pages to continue an answer, indicate at the original answer where the answer is continued, i.e. give the page number.
A book called 'Why I Love Mathematics' is having its first print run. This is scheduled to last for one week, using four printing presses. The publisher claims that, historically, 10 books have printing errors for every two hundred that are printed.
A sample of 200 books is to be chosen to determine how many contained errors. The proposed sampling procedure is to select the first 200 books printed over a 6-hour window using the newest printing press.
(a)
(i) Identify and explain one possible source of bias in the proposed sampling procedure. (2 marks)
(ii) Identify two changes to the sampling procedure that would reduce bias. (2 marks)
Assume that the sample was gathered using an improved procedure, and that the publisher's claim is correct.
(b) Use the approximate normality of the distribution of sample proportions to determine the probability that the sample proportion of books with errors is less than 0.04. (2 marks)
In a different random sample of 600 books, it is found that the proportion of books containing an error is 0.1, with a margin of error of 0.024.
(c) Determine a 95% confidence interval for the proportion of books that will have printing errors. (1 mark)
(d) On the basis of the confidence interval determined in part (c), is the proportion of books with printing errors different from what was claimed by the publisher? (2 marks)
(e) Suggest two changes that could be made in order to decrease the margin of error of the confidence interval. (2 marks)
(f) Determine the minimum sample size that would be necessary to guarantee that the margin of error of the resulting 95% confidence interval was at most 0.02. (2 marks)
End of questions
Confidence Intervals for Proportions Topic Test 3
Section Two: Technology-active
Number of marks: 15
Reading time: 1 minute
Writing time: 15 minutes
Section Two:
Answer all questions. Write your answers in the spaces provided.
Supplementary pages for planning/continuing your answers to questions are provided at the end of this Question/Answer booklet. If you use these pages to continue an answer, indicate at the original answer where the answer is continued, i.e. give the page number.
A mathematics teacher uses a coin flip activity to demonstrate confidence intervals to their class. They flip a fair coin 50 times in front of the class and observe 30 heads and 20 tails.
(a) Calculate a 90% confidence interval for the proportion of heads obtained when the coin is flipped. (2 marks)
As a homework exercise, the teacher asks all 20 students in the class to repeat the coin activity and calculate their own individual 90% confidence interval for the proportion of heads. Let \(X\) be a random variable that denotes the number of students whose confidence interval contains the true proportion of heads.
(b) State the distribution for \(X\). (2 marks)
(c) Determine the expected value and variance of \(X\). (2 marks)
(d) Calculate the probability that the confidence intervals of three students do not contain the true proportion. (2 marks)
Fingerprints can be classified broadly as loop-shaped, whirl-shaped or arch-shaped. Only 5% of the world's population have arch-shaped fingerprints. Consider a random sample of 36 people and let \(\hat{p}\) denote the sample proportion of people with arch-shaped fingerprints. The probability distribution for \(\hat{p}\) is shown below.
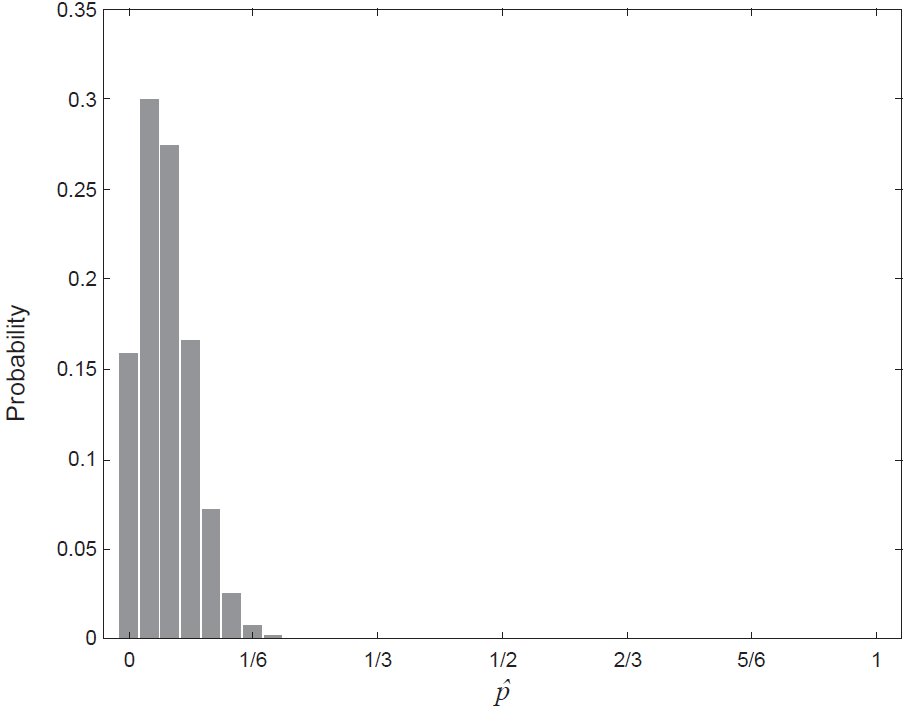
(a) On the basis of the diagram above, is it appropriate to use the normal distribution to approximate the distribution of \(\hat{p}\)? Justify your answer. (2 marks)
A larger sample of 500 people is selected at random.
(b) Determine the probability that more than 30 people in the sample have arch-shaped fingerprints. (3 marks)
(c) Use the approximate normality of the distribution to determine the probability that the sample proportion of people with arch-shaped fingerprints is greater than 0.06. (2 marks)
End of questions
Confidence Intervals for Proportions Topic Test 4
Section Two: Technology-active
Number of marks: 14
Reading time: 1 minute
Writing time: 14 minutes
Section Two:
Answer all questions. Write your answers in the spaces provided.
Supplementary pages for planning/continuing your answers to questions are provided at the end of this Question/Answer booklet. If you use these pages to continue an answer, indicate at the original answer where the answer is continued, i.e. give the page number.
A factory produces pre-packed servings of udon noodles. The noodles are dispensed into packets of individual servings by a machine. However, there is variation in the serving sizes dispensed. The specifications attached to the side of the machine have been partially destroyed, so the only available information is that the mass in grams, \(X\), of noodles dispensed is normally distributed, \(P(X \le 150) = 0.0228\) and \(P(X \ge 165) = 0.1587\).
(a) Determine the mean and standard deviation of the mass of noodles dispensed by the machine. (3 marks)
The factory sells trays containing 20 packets of individual servings of udon noodles to restaurants. A standard individual serving should have a mass of at least 150 g.
(b) Determine the probability that a tray of noodles contains no underweight servings. (3 marks)
Following some customer complaints about their serving sizes, the manager of the factory decides to investigate. They select a random sample of 200 individual servings of udon noodles and determine a confidence interval for the proportion \(p\) of underweight servings to be (0.0651, 0.1349).
(c) Determine the margin of error of the confidence interval. (1 mark)
(d) Determine the level of confidence that was used to calculate the confidence interval. (3 marks)
(e) On the basis of the above confidence interval, is the proportion of underweight servings of udon noodles different from what was claimed in the machine specifications? (2 marks)
(f) All else remaining equal, state how the margin of error would change if
(i) the confidence level was decreased. (1 mark)
(ii) the sample size was increased from 200 to 500. (1 mark)
End of questions
Confidence Intervals for Proportions Topic Test 5
Section Two: Technology-active
Number of marks: 17
Reading time: 1 minute
Writing time: 17 minutes
Section Two:
Answer all questions. Write your answers in the spaces provided.
Supplementary pages for planning/continuing your answers to questions are provided at the end of this Question/Answer booklet. If you use these pages to continue an answer, indicate at the original answer where the answer is continued, i.e. give the page number.
The Carnaby’s Black Cockatoo is a bird native to southwest Australia. A birdwatcher is interested in estimating the proportion, \(p\), of birds living in a Western Australian national park that are Carnaby’s Black Cockatoos. The birdwatcher visited the national park one morning and, standing at their favourite bird-watching location, observed 200 birds flying past. Seventy-six of those birds were Carnaby’s Black Cockatoos.
(a) On the basis of the sample, determine a point estimate for \(p\). (1 mark)
(b) On the basis of the sample, determine a 95% confidence interval for \(p\). (2 marks)
(c) What is the minimum number of birds that would need to be sampled to ensure that the margin of error of the 95% confidence interval for \(p\) is at most 0.02? (2 marks)
(d) Identify and explain two sources of bias in the birdwatcher’s sampling method. (4 marks)
A charity organisation has printed 'Lucky 7' scratchie tickets as a fundraiser for use at two special events. The tickets contain two panels. Each ticket has the same numbers as the sample ticket shown below, arranged randomly and hidden within each panel.
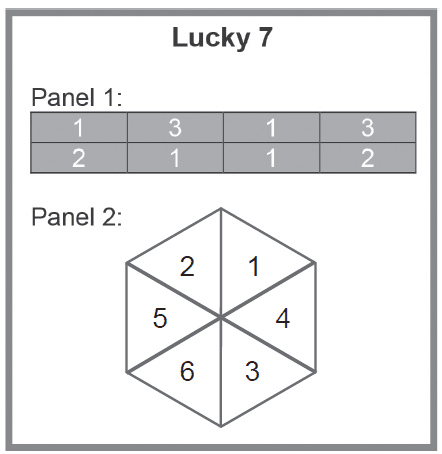
A player scratches one section of each panel to reveal a number. The two numbers revealed are then added together. If the total is seven or higher, the player wins a prize.
At the first event, 400 tickets are purchased, and a prize is won on 124 occasions. Let \(\hat{p}\) denote the probability that a prize is won.
(a) Determine the sample proportion of times that a prize is won at the first event. (1 mark)
(b) Show that the probability \(p\) of winning a prize is \( \frac{7}{24} \). (2 marks)
(c) Calculate the mean and standard deviation of the sample proportion of times a prize is won when 400 tickets are purchased. (2 marks)
(d) At a second event, 400 scratchie tickets are again purchased. If the sample proportion was 0.6 standard deviations from the population proportion, how many prizes were won at the second event? (3 marks)
End of questions
Confidence Intervals for Proportions Topic Test 6
Section Two: Technology-active
Number of marks: 16
Reading time: 1 minute
Writing time: 16 minutes
Section Two:
Answer all questions. Write your answers in the spaces provided.
Supplementary pages for planning/continuing your answers to questions are provided at the end of this Question/Answer booklet. If you use these pages to continue an answer, indicate at the original answer where the answer is continued, i.e. give the page number.
The Larje Machine Co manufactures metal rods for large industrial equipment. Their standard manufacturing process produces rods whose lengths are normally distributed with a mean of 400 cm, and a standard deviation of 5 cm. A rod is considered 'useable' if its length is between 395 cm and 405 cm.
Let \(X\) be a random variable denoting the length of a rod manufactured by the Larje Machine Co.
(a) Determine the probability that a rod manufactured by the Larje Machine Co is useable. Round your answer to three decimal places. (3 marks)
Recently the Larje Machine Co introduced a new manufacturing process that industry experts claim will improve the percentage of useable rods produced to 80%. The quality control department decides to investigate whether this standard is being achieved and plan to collect a random sample of rods manufactured using the new process.
(b) What condition must the sample satisfy in order to use a normal distribution to model the sample proportion of useable rods? (1 mark)
The quality control department collects a sample of 100 rods.
(c) What is the approximate distribution of the sample proportion of useable rods? (2 marks)
Upon measuring the sample of 100 rods, it is found that 75 are useable.
(d) Calculate a 95% confidence interval for the population proportion of useable rods. (3 marks)
(e) The quality control department would like to obtain a confidence interval with a smaller margin of error. State two methods that it could use to achieve this. (2 marks)
(f) The quality control department decides to select a new sample for which the maximum possible margin of error for a 95% confidence interval is 0.05. What sample size will achieve this requirement? (3 marks)
(g) The new sample yields the 95% confidence interval (0.717, 0.803). On the basis of this sample, is the proportion of useable rods different from what was claimed by the industry experts? Justify your answer. (2 marks)
End of questions
Confidence Intervals for Proportions Topic Test 7
Section Two: Technology-active
Number of marks: 14
Reading time: 1 minute
Writing time: 14 minutes
Section Two:
Answer all questions. Write your answers in the spaces provided.
Supplementary pages for planning/continuing your answers to questions are provided at the end of this Question/Answer booklet. If you use these pages to continue an answer, indicate at the original answer where the answer is continued, i.e. give the page number.
A carnival game involves five buckets, each containing 5 blue balls and 15 red balls. A player blindly selects a ball from each bucket and wins the game if they select at least 4 blue balls. Let \(X\) denote the number of blue balls selected.
(a) State the distribution of \(X\), including its parameters. (2 marks)
(b) What is the probability of a player winning the game on any given attempt? (2 marks)
(c) Players are charged $2 for each attempt at the game and offered a $150 prize if they win the game. By providing appropriate numerical justification, explain why this is not a good idea for the carnival organisers. (2 marks)
An observer records the outcome of 100 consecutive games and determines the 90% and 95% confidence intervals for the proportion of wins, \(p\). The confidence intervals are (0.04, 0.16) and (0.05, 0.15).
(d) Which of these intervals is the 95% confidence interval for \(p\)? Justify your answer. (2 marks)
(e) How many wins were observed out of the 100 games? (2 marks)
(f) Determine what you would expect to happen to the width of the confidence intervals if 400 games had been observed. (2 marks)
(g) The true proportion of wins does not lie within either of the above confidence intervals. Does this suggest that a sampling error was made? Justify your answer. (2 marks)
End of questions
Confidence Intervals for Proportions Topic Test 8
Section Two: Technology-active
Number of marks: 17
Reading time: 1 minute
Writing time: 17 minutes
Section Two:
Answer all questions. Write your answers in the spaces provided.
Supplementary pages for planning/continuing your answers to questions are provided at the end of this Question/Answer booklet. If you use these pages to continue an answer, indicate at the original answer where the answer is continued, i.e. give the page number.
A new political party, the Sustainable Energy Party, is planning to have candidates run in the next election. Researchers have collected data that suggests the proportion of voters likely to vote for the party to be 23%.
One year before the next election, random samples of 400 voters were taken in a particular electorate. Let \(\hat{p}\) denote the sample proportion of voters who indicated they would vote for the Sustainable Energy Party at the next election.
(a) State the distribution of \(\hat{p}\). (3 marks)
(b) Calculate the probability that the proportion of voters likely to vote for the Sustainable Energy Party in a sample of 400 is less than 0.20. (3 marks)
One week before the election, researchers believed that the proportion of voters likely to vote for the party in that same electorate had increased. A random sample of 200 voters was taken at this time, and 55 of them indicated they would vote for the Sustainable Energy Party at the next election.
(c) Based on this sample, estimate the proportion of voters likely to vote for the Sustainable Energy Party in this electorate. (1 mark)
(d) For a 99% confidence interval, what is the margin of error of the sample proportion of voters likely to vote for the Sustainable Energy Party in this electorate, based on this sample? (2 marks)
(e) Based on this sample, calculate a 95% confidence interval for the population proportion of voters likely to vote for the Sustainable Energy Party in this electorate. (3 marks)
(f) Based on the research, did the proportion of voters likely to vote for the Sustainable Energy Party in this electorate increase in the year leading up to the election? Justify your answer. (2 marks)
(g) The analysis above models the number of voters likely to vote for the Sustainable Energy Party as binomially distributed. State and discuss the validity of any assumptions for the binomial distribution in this context. (3 marks)
End of questions
Confidence Intervals for Proportions Topic Test 9
Section Two: Technology-active
Number of marks: 10
Reading time: 1 minute
Writing time: 10 minutes
Section Two:
Answer all questions. Write your answers in the spaces provided.
Supplementary pages for planning/continuing your answers to questions are provided at the end of this Question/Answer booklet. If you use these pages to continue an answer, indicate at the original answer where the answer is continued, i.e. give the page number.
A suburban council hires a consultant to estimate the proportion of residents of the suburb who use its library.
(a) The consultant decides to estimate a 95% confidence interval for the proportion to within an error of 0.01. What minimum sample size should be selected? (3 marks)
(b) If resource limitations dictate that the maximum sample size that can be managed is 500, what is the maximum margin of error in estimating a 99% confidence interval? (3 marks)
The consultant decides to select the sample by standing on the roadside outside the library at lunchtime and asking a random sample of the passers-by whether they use the library.
(c) Identify and explain two possible sources of bias with this sampling scheme. (4 marks)
End of questions
Confidence Intervals for Proportions Topic Test 10
Section Two: Technology-active
Number of marks: 21
Reading time: 2 minutes
Writing time: 21 minutes
Section Two:
Answer all questions. Write your answers in the spaces provided.
Supplementary pages for planning/continuing your answers to questions are provided at the end of this Question/Answer booklet. If you use these pages to continue an answer, indicate at the original answer where the answer is continued, i.e. give the page number.
It is estimated that 20% of small businesses fail in the first year. A business advisory group takes a random sample of 500 new businesses that started in January 2018. An analyst employed by the group suggests the use of the binomial distribution is appropriate in this case.
(a) What is the probability that at most 120 of the businesses fail in the first year? (2 marks)
(b) What is the approximate distribution of the sample proportion of small businesses that fail by the end of the year in this sample? Justify your answer. (3 marks)
(c) What is the probability that the sample proportion of businesses that fail by the end of the year is less than 0.18? (2 marks)
(d) By January 2019, 90 of the 500 new businesses had failed. Calculate a 95% confidence interval for the proportion of new businesses that fail in the first year. (2 marks)
The business advisory group believes that the proportion of new businesses that fail within a year can be reduced by providing financial advice. They took another random sample of 500 businesses that started in January 2019 and provided them with regular financial advice. In this random sample, at the end of the year 80 businesses had failed.
(e) Calculate the sample proportion and its margin of error at the 95% confidence level. (2 marks)
(f) Calculate a 95% confidence interval for the proportion of businesses that failed. What do you conclude regarding the value of the financial advice provided to the new businesses? (4 marks)
(g) If the sample size was reduced, what would be the effect on the confidence interval? Justify your answer. (2 marks)
(h) State two assumptions that the analyst made in recommending the use of the binomial model in this case and discuss whether they are valid. (4 marks)
End of questions
Confidence Intervals for Proportions Topic Test 11
Section Two: Technology-active
Number of marks: 10
Reading time: 1 minute
Writing time: 10 minutes
Section Two:
Answer all questions. Write your answers in the spaces provided.
Supplementary pages for planning/continuing your answers to questions are provided at the end of this Question/Answer booklet. If you use these pages to continue an answer, indicate at the original answer where the answer is continued, i.e. give the page number.
The proportion of caravans on the road being towed by vehicles that have the incorrect towing capacity is \(p\).
(a) Show, using calculus, that to maximise the margin of error a value of \(\hat{p} = 0.5\) should be used. Note: As \(z\) and \(n\) are constants, the standard error formula can be reduced to \(E = \sqrt{\hat{p}(1-\hat{p})}\). (3 marks)
(b) A consulting firm wants to determine \(p\) within 8% with 99% confidence. How many towing vehicles should be tested at a random check? (3 marks)
(c) Six months later, the consulting firm carries out a random sampling of towing vehicles. A 99% confidence interval calculated for the proportion of vehicles with incorrect towing capacity is (0.342, 0.558). Determine the number of vehicles in the sample that have an incorrect towing capacity. (4 marks)
End of questions
Confidence Intervals for Proportions Topic Test 12
Section Two: Technology-active
Number of marks: 11
Reading time: 1 minute
Writing time: 11 minutes
Section Two:
Answer all questions. Write your answers in the spaces provided.
Supplementary pages for planning/continuing your answers to questions are provided at the end of this Question/Answer booklet. If you use these pages to continue an answer, indicate at the original answer where the answer is continued, i.e. give the page number.
Alex is a beekeeper and has noticed that some of the bees are very sleepy. She takes a random sample of 320 bees and finds that 15 of them are indeed so-called lullabees that fall asleep easily.
(a) Calculate the sample proportion of lullabees. (1 mark)
(b) Determine a 90% confidence interval for the true proportion of lullabees, rounded to four decimal places. (3 marks)
(c) What is the margin of error in the above estimate? (2 marks)
It turns out that the true proportion of lullabees is 0.02.
(d) Now that Alex knows this, she decides to take a new sample.
(i) Suppose a new sample of 290 bees was taken. Given that the true proportion of lullabees is 0.02, what is the probability that the sample proportion in this new sample is at most 0.03? (3 marks)
(ii) If Alex takes a larger sample, will the above probability increase or decrease? Explain. (2 marks)
End of questions
Confidence Intervals for Proportions Topic Test 13
Section Two: Technology-active
Number of marks: 13
Reading time: 1 minute
Writing time: 13 minutes
Section Two:
Answer all questions. Write your answers in the spaces provided.
Supplementary pages for planning/continuing your answers to questions are provided at the end of this Question/Answer booklet. If you use these pages to continue an answer, indicate at the original answer where the answer is continued, i.e. give the page number.
The Slate Tablet Company produces a variety of electronic tablets. It wants to gather information on consumers' interest in its tablets.
(a) In each of the following cases, comment, giving reasons, whether or not the proposed sampling method introduces bias.
(i) A Slate Tablet Company representative stood outside an electronics store on a Saturday morning and asked people entering the store 'If you were to purchase an electronic tablet would you choose a Slate Tablet or an inferior brand?' (2 marks)
(ii) Fifteen hundred randomly selected mobile phone numbers were telephoned and people were asked 'Which brand of electronic tablet do you prefer?' (2 marks)
A common problem with a particular tablet is screen failure. The manufacturer of Slate Tablets has found that 1% of its tablet screens will fail within three years. A sample of 200 tablets is taken. Let the random variable \(\hat{X}\) denote the number of tablets that have screen failure within three years in the sample of 200.
(b) What is the distribution of \(\hat{X}\)? (2 marks)
(c) What is the probability that more than four tablets will have screen failure within three years? (2 marks)
In a random sample of 200 Slate Tablets, four of them had screen failure within three years.
(d) Calculate an approximate 95% confidence interval for the proportion of tablets that have screen failure within three years. Give your answer to four decimal places. (3 marks)
(e) The company's quality control department wants the proportion of tablets with faulty screens to be between 0.5% and 1%. Based on your confidence interval, decide whether the quality control department is meeting its target. Justify your decision. (2 marks)
End of questions
Confidence Intervals for Proportions Topic Test 14
Section Two: Technology-active
Number of marks: 9
Reading time: 1 minute
Writing time: 9 minutes
Section Two:
Answer all questions. Write your answers in the spaces provided.
Supplementary pages for planning/continuing your answers to questions are provided at the end of this Question/Answer booklet. If you use these pages to continue an answer, indicate at the original answer where the answer is continued, i.e. give the page number.
While leaving a shopping centre a mathematician accidentally drops a bag of apples at the top of a ramp of length 10 m and width 2 m. The diagram below shows the top view of the ramp. Four of the apples roll safely to the end of the ramp, while six roll off an edge and splatter on the ground below.
The mathematician decides to create a simple model by assuming that the:
- apples roll independently of one another along straight lines from the apple drop point
- direction each apple rolls, \(\theta\), is an angle measured about the apple drop point and is uniformly distributed over \(0 \le \theta \le \pi\).
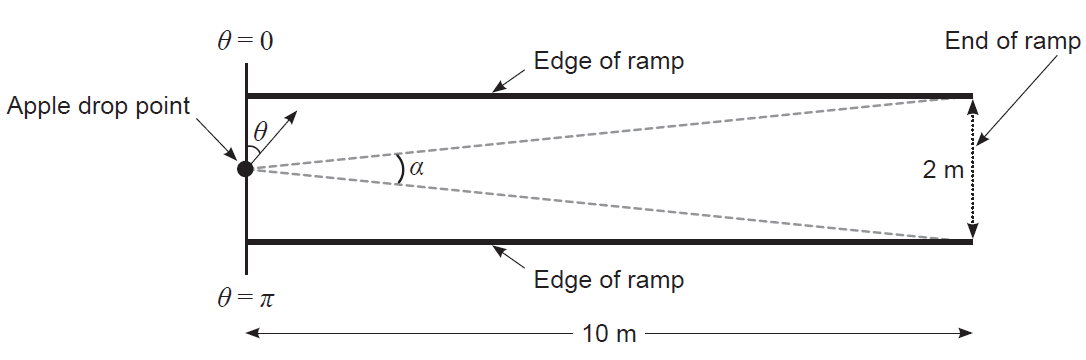
Apples that roll along a line within the sector marked by \(\alpha\) will arrive safely at the end of the ramp, while others will roll off the edge.
(a) (i) Determine the value of \(\alpha\). (2 marks)
(ii) Hence show that the probability, \(p\), of an apple rolling safely to the end of the ramp is \(p = 0.063\) (rounded to three decimal places). (1 mark)
(b) Determine the probability that, of the 10 apples, four or more make it safely to the end of the ramp. (2 marks)
The mathematician decides to purchase another 20 bags of apples, i.e. 200 apples, return to the top of the ramp, and break each bag open one at a time. After the experiment a total of 63 apples have rolled safely to the end of the ramp.
(c) Using the sample of 200 apples, calculate a 99% confidence interval for the population proportion of apples that will roll safely to the end of the ramp. (2 marks)
(d) What does the confidence interval from part (c) suggest about the validity of the model assumptions used to calculate the probability in part (a)(ii)? (2 marks)
End of questions
Confidence Intervals for Proportions Topic Test 15
Section Two: Technology-active
Number of marks: 12
Reading time: 1 minute
Writing time: 12 minutes
Section Two:
Answer all questions. Write your answers in the spaces provided.
Supplementary pages for planning/continuing your answers to questions are provided at the end of this Question/Answer booklet. If you use these pages to continue an answer, indicate at the original answer where the answer is continued, i.e. give the page number.
According to the Association of Poultry Farmers, 35% of people living in Melbourne purchase free-range eggs.
(a) If a random sample of 100 people living in Melbourne is surveyed, what is the probability that the sample proportion of people who purchase free-range eggs will be less than 0.28? (3 marks)
A market research company wants to know whether the proportion \(p\) of people living in Perth who purchase free-range eggs is similar to that of Melbourne. A junior employee proposes that it gather a sample of shoppers by standing outside a particular shop between 9 am and 10 am on a Tuesday morning and asking all shoppers entering the shop if they purchase free-range eggs.
(b) Identify and explain two sources of bias in the proposed sampling method. (4 marks)
The company does not follow the suggestion of the junior employee and instead randomly samples 243 people living in Perth and asks them whether they purchase free-range eggs. On the basis of the results of their survey, a confidence interval for \(p\) is calculated to be (0.2520, 0.3488).
(c) Determine the number of people in the sample who purchase free-range eggs. (2 marks)
(d) Determine the level of confidence that was used to calculate the confidence interval. (3 marks)
End of questions
Confidence Intervals for Proportions Topic Test 16
Section Two: Technology-active
Number of marks: 14
Reading time: 1 minute
Writing time: 14 minutes
Section Two:
Answer all questions. Write your answers in the spaces provided.
Supplementary pages for planning/continuing your answers to questions are provided at the end of this Question/Answer booklet. If you use these pages to continue an answer, indicate at the original answer where the answer is continued, i.e. give the page number.
Tina believes that approximately 60% of the mangoes she produces on her farm are large. She takes a random sample of 500 mangoes from a day's picking.
(a) Assuming Tina is correct and 60% of the mangoes her farm produces are large, what is the approximate probability distribution of the sample proportion of large mangoes in her sample? (3 marks)
(b) What is the probability that the sample proportion of large mangoes is less than 0.58? (2 marks)
(c) Tina decides to select the mangoes for her sample as they pass along the conveyor belt to be sorted. Describe briefly how Tina should select her sample. (2 marks)
A random sample of 500 contains 250 large mangoes.
(d) On the basis of this data, estimate the proportion of large mangoes produced on the farm. (1 mark)
(e) Calculate a 95% confidence interval for the proportion of large mangoes produced on the farm, rounded to four decimal places. (3 marks)
(f) On the basis of your calculations, how would you respond to Tina's belief that the proportion of large mangoes produced is at least 60%? Justify your response. (2 marks)
(g) What can Tina do to further test her belief? (1 mark)
End of questions