2018 VCE Maths Methods Mini Test 3
Number of marks: 10
Reading time: 2 minutes
Writing time: 15 minutes
Section A – Calculator Allowed
Instructions
• Answer all questions in pencil on your Multiple-Choice Answer Sheet.
• Choose the response that is correct for the question.
• A correct answer scores 1; an incorrect answer scores 0.
• Marks will not be deducted for incorrect answers.
• No marks will be given if more than one answer is completed for any question.
• Unless otherwise indicated, the diagrams in this book are not drawn to scale.
Consider \(f(x) = x^2 + \frac{p}{x}, x \neq 0, p \in R\).
There is a stationary point on the graph of \(f\) when \(x = -2\).
The value of \(p\) is
- A. \(-16\)
- B. \(-8\)
- C. \(2\)
- D. \(8\)
- E. \(16\)
Let \(f\) and \(g\) be two functions such that \(f(x) = 2x\) and \(g(x+2) = 3x+1\).
The function \(f(g(x))\) is
- A. \(6x-5\)
- B. \(6x+1\)
- C. \(6x^2+1\)
- D. \(6x-10\)
- E. \(6x+2\)
Let \(f: R^+ \to R, f(x) = k\log_2(x), k \in R\).
Given that \(f^{-1}(1) = 8\), the value of \(k\) is
- A. \(0\)
- B. \(\frac{1}{3}\)
- C. \(3\)
- D. \(8\)
- E. \(12\)
End of Section A
Section B – No Calculator
Instructions
• Answer all questions in the spaces provided.
• Write your responses in English.
• In questions where a numerical answer is required, an exact value must be given unless otherwise specified.
• In questions where more than one mark is available, appropriate working must be shown.
• Unless otherwise indicated, the diagrams in this book are not drawn to scale.
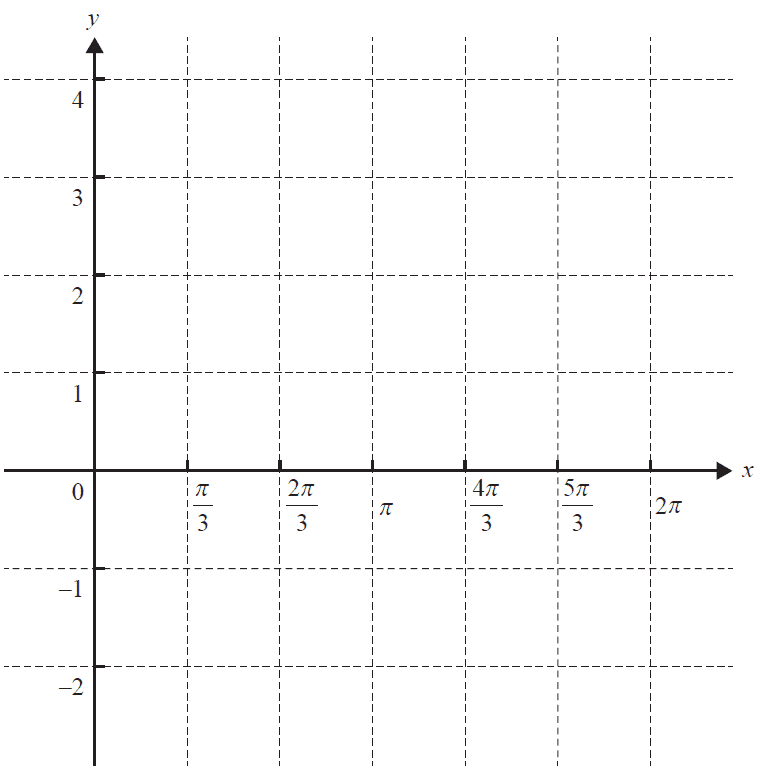
Let \( f: [0, 2\pi] \rightarrow \mathbb{R}, f(x) = 2\cos(x) + 1 \).
a. Solve the equation \( 2\cos(x) + 1 = 0 \) for \( 0 \le x \le 2\pi \). 2 marks
b. Sketch the graph of the function \(f\) on the axes below. Label the endpoints and local minimum point with their coordinates. 3 marks
Let \(X\) be a normally distributed random variable with a mean of 6 and a variance of 4. Let \(Z\) be a random variable with the standard normal distribution.
a. Find \( \Pr(X > 6) \). 1 mark
b. Find \(b\) such that \( \Pr(X > 7) = \Pr(Z < b) \). 1 mark
End of examination questions
VCE is a registered trademark of the VCAA. The VCAA does not endorse or make any warranties regarding this study resource. Past VCE exams and related content can be accessed directly at www.vcaa.vic.edu.au