VCE General Maths Data Analysis 2024 Mini Test 2
This is the full VCE General Maths Exam with worked solutions. You can also try Mini-Tests, which are official VCAA exams split into short tests you can do anytime.
Number of marks: 8
Reading time: 3 minutes
Writing time: 18 minutes
Instructions
• Answer all questions in pencil on your Multiple-Choice Answer Sheet.
• Choose the response that is correct for the question.
• A correct answer scores 1; an incorrect answer scores 0.
• Marks will not be deducted for incorrect answers.
• No marks will be given if more than one answer is completed for any question.
• Unless otherwise indicated, the diagrams in this book are not drawn to scale.
Data analysis - 2024 (Part 2)
Use the following information to answer Questions 9 and 10.
The least squares equation for the relationship between the average number of male athletes per competing nation, males, and the number of the Summer Olympic Games, number, is
males = 67.5 – 1.27 × number
The summary statistics for the variables number and males are shown in the table below.
| number | males | |
|---|---|---|
| mean | 15.0 | 48.4 |
| standard deviation | 8.51 | 19.0 |
The value of Pearson's correlation coefficient, \(r\), rounded to three decimal places, is closest to
- A. –0.569
- B. –0.394
- C. 0.394
- D. 0.569
At which Summer Olympic Games will the predicted average number of males be closest to 25.6?
- A. 31st
- B. 32nd
- C. 33rd
- D. 34th
Use the following information to answer Questions 11 and 12.
The number of breeding pairs of a small parrot species has been declining over recent years. The table below shows the number of breeding pairs counted, pairs, and the year number, year, for the last 12 years. A scatterplot of this data is also provided.
The association between pairs and year is non-linear.
| year | pairs |
|---|---|
| 1 | 320 |
| 2 | 250 |
| 3 | 225 |
| 4 | 208 |
| 5 | 190 |
| 6 | 180 |
| 7 | 170 |
| 8 | 165 |
| 9 | 160 |
| 10 | 158 |
| 11 | 155 |
| 12 | 150 |
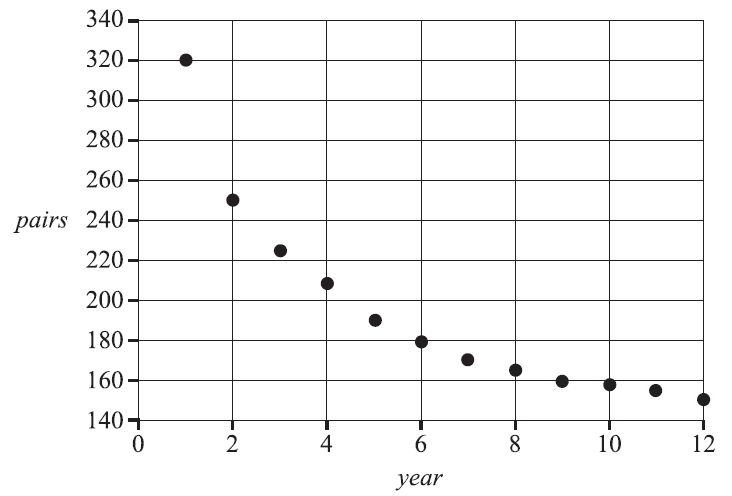
The scatterplot can be linearised using a logarithmic (base 10) transformation applied to the explanatory variable.
The least squares equation calculated from the transformed data is closest to
- A. \( \log_{10}(\textit{pairs}) = 2.44 – 0.0257 \times \textit{year} \)
- B. \( \log_{10}(\textit{pairs}) = 151 – 303 \times \textit{year} \)
- C. \( \textit{pairs} = 274 – 12.3 \times \log_{10}(\textit{year}) \)
- D. \( \textit{pairs} = 303 – 151 \times \log_{10}(\textit{year}) \)
A reciprocal transformation applied to the variable pairs can also be used to linearise the scatterplot.
When a least squares line is fitted to the plot of \( \frac{1}{\textit{pairs}} \) versus year, the largest difference between the actual value and the predicted value occurs at year
- A. 1
- B. 2
- C. 11
- D. 12
Use the following information to answer Questions 13 and 14.
A school runs an orientation program for new staff each January.
The time series plot below shows the number of new staff, new, for each year, year, from 2011 to 2022 (inclusive).
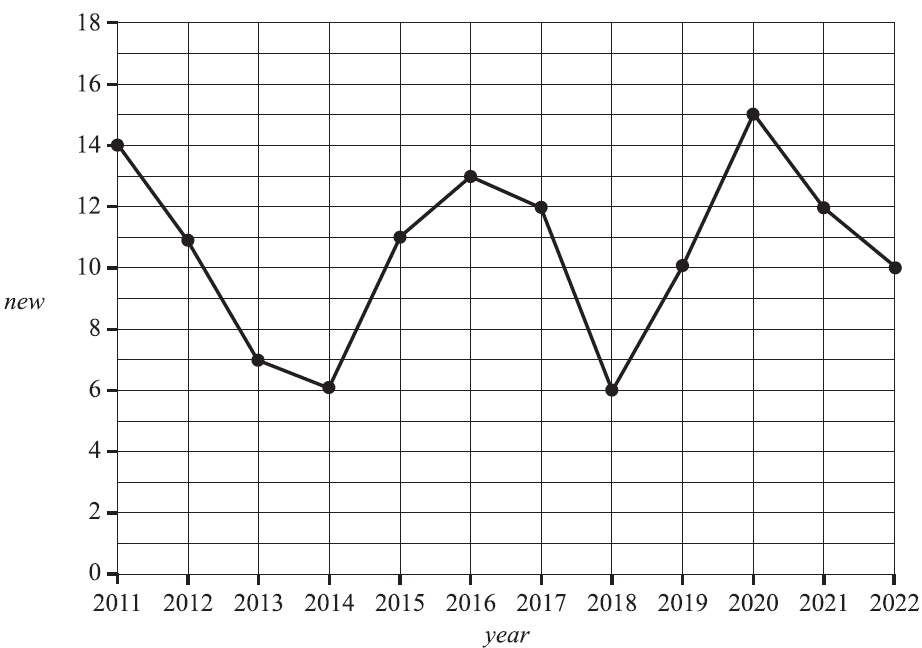
The time series is smoothed using seven-median smoothing.
The smoothed value of new for the year 2016 is
- A. 10
- B. 11
- C. 12
- D. 13
The number of new staff in 2023 is added to the total number of new staff from the previous 12 years.
For these 13 years, the mean number of new staff is 11.
The number of new staff in 2023 is
- A. 11
- B. 16
- C. 17
- D. 19
The table below shows the total number of cans of soft drink sold each month at a suburban cafe in 2023.
| Month | 1 | 2 | 3 | 4 | 5 | 6 | 7 | 8 | 9 | 10 | 11 | 12 |
| Cans sold | 316 | 321 | 365 | 306 | 254 | 308 | 354 | 357 | 381 | 355 | 365 | 324 |
The six-mean smoothed value of the number of cans sold, with centring, for month 5 is closest to
- A. 315
- B. 318
- C. 321
- D. 324
The table below shows the seasonal indices for the monthly takings of a bistro.
The seasonal indices for months 3 and 6 are missing.
| Month | 1 | 2 | 3 | 4 | 5 | 6 | 7 | 8 | 9 | 10 | 11 | 12 |
| Seasonal index | 1.08 | 1.13 | 0.92 | 0.67 | 1.09 | 1.35 | 0.82 | 0.88 | 1.01 | 0.98 |
The seasonal index for month 3 is twice the seasonal index for month 6.
The seasonal index for month 3 is closest to
- A. 0.69
- B. 1.04
- C. 1.38
- D. 2.07
End of Multiple-Choice Question Book
VCE is a registered trademark of the VCAA. The VCAA does not endorse or make any warranties regarding this study resource. Past VCE exams and related content can be accessed directly at www.vcaa.vic.edu.au
