VCE General Maths Data Analysis 2023 Mini Test 2
VCAA General Maths Exam 2
This is the full VCE General Maths Exam with worked solutions. You can also try Mini-Tests, which are official VCAA exams split into short tests you can do anytime.
Number of marks: 10
Reading time: 2.5 minutes
Writing time: 15 minutes
Instructions
• Answer all questions in the spaces provided.
• Write your responses in English.
• In all questions where a numerical answer is required, you should only round your answer when instructed to do so.
• Unless otherwise indicated, the diagrams in this book are not drawn to scale.
Data analysis - 2023 - Exam 2 (Part 2)
The scatterplot below plots the average monthly ice cream consumption, in litres/person, against average monthly temperature, in °C. The data for the graph was recorded in the Northern Hemisphere.
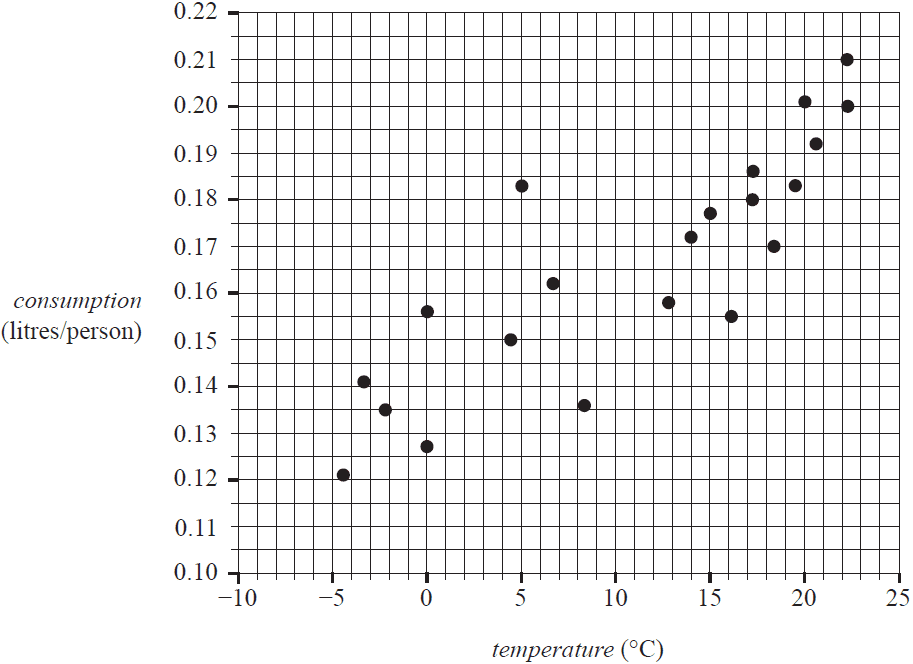
When a least squares line is fitted to the scatterplot, the equation is found to be:
\(\textit{consumption} = 0.1404 + 0.0024 \times \textit{temperature}\)
The coefficient of determination is 0.7212
a. Draw the least squares line on the scatterplot graph above. 1 mark
b. Determine the value of the correlation coefficient \(r\).
Round your answer to three decimal places. 1 mark
c. Describe the association between average monthly ice cream consumption and average monthly temperature in terms of strength, direction and form. 1 mark
| strength | |
| direction | |
| form |
d. Referring to the equation of the least squares line, interpret the value of the intercept in terms of the variables consumption and temperature. 1 mark
e. Use the equation of the least squares line to predict the average monthly ice cream consumption, in litres per person, when the monthly average temperature is –6 °C. 1 mark
f. Write down whether this prediction is an interpolation or an extrapolation. 1 mark
The time series plot below shows the average monthly ice cream consumption recorded over three years, from January 2010 to December 2012.
The data for the graph was recorded in the Northern Hemisphere.
In this graph, month number 1 is January 2010, month number 2 is February 2010 and so on.
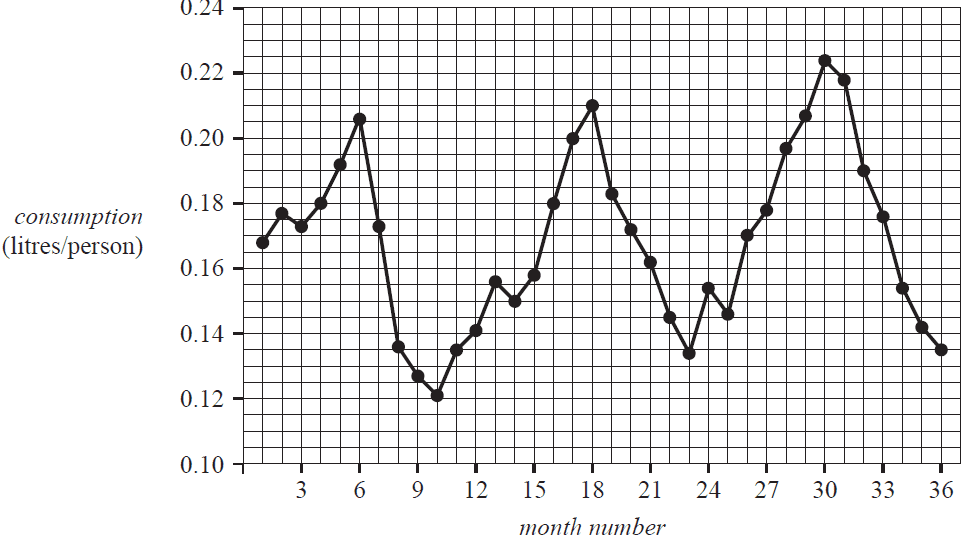
a. Identify a feature of this plot that is consistent with this time series having a seasonal component. 1 mark
b. The long-term seasonal index for April is 1.05.
Determine the deseasonalised value for average monthly ice cream consumption in April 2010 (month 4).
Round your answer to two decimal places. 1 mark
c. Table 4 below shows the average monthly ice cream consumption for 2011.
Table 4
| Consumption (litres/person) | ||||||||||||
|---|---|---|---|---|---|---|---|---|---|---|---|---|
| Year | Jan | Feb | Mar | Apr | May | Jun | Jul | Aug | Sep | Oct | Nov | Dec |
| 2011 | 0.156 | 0.150 | 0.158 | 0.180 | 0.200 | 0.210 | 0.183 | 0.172 | 0.162 | 0.145 | 0.134 | 0.154 |
Show that, when rounded to two decimal places, the seasonal index for July 2011 estimated from this data is 1.10. 2 marks
End of Multiple-Choice Question Book
VCE is a registered trademark of the VCAA. The VCAA does not endorse or make any warranties regarding this study resource. Past VCE exams and related content can be accessed directly at www.vcaa.vic.edu.au
