VCE General Maths Data Analysis 2022 Mini Test 1
This is the full VCE General Maths Exam with worked solutions. You can also try Mini-Tests, which are official VCAA exams split into short tests you can do anytime.
Number of marks: 8
Reading time: 3 minutes
Writing time: 18 minutes
Instructions
• Answer all questions in pencil on your Multiple-Choice Answer Sheet.
• Choose the response that is correct for the question.
• A correct answer scores 1; an incorrect answer scores 0.
• Marks will not be deducted for incorrect answers.
• No marks will be given if more than one answer is completed for any question.
• Unless otherwise indicated, the diagrams in this book are not drawn to scale.
Data analysis - 2022 (Part 1)
Use the following information to answer Questions 1–3.
The histogram below displays the distribution of skull width, in millimetres, for 46 female possums.
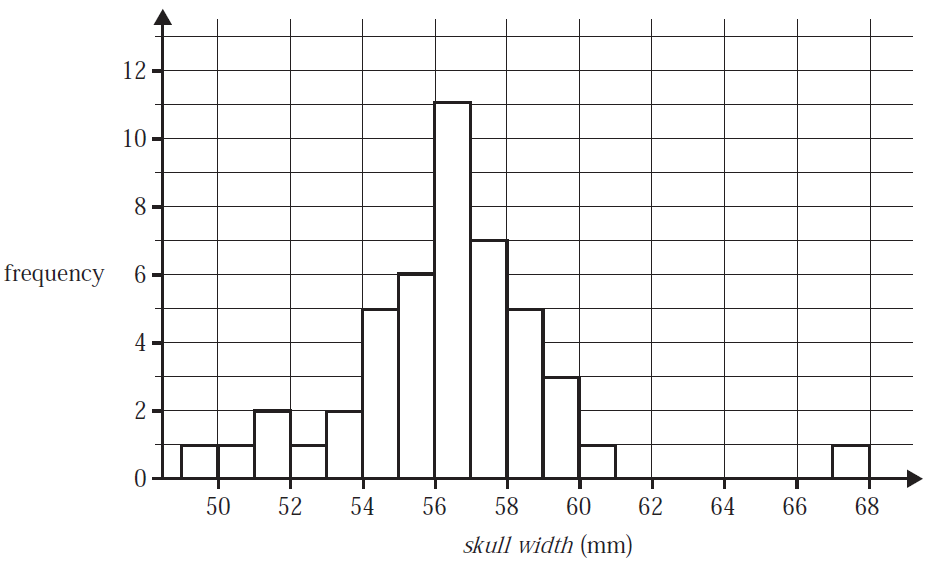
The shape of the distribution is best described as
- A. negatively skewed.
- B. approximately symmetric.
- C. negatively skewed with a possible outlier.
- D. positively skewed with a possible outlier.
- E. approximately symmetric with a possible outlier.
The percentage of the 46 possums with a skull width of less than 55 mm is closest to
- A. 12%
- B. 26%
- C. 39%
- D. 61%
- E. 74%
The third quartile (\(Q_3\)) for this distribution, in millimetres, could be
- A. 55.8
- B. 56.2
- C. 56.9
- D. 57.7
- E. 58.3
The age, in years, of a sample of 14 possums is displayed in the dot plot below.
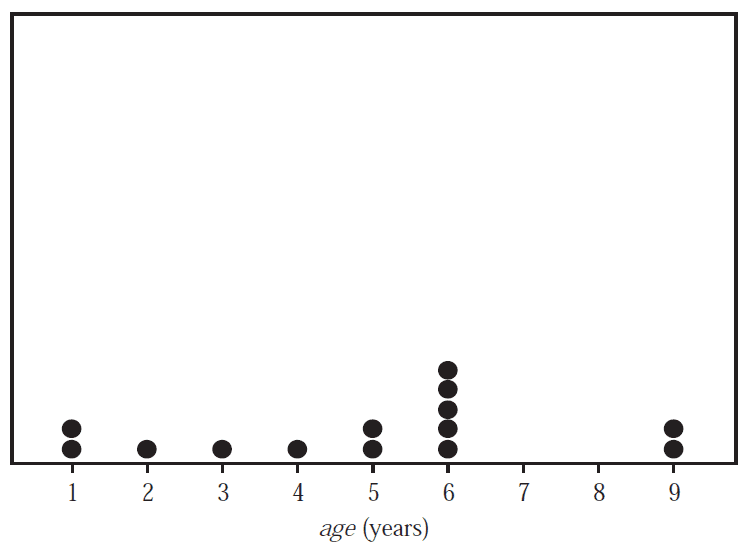
The mean and the standard deviation of age for this sample of possums are closest to
- A. \(\textit{mean} = 4.25 \quad \textit{standard deviation} = 2.6\)
- B. \(\textit{mean} = 4.8 \quad \textit{standard deviation} = 2.4\)
- C. \(\textit{mean} = 4.8 \quad \textit{standard deviation} = 2.5\)
- D. \(\textit{mean} = 4.9 \quad \textit{standard deviation} = 2.4\)
- E. \(\textit{mean} = 4.9 \quad \textit{standard deviation} = 2.5\)
The possum population of a large city park is 2498.
The body lengths of this species of possum are known to be approximately normally distributed with a mean
of 88 cm and a standard deviation of 4 cm.
Using the 68–95–99.7% rule, the number of possums in this park with a body length between 84 cm and
96 cm is closest to
- A. 2036
- B. 2043
- C. 2047
- D. 2105
- E. 2156
The histogram below displays the distribution of spleen weight for a sample of 32 seals.
The histogram has a \(\log_{10}\) scale.
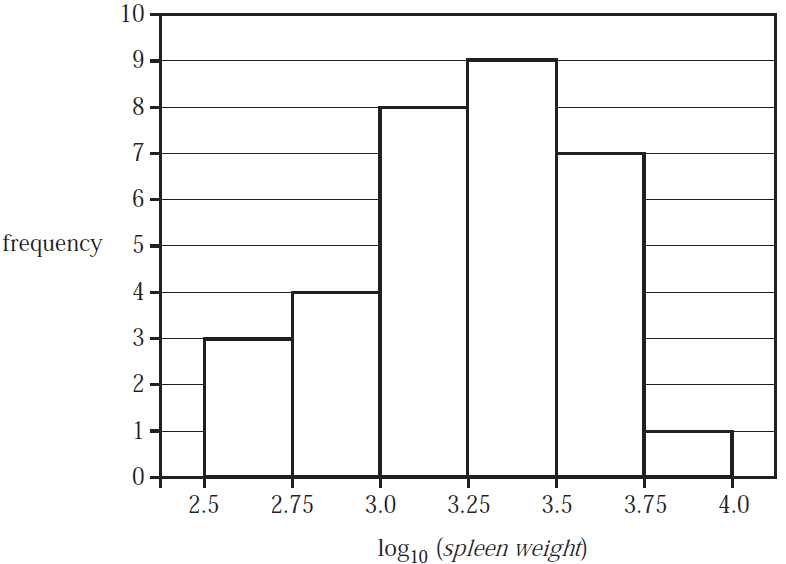
The number of seals in this sample with a spleen weight of 1000 g or more is
- A. 7
- B. 8
- C. 17
- D. 25
- E. 27
Use the following information to answer Questions 7 and 8.
The association between the weight of a seal’s spleen, spleen weight, in grams, and its age, in months, for a
sample of seals is non-linear.
This association can be linearised by applying a \(\log_{10}\) transformation to the variable spleen weight.
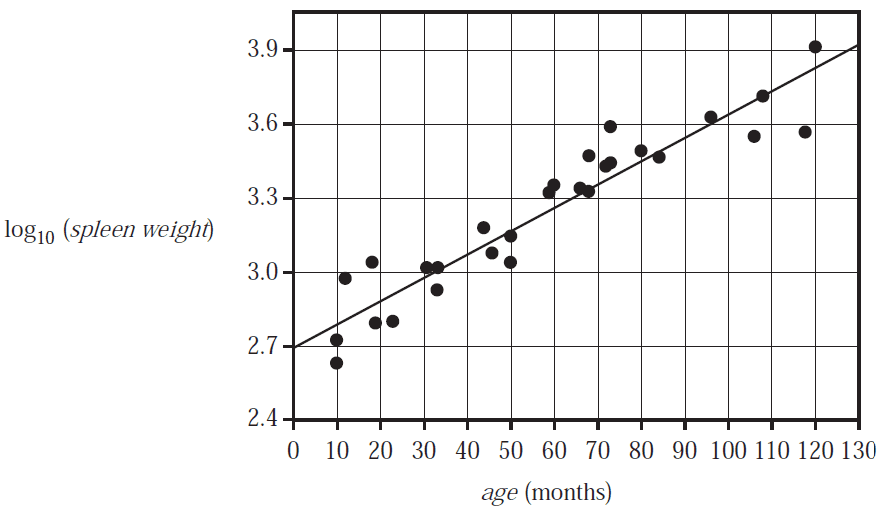
The equation of the least squares line for this scatterplot is
\(\log_{10}(\textit{spleen weight}) = 2.698 + 0.009434 \times \textit{age}\)
Question 7The equation of the least squares line predicts that, on average, for each one-month increase in the age of the seals, the increase in the value of \(\log_{10}(\textit{spleen weight})\) is
- A. 0.009434
- B. 0.01000
- C. 1.020
- D. 2.698
- E. 5.213
Using the equation of the least squares line, the predicted spleen weight of a 30-month-old seal, in grams, is closest to
- A. 3
- B. 511
- C. 772
- D. 957
- E. 1192
End of Multiple-Choice Question Book
VCE is a registered trademark of the VCAA. The VCAA does not endorse or make any warranties regarding this study resource. Past VCE exams and related content can be accessed directly at www.vcaa.vic.edu.au
