VCE General Maths Data Analysis 2022 Mini Test 3
VCAA General Maths Exam 2
This is the full VCE General Maths Exam with worked solutions. You can also try Mini-Tests, which are official VCAA exams split into short tests you can do anytime.
Number of marks: 9
Reading time: 2 minutes
Writing time: 13 minutes
Instructions
• Answer all questions in the spaces provided.
• Write your responses in English.
• In all questions where a numerical answer is required, you should only round your answer when instructed to do so.
• Unless otherwise indicated, the diagrams in this book are not drawn to scale.
Data analysis - 2022 - Exam 2 (Part 3)
The scatterplot below shows the relative humidity (%) at 9 am plotted against the temperature (°C) at 9 am for the 30 days of November 2021.
A least squares line has been fitted to the scatterplot.
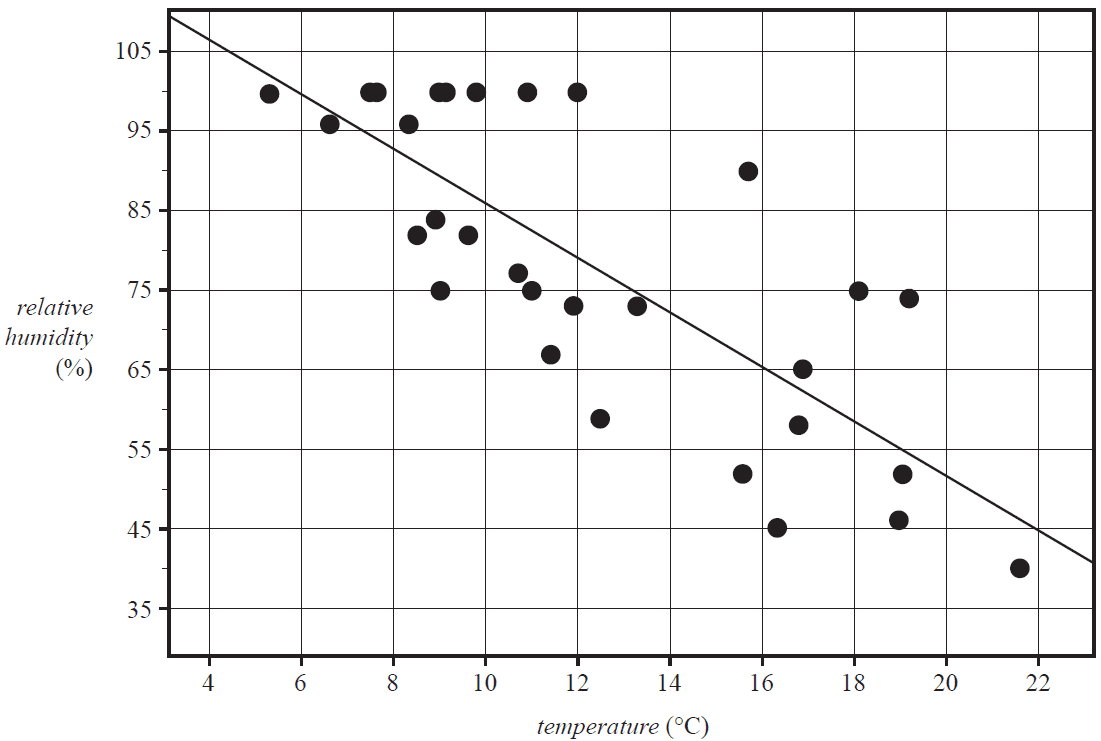
The equation of the least squares line is
relative humidity = 120.1 – 3.417 × temperature
The coefficient of determination is 0.6073
a. The equation of the least squares line can be used to predict relative humidity at 9 am from the temperature at 9 am.
Name the explanatory variable. 1 mark
b. Describe the association between relative humidity and temperature in terms of strength and direction. 1 mark
c. Interpret the slope of the least squares line in terms of the variables relative humidity and temperature. 1 mark
d. On the day when the temperature at 9 am was 16.3 °C, the relative humidity was 45.0%.
The following least squares line can be used to predict the relative humidity at 9 am on this day.
relative humidity = 120.1 – 3.417 × temperature
Calculate the residual value.
Round your answer to one decimal place. 2 marks
The time series plot below shows the monthly rainfall, in millimetres, recorded at a weather station over a 36-month period.
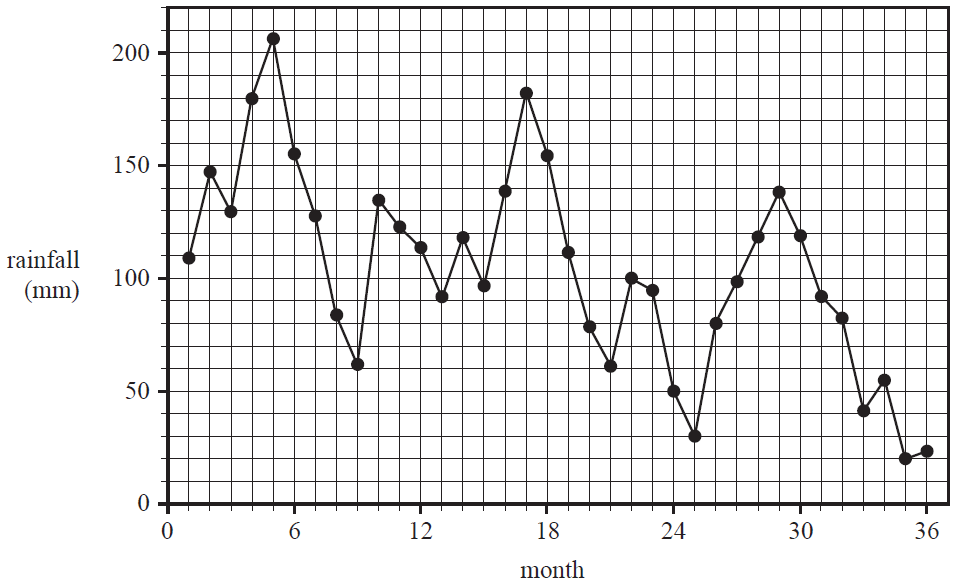
a. The time series plot contains irregular fluctuations.
Give two other descriptions of the pattern in this time series plot. 1 mark
b. Write down the value of the five-median smoothed rainfall for month 20. 1 mark
c. The data for months 1 to 12 of the time series plot is shown in the table below.
| Month number | 1 | 2 | 3 | 4 | 5 | 6 | 7 | 8 | 9 | 10 | 11 | 12 |
| Rainfall (mm) | 109.0 | 147.2 | 129.6 | 179.6 | 206.2 | 155.2 | 127.6 | 83.8 | 61.8 | 134.6 | 122.8 | 113.6 |
i. Calculate the nine-mean smoothed rainfall for month 7.
Round your answer to one decimal place. 1 mark
ii. What would be the number of points in the smoothed plot if nine-mean smoothing is applied for the full 36-month period? 1 mark
End of Multiple-Choice Question Book
VCE is a registered trademark of the VCAA. The VCAA does not endorse or make any warranties regarding this study resource. Past VCE exams and related content can be accessed directly at www.vcaa.vic.edu.au
