VCE General Maths Data Analysis 2022 Mini Test 1
VCAA General Maths Exam 2
This is the full VCE General Maths Exam with worked solutions. You can also try Mini-Tests, which are official VCAA exams split into short tests you can do anytime.
Number of marks: 9
Reading time: 2 minutes
Writing time: 13 minutes
Instructions
• Answer all questions in the spaces provided.
• Write your responses in English.
• In all questions where a numerical answer is required, you should only round your answer when instructed to do so.
• Unless otherwise indicated, the diagrams in this book are not drawn to scale.
Data analysis - 2022 & 2024 - Exam 2 (Part 1)
The boxplot below displays the distribution of all gold medal-winning heights for the women’s high jump, \(Wgold\), in metres, for the 19 Olympic Games held from 1948 to 2020.
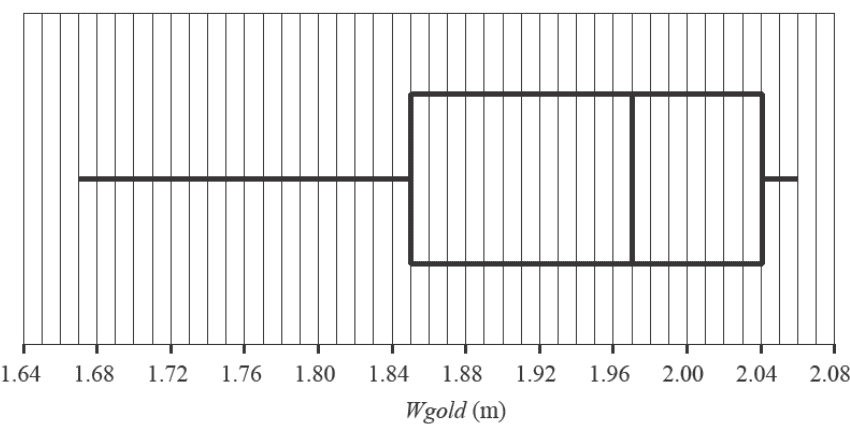
a. Describe the shape of this data distribution. 1 mark
b. For this boxplot, what is the smallest possible number of \(Wgold\) heights lower than 1.85 m? 1 mark
c.
i. Using the boxplot, show that the lower fence is 1.565 m and the upper fence is 2.325 m. 1 mark
ii. Referring to the boxplot, the lower fence and the upper fence, explain why no outliers exist. 1 mark
The back-to-back stem plot below displays the distribution of daily maximum wind speed, in kilometres per hour, recorded at a weather station in April and November 2021.
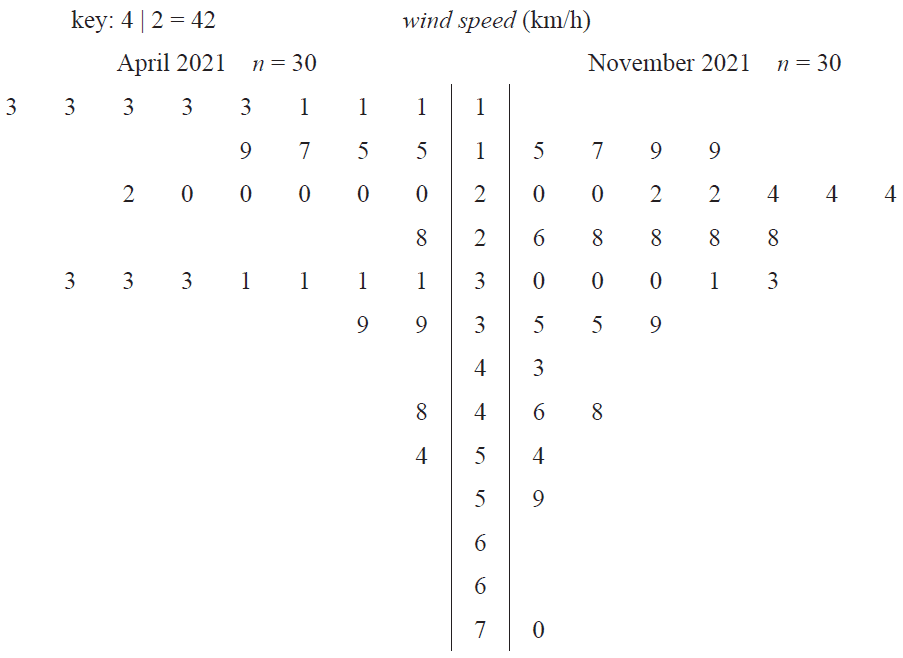
a. For April 2021, determine
i. the median wind speed, in kilometres per hour 1 mark
ii. the percentage of days for which the wind speed was less than 25 km/h. 1 mark
b. The five-number summary for wind speed in November 2021 is given below.
| Minimum | First quartile (\(Q_1\)) |
Median | Third quartile (\(Q_3\)) |
Maximum |
| 15 | 22 | 28 | 35 | 70 |
The wind speeds for November are to be used to construct a boxplot.
Show that the wind speeds of 59 km/h and 70 km/h would appear as outliers in this boxplot. 2 marks
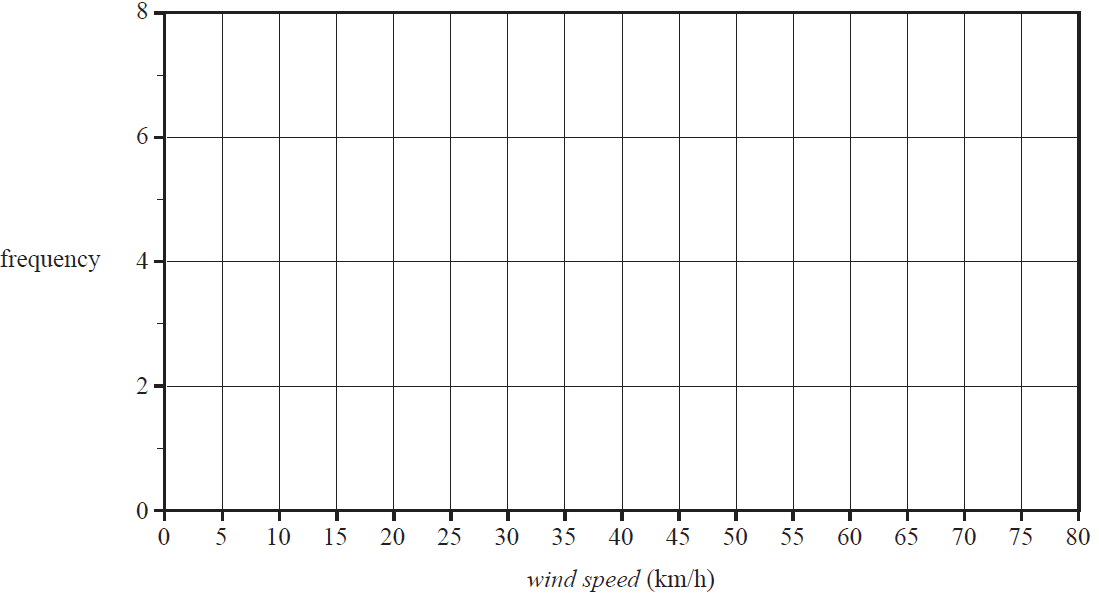
c. On the grid below, use the data from the stem plot on page 2 to construct a histogram that displays the distribution of wind speed for November 2021. Use class intervals of widths of five, starting at 15 km/h. 2 marks
End of Multiple-Choice Question Book
VCE is a registered trademark of the VCAA. The VCAA does not endorse or make any warranties regarding this study resource. Past VCE exams and related content can be accessed directly at www.vcaa.vic.edu.au
