VCE General Maths Data Analysis 2019 Mini Test 1
VCAA General Maths Exam 2
This is the full VCE General Maths Exam with worked solutions. You can also try Mini-Tests, which are official VCAA exams split into short tests you can do anytime.
Number of marks: 9
Reading time: 2 minutes
Writing time: 13 minutes
Instructions
• Answer all questions in the spaces provided.
• Write your responses in English.
• In all questions where a numerical answer is required, you should only round your answer when instructed to do so.
• Unless otherwise indicated, the diagrams in this book are not drawn to scale.
Data analysis - 2019 - Exam 2 (Part 1)
The parallel boxplots below show the maximum daily temperature and minimum daily temperature, in degrees Celsius, for 30 days in November 2017.
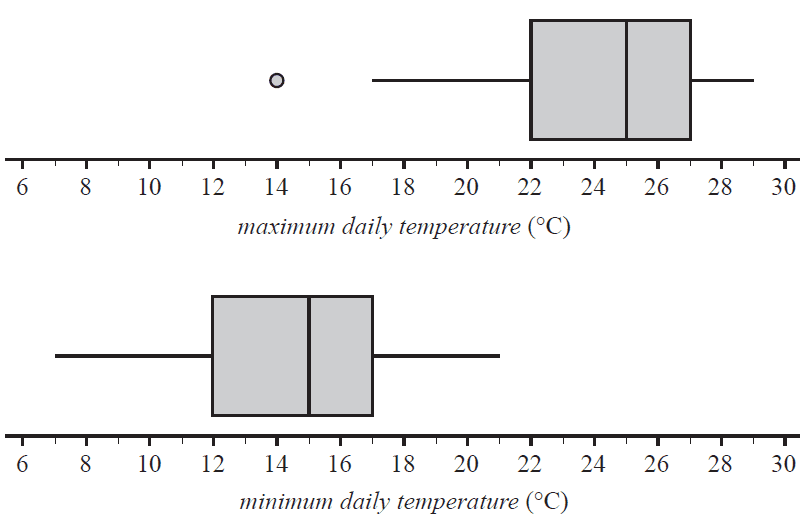
a. Use the information in the boxplots to complete the following sentences.
For November 2017
i. the interquartile range for the minimum daily temperature was °C 1 mark
ii. the median value for maximum daily temperature was °C higher than the median value for minimum daily temperature 1 mark
iii. the number of days on which the maximum daily temperature was less than the median value for minimum daily temperature was 1 mark
b. The temperature difference between the minimum daily temperature and the maximum daily temperature in November 2017 at this location is approximately normally distributed with a mean of 9.4 °C and a standard deviation of 3.2 °C.
Determine the number of days in November 2017 for which this temperature difference is expected to be greater than 9.4 °C. 1 mark
The five-number summary for the distribution of minimum daily temperature for the months of February, May and July in 2017 is shown in Table 2.
The associated boxplots are shown below the table.
| Month | Minimum | \(Q_1\) | Median | \(Q_3\) | Maximum |
|---|---|---|---|---|---|
| February | 5.9 | 9.5 | 10.9 | 13.9 | 22.2 |
| May | 3.3 | 6.0 | 7.5 | 9.8 | 12.7 |
| July | 1.6 | 3.7 | 5.0 | 5.9 | 7.7 |
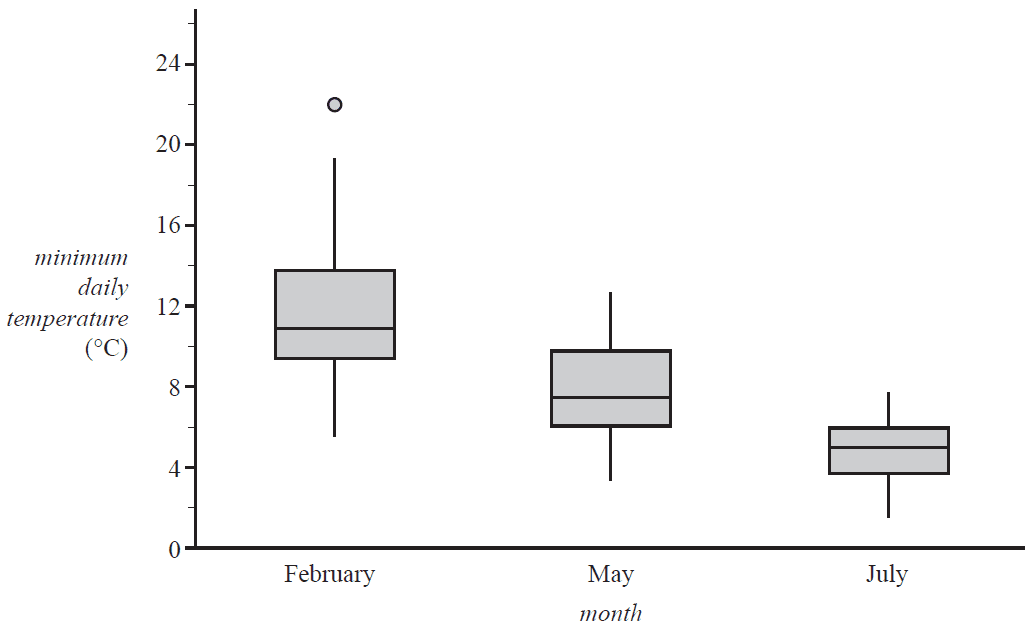
Explain why the information given above supports the contention that minimum daily temperature is associated with the month. Refer to the values of an appropriate statistic in your response. 2 marks
The relative humidity (%) at 9 am and 3 pm on 14 days in November 2017 is shown in Table 3 below.
| Relative humidity (%) | |
|---|---|
| 9 am | 3 pm |
| 100 | 87 |
| 99 | 75 |
| 95 | 67 |
| 63 | 57 |
| 81 | 57 |
| 94 | 74 |
| 96 | 71 |
| 81 | 62 |
| 73 | 53 |
| 53 | 54 |
| 57 | 36 |
| 77 | 39 |
| 51 | 30 |
| 41 | 32 |
A least squares line is to be fitted to the data with the aim of predicting the relative humidity at 3 pm (humidity 3 pm) from the relative humidity at 9 am (humidity 9 am).
a. Name the explanatory variable. 1 mark
b. Determine the values of the intercept and the slope of this least squares line.
Round both values to three significant figures and write them in the appropriate boxes provided. 1 mark
humidity 3 pm = + × humidity 9 am
c. Determine the value of the correlation coefficient for this data set.
Round your answer to three decimal places. 1 mark
End of Multiple-Choice Question Book
VCE is a registered trademark of the VCAA. The VCAA does not endorse or make any warranties regarding this study resource. Past VCE exams and related content can be accessed directly at www.vcaa.vic.edu.au
