VCE General Maths Data Analysis 2018 Mini Test 2
This is the full VCE General Maths Exam with worked solutions. You can also try Mini-Tests, which are official VCAA exams split into short tests you can do anytime.
Number of marks: 10
Reading time: 4 minutes
Writing time: 22 minutes
Instructions
• Answer all questions in pencil on your Multiple-Choice Answer Sheet.
• Choose the response that is correct for the question.
• A correct answer scores 1; an incorrect answer scores 0.
• Marks will not be deducted for incorrect answers.
• No marks will be given if more than one answer is completed for any question.
• Unless otherwise indicated, the diagrams in this book are not drawn to scale.
Data analysis - 2018 (Part 2)
The coefficient of determination is 0.8339
The correlation coefficient \(r\) is closest to
- A. –0.913
- B. –0.834
- C. –0.695
- D. 0.834
- E. 0.913
In a study of the association between a person’s height, in centimetres, and body surface area, in square metres, the following least squares line was obtained.
body surface area = –1.1 + 0.019 × height
Which one of the following is a conclusion that can be made from this least squares line?
- A. An increase of 1 m² in body surface area is associated with an increase of 0.019 cm in height.
- B. An increase of 1 cm in height is associated with an increase of 0.019 m² in body surface area.
- C. The correlation coefficient is 0.019
- D. A person’s body surface area, in square metres, can be determined by adding 1.1 cm to their height.
- E. A person’s height, in centimetres, can be determined by subtracting 1.1 from their body surface area, in square metres.
Freya uses the following data to generate the scatterplot below.
| x | 1 | 2 | 3 | 4 | 5 | 6 | 7 | 8 | 9 | 10 |
| y | 105 | 48 | 35 | 23 | 18 | 16 | 12 | 12 | 9 | 9 |
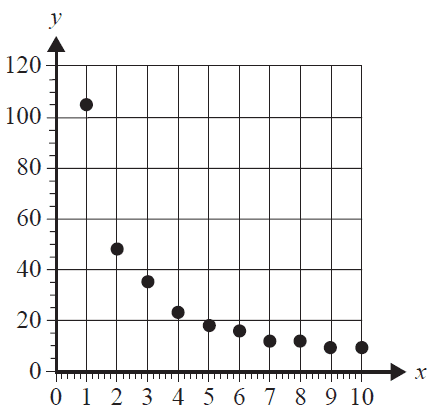
The scatterplot shows that the data is non-linear.
To linearise the data, Freya applies a reciprocal transformation to the variable \(y\).
She then fits a least squares line to the transformed data.
With \(x\) as the explanatory variable, the equation of this least squares line is closest to
- A. \(\frac{1}{y} = -0.0039 + 0.012x\)
- B. \(\frac{1}{y} = -0.025 + 1.1x\)
- C. \(\frac{1}{y} = 7.8 - 0.082x\)
- D. \(y = 45.3 + 59.7 \times \frac{1}{x}\)
- E. \(y = 59.7 + 45.3 \times \frac{1}{x}\)
A \(\log_{10}(y)\) transformation was used to linearise a set of non-linear bivariate data.
A least squares line was then fitted to the transformed data.
The equation of this least squares line is
\(\log_{10}(y) = 3.1 - 2.3x\)
This equation is used to predict the value of \(y\) when \(x = 1.1\)
The value of \(y\) is closest to
- A. –0.24
- B. 0.57
- C. 0.91
- D. 1.6
- E. 3.7
The statistical analysis of a set of bivariate data involving variables \(x\) and \(y\) resulted in the information displayed in the table below.
| Mean | \(\bar{x} = 27.8\) | \(\bar{y} = 33.4\) |
| Standard deviation | \(s_x = 2.33\) | \(s_y = 3.24\) |
| Equation of the least squares line | \(y = -2.84 + 1.31x\) | |
Using this information, the value of the correlation coefficient \(r\) for this set of bivariate data is closest to
- A. 0.88
- B. 0.89
- C. 0.92
- D. 0.94
- E. 0.97
A least squares line is fitted to a set of bivariate data.
Another least squares line is fitted with response and explanatory variables reversed.
Which one of the following statistics will not change in value?
- A. the residual values
- B. the predicted values
- C. the correlation coefficient \(r\)
- D. the slope of the least squares line
- E. the intercept of the least squares line
The table below shows the monthly profit, in dollars, of a new coffee shop for the first nine months of 2018.
| Month | Jan. | Feb. | Mar. | Apr. | May | June | July | Aug. | Sept. |
| Profit ($) | 2890 | 1978 | 2402 | 2456 | 4651 | 3456 | 2823 | 2678 | 2345 |
Using four-mean smoothing with centring, the smoothed profit for May is closest to
- A. $2502
- B. $3294
- C. $3503
- D. $3804
- E. $4651
The quarterly sales figures for a large suburban garden centre, in millions of dollars, for 2016 and 2017 are displayed in the table below.
| Year | Quarter 1 | Quarter 2 | Quarter 3 | Quarter 4 |
|---|---|---|---|---|
| 2016 | 1.73 | 2.87 | 3.34 | 1.23 |
| 2017 | 1.03 | 2.45 | 2.05 | 0.78 |
Using these sales figures, the seasonal index for Quarter 3 is closest to
- A. 1.28
- B. 1.30
- C. 1.38
- D. 1.46
- E. 1.48
End of Multiple-Choice Question Book
VCE is a registered trademark of the VCAA. The VCAA does not endorse or make any warranties regarding this study resource. Past VCE exams and related content can be accessed directly at www.vcaa.vic.edu.au
