VCE General Maths Data Analysis 2018 Mini Test 1
This is the full VCE General Maths Exam with worked solutions. You can also try Mini-Tests, which are official VCAA exams split into short tests you can do anytime.
Number of marks: 9
Reading time: 3 minutes
Writing time: 20 minutes
Instructions
• Answer all questions in pencil on your Multiple-Choice Answer Sheet.
• Choose the response that is correct for the question.
• A correct answer scores 1; an incorrect answer scores 0.
• Marks will not be deducted for incorrect answers.
• No marks will be given if more than one answer is completed for any question.
• Unless otherwise indicated, the diagrams in this book are not drawn to scale.
Data analysis - 2018 (Part 1)
Use the following information to answer Questions 1 and 2.
The dot plot below displays the difference in travel time between the morning peak and the evening peak travel times for the same journey on 25 days.
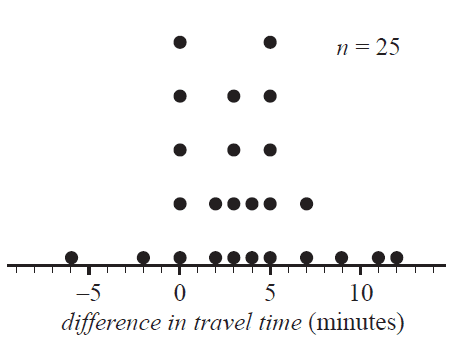
The percentage of days when there was five minutes difference in travel time between the morning peak and the evening peak travel times is
- A. \(0\%\)
- B. \(5\%\)
- C. \(20\%\)
- D. \(25\%\)
- E. \(28\%\)
The median difference in travel time is
- A. 3.0 minutes.
- B. 3.5 minutes.
- C. 4.0 minutes.
- D. 4.5 minutes.
- E. 5.0 minutes.
Use the following information to answer Questions 3–5.
The pulse rates of a population of Year 12 students are approximately normally distributed with a mean of 69 beats per minute and a standard deviation of 4 beats per minute.
Question 3A student selected at random from this population has a standardised pulse rate of \(z = -2.5\)
This student’s actual pulse rate is
- A. 59 beats per minute.
- B. 63 beats per minute.
- C. 65 beats per minute.
- D. 73 beats per minute.
- E. 79 beats per minute.
Another student selected at random from this population has a standardised pulse rate of \(z = -1\).
The percentage of students in this population with a pulse rate greater than this student is closest to
- A. 2.5%
- B. 5%
- C. 16%
- D. 68%
- E. 84%
A sample of 200 students was selected at random from this population.
The number of these students with a pulse rate of less than 61 beats per minute or greater than 73 beats per minute is closest to
- A. 19
- B. 37
- C. 64
- D. 95
- E. 190
Data was collected to investigate the association between the following two variables:
- age (29 and under, 30–59, 60 and over)
- uses public transport (yes, no)
Which one of the following is appropriate to use in the statistical analysis of this association?
- A. a scatterplot
- B. parallel box plots
- C. a least squares line
- D. a segmented bar chart
- E. the correlation coefficient \(r\)
Use the following information to answer Questions 7–9.
The scatterplot below displays the resting pulse rate, in beats per minute, and the time spent exercising, in hours per week, of 16 students. A least squares line has been fitted to the data.
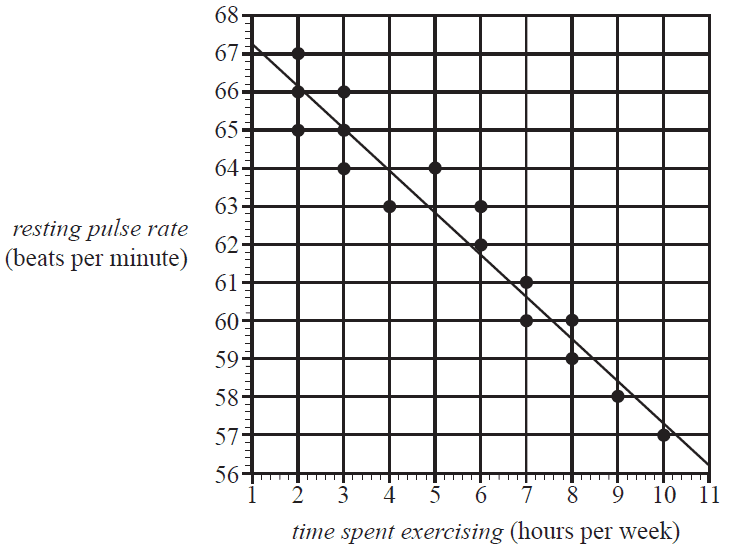
Using this least squares line to model the association between resting pulse rate and time spent exercising, the residual for the student who spent four hours per week exercising is closest to
- A. –2.0 beats per minute.
- B. –1.0 beats per minute.
- C. –0.3 beats per minute.
- D. 1.0 beats per minute.
- E. 2.0 beats per minute.
The equation of this least squares line is closest to
- A. resting pulse rate = 67.2 – 0.91 × time spent exercising
- B. resting pulse rate = 67.2 – 1.10 × time spent exercising
- C. resting pulse rate = 68.3 – 0.91 × time spent exercising
- D. resting pulse rate = 68.3 – 1.10 × time spent exercising
- E. resting pulse rate = 67.2 + 1.10 × time spent exercising
End of Multiple-Choice Question Book
VCE is a registered trademark of the VCAA. The VCAA does not endorse or make any warranties regarding this study resource. Past VCE exams and related content can be accessed directly at www.vcaa.vic.edu.au
