VCE General Maths Data Analysis 2018 Mini Test 1
VCAA General Maths Exam 2
This is the full VCE General Maths Exam with worked solutions. You can also try Mini-Tests, which are official VCAA exams split into short tests you can do anytime.
Number of marks: 8
Reading time: 2 minutes
Writing time: 12 minutes
Instructions
• Answer all questions in the spaces provided.
• Write your responses in English.
• In all questions where a numerical answer is required, you should only round your answer when instructed to do so.
• Unless otherwise indicated, the diagrams in this book are not drawn to scale.
Data analysis - 2018 - Exam 2 (Part 1)
Table 1
| City | Congestion level |
Size | Increase in travel time (minutes per day) |
|---|---|---|---|
| Belfast | high | small | 52 |
| Edinburgh | high | small | 43 |
| London | high | large | 40 |
| Manchester | high | large | 44 |
| Brighton and Hove | high | small | 35 |
| Bournemouth | high | small | 36 |
| Sheffield | medium | small | 36 |
| Hull | medium | small | 40 |
| Bristol | medium | small | 39 |
| Newcastle-Sunderland | medium | large | 34 |
| Leicester | medium | small | 36 |
| Liverpool | medium | large | 29 |
| Swansea | low | small | 30 |
| Glasgow | low | large | 34 |
| Cardiff | low | small | 31 |
| Nottingham | low | small | 31 |
| Birmingham-Wolverhampton | low | large | 29 |
| Leeds-Bradford | low | large | 31 |
| Portsmouth | low | small | 27 |
| Southampton | low | small | 30 |
| Reading | low | small | 31 |
| Coventry | low | small | 30 |
| Stoke-on-Trent | low | small | 29 |
The data in Table 1 on page 2 relates to the impact of traffic congestion in 2016 on travel times in 23 cities in the United Kingdom (UK).
The four variables in this data set are:
- city – name of city
- congestion level – traffic congestion level (high, medium, low)
- size – size of city (large, small)
- increase in travel time – increase in travel time due to traffic congestion (minutes per day).
a. How many variables in this data set are categorical variables? 1 mark
b. How many variables in this data set are ordinal variables? 1 mark
c. Name the large UK cities with a medium level of traffic congestion. 1 mark
d. Use the data in Table 1 to complete the following two-way frequency table, Table 2. 2 marks
Table 2
| Congestion level | City size | |
|---|---|---|
| Small | Large | |
| high | 4 | |
| medium | ||
| low | ||
| Total | 16 | |
e. What percentage of the small cities have a high level of traffic congestion? 1 mark
Traffic congestion can lead to an increase in travel times in cities. The dot plot and boxplot below both show the increase in travel time due to traffic congestion, in minutes per day, for the 23 UK cities.
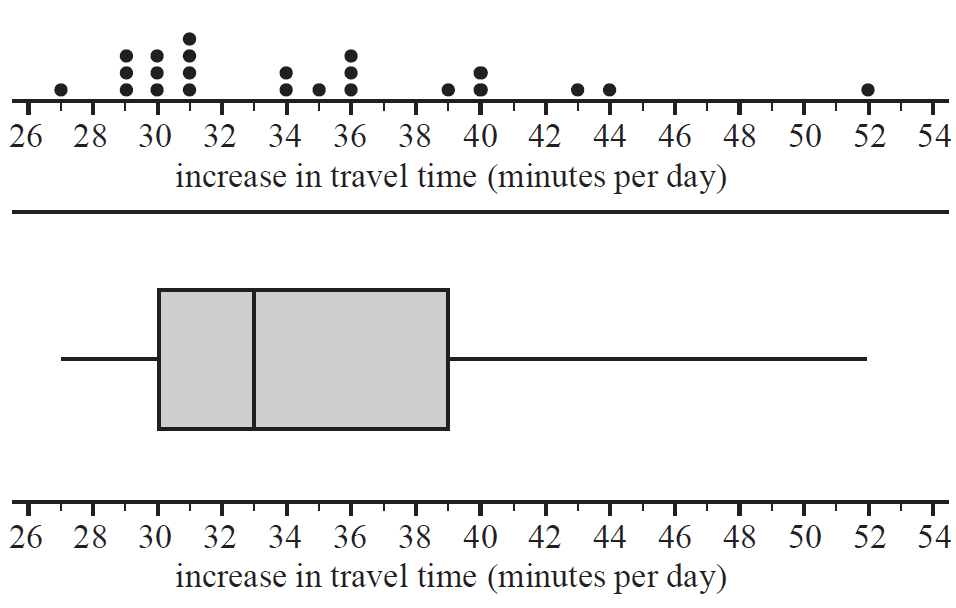
f. Describe the shape of the distribution of the increase in travel time for the 23 cities. 1 mark
g. The data value 52 is below the upper fence and is not an outlier.
Determine the value of the upper fence. 1 mark
End of Multiple-Choice Question Book
VCE is a registered trademark of the VCAA. The VCAA does not endorse or make any warranties regarding this study resource. Past VCE exams and related content can be accessed directly at www.vcaa.vic.edu.au
