VCE General Maths Data Analysis 2017 Mini Test 1
VCAA General Maths Exam 2
This is the full VCE General Maths Exam with worked solutions. You can also try Mini-Tests, which are official VCAA exams split into short tests you can do anytime.
Number of marks: 10
Reading time: 2.5 minutes
Writing time: 15 minutes
Instructions
• Answer all questions in the spaces provided.
• Write your responses in English.
• In all questions where a numerical answer is required, you should only round your answer when instructed to do so.
• Unless otherwise indicated, the diagrams in this book are not drawn to scale.
Data analysis - 2017 - Exam 2 (Part 1)
The number of eggs counted in a sample of 12 clusters of moth eggs is recorded in the table below.
| Number of eggs | 172 | 192 | 159 | 125 | 197 | 135 | 140 | 140 | 138 | 166 | 136 | 131 |
a. From the information given, determine
i. the range 1 mark
ii. the percentage of clusters in this sample that contain more than 170 eggs. 1 mark
In a large population of moths, the number of eggs per cluster is approximately normally distributed with a mean of 165 eggs and a standard deviation of 25 eggs.
b. Using the 68–95–99.7% rule, determine
i. the percentage of clusters expected to contain more than 140 eggs 1 mark
ii. the number of clusters expected to have less than 215 eggs in a sample of 1000 clusters. 1 mark
c. The standardised number of eggs in one cluster is given by \(z = -2.4\)
Determine the actual number of eggs in this cluster. 1 mark
The eggs laid by the female moths hatch and become caterpillars.
The following time series plot shows the total area, in hectares, of forest eaten by the caterpillars in a rural area during the period 1900 to 1980. The data used to generate this plot is also given.
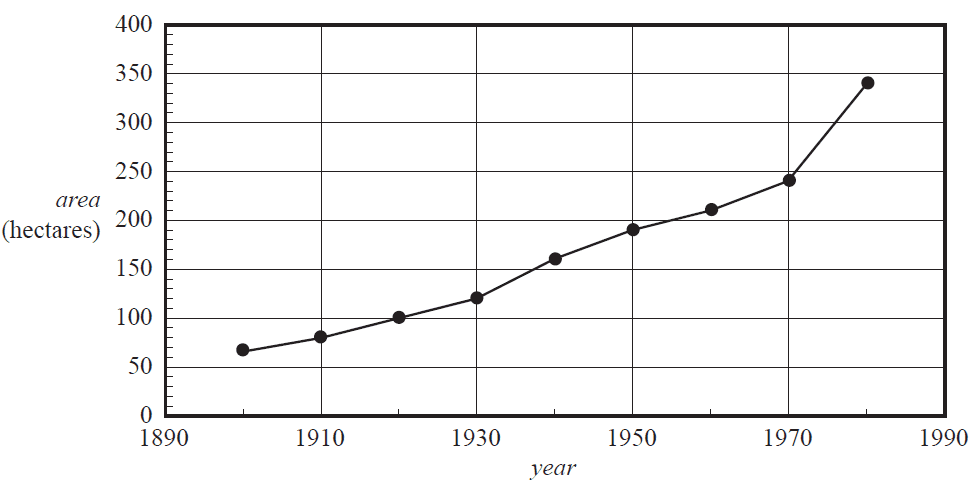
| Year | 1900 | 1910 | 1920 | 1930 | 1940 | 1950 | 1960 | 1970 | 1980 |
| Area (hectares) |
66 | 80 | 100 | 120 | 160 | 190 | 210 | 240 | 340 |
The association between area of forest eaten by the caterpillars and year is non-linear.
A log10 transformation can be applied to the variable area to linearise the data.
a. When the equation of the least squares line that can be used to predict log10(area) from year is determined, the slope of this line is approximately 0.0085385
Round this value to three significant figures. 1 mark
b. Perform the log10 transformation to the variable area and determine the equation of the least squares line that can be used to predict log10(area) from year.
Write the values of the intercept and slope of this least squares line in the appropriate boxes provided below.
Round your answers to three significant figures. 2 marks
log10(area) = + × year
c. i. The least squares line predicts that the log10(area) of forest eaten by the caterpillars by the year 2020 will be approximately 2.85
Using this value of 2.85, calculate the expected area of forest that will be eaten by the caterpillars by the year 2020.
Round your answer to the nearest hectare. 1 mark
ii. Give a reason why this prediction may have limited reliability. 1 mark
End of Multiple-Choice Question Book
VCE is a registered trademark of the VCAA. The VCAA does not endorse or make any warranties regarding this study resource. Past VCE exams and related content can be accessed directly at www.vcaa.vic.edu.au
