VCE General Maths Data Analysis 2016 Mini Test 2
This is the full VCE General Maths Exam with worked solutions. You can also try Mini-Tests, which are official VCAA exams split into short tests you can do anytime.
Number of marks: 10
Reading time: 4 minutes
Writing time: 22 minutes
Instructions
• Answer all questions in pencil on your Multiple-Choice Answer Sheet.
• Choose the response that is correct for the question.
• A correct answer scores 1; an incorrect answer scores 0.
• Marks will not be deducted for incorrect answers.
• No marks will be given if more than one answer is completed for any question.
• Unless otherwise indicated, the diagrams in this book are not drawn to scale.
Data analysis - 2016 (Part 2)
In 2011, life expectancy in Australia was 81.8 years and the Human Development Index was 92.9
When the least squares line is used to predict life expectancy in Australia, the residual is closest to
- A. –0.6
- B. –0.4
- C. 0.4
- D. 11.1
- E. 42.6
The table below gives the Human Development Index (HDI) and the mean number of children per woman (children) for 14 countries in 2007.
A scatterplot of the data is also shown.
| HDI | Children |
|---|---|
| 27.3 | 7.6 |
| 31.3 | 6.1 |
| 39.5 | 4.9 |
| 41.6 | 3.9 |
| 44.0 | 3.8 |
| 50.8 | 4.3 |
| 52.3 | 2.7 |
| 62.5 | 3.0 |
| 69.1 | 2.4 |
| 74.6 | 2.1 |
| 78.9 | 1.9 |
| 85.6 | 1.8 |
| 92.0 | 1.9 |
| 83.4 | 1.6 |
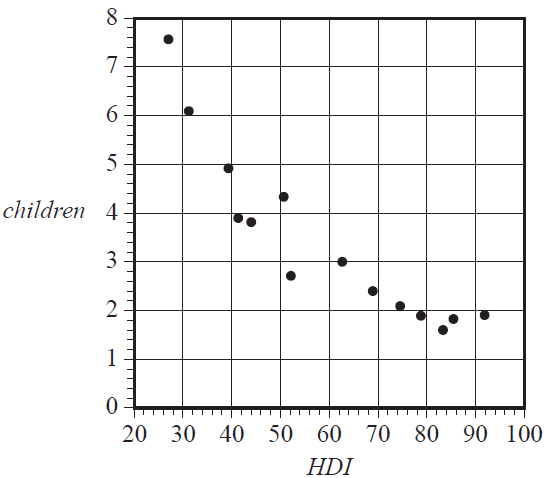
The scatterplot is non-linear.
A log transformation applied to the variable children can be used to linearise the scatterplot.
With HDI as the explanatory variable, the equation of the least squares line fitted to the linearised data is closest to
- A. log(children) = 1.1 – 0.0095 × HDI
- B. children = 1.1 – 0.0095 × log(HDI)
- C. log(children) = 8.0 – 0.77 × HDI
- D. children = 8.0 – 0.77 × log(HDI)
- E. log(children) = 21 – 10 × HDI
There is a strong positive association between a country’s Human Development Index and its carbon dioxide emissions.
From this information, it can be concluded that
- A. increasing a country’s carbon dioxide emissions will increase the Human Development Index of the country.
- B. decreasing a country’s carbon dioxide emissions will increase the Human Development Index of the country.
- C. this association must be a chance occurrence and can be safely ignored.
- D. countries that have higher human development indices tend to have higher levels of carbon dioxide emissions.
- E. countries that have higher human development indices tend to have lower levels of carbon dioxide emissions.
Consider the time series plot below.
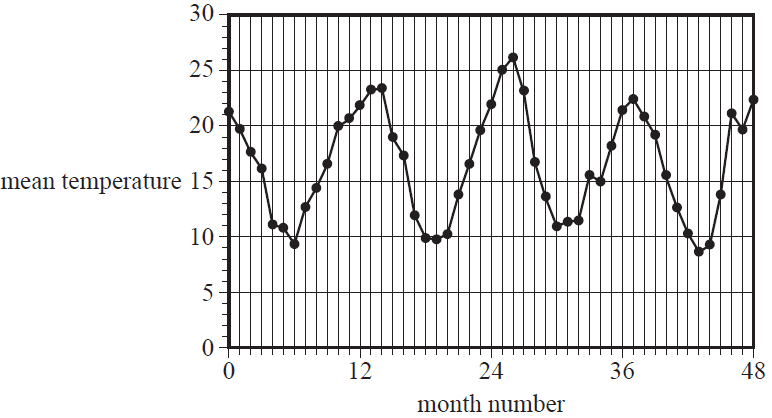
The pattern in the time series plot shown above is best described as having
- A. irregular fluctuations only.
- B. an increasing trend with irregular fluctuations.
- C. seasonality with irregular fluctuations.
- D. seasonality with an increasing trend and irregular fluctuations.
- E. seasonality with a decreasing trend and irregular fluctuations.
Use the following information to answer Questions 14–16.
The table below shows the long-term average of the number of meals served each day at a restaurant. Also shown is the daily seasonal index for Monday through to Friday.
| Day of the week | |||||||
|---|---|---|---|---|---|---|---|
| Monday | Tuesday | Wednesday | Thursday | Friday | Saturday | Sunday | |
| Long-term average | 89 | 93 | 110 | 132 | 145 | 190 | 160 |
| Seasonal index | 0.68 | 0.71 | 0.84 | 1.01 | 1.10 | ||
The seasonal index for Wednesday is 0.84
This tells us that, on average, the number of meals served on a Wednesday is
- A. 16% less than the daily average.
- B. 84% less than the daily average.
- C. the same as the daily average.
- D. 16% more than the daily average.
- E. 84% more than the daily average.
Last Tuesday, 108 meals were served in the restaurant.
The deseasonalised number of meals served last Tuesday was closest to
- A. 93
- B. 100
- C. 110
- D. 131
- E. 152
The seasonal index for Saturday is closest to
- A. 1.22
- B. 1.31
- C. 1.38
- D. 1.45
- E. 1.49
Recursion and financial modelling
Question 8Consider the recurrence relation below.
\(A_0 = 2, \quad A_{n+1} = 3A_n + 1\)
The first four terms of this recurrence relation are
- A. 0, 2, 7, 22 ...
- B. 1, 2, 7, 22 ...
- C. 2, 5, 16, 49 ...
- D. 2, 7, 18, 54 ...
- E. 2, 7, 22, 67 ...
End of Multiple-Choice Question Book
VCE is a registered trademark of the VCAA. The VCAA does not endorse or make any warranties regarding this study resource. Past VCE exams and related content can be accessed directly at www.vcaa.vic.edu.au
