VCE General Maths Data Analysis 2016 Mini Test 1
This is the full VCE General Maths Exam with worked solutions. You can also try Mini-Tests, which are official VCAA exams split into short tests you can do anytime.
Number of marks: 9
Reading time: 3 minutes
Writing time: 20 minutes
Instructions
• Answer all questions in pencil on your Multiple-Choice Answer Sheet.
• Choose the response that is correct for the question.
• A correct answer scores 1; an incorrect answer scores 0.
• Marks will not be deducted for incorrect answers.
• No marks will be given if more than one answer is completed for any question.
• Unless otherwise indicated, the diagrams in this book are not drawn to scale.
Data analysis - 2016 (Part 1)
The variables blood pressure (low, normal, high) and age (under 50 years, 50 years or over) are
- A. both nominal variables.
- B. both ordinal variables.
- C. a nominal variable and an ordinal variable respectively.
- D. an ordinal variable and a nominal variable respectively.
- E. a continuous variable and an ordinal variable respectively.
The stem plot below displays 30 temperatures recorded at a weather station.
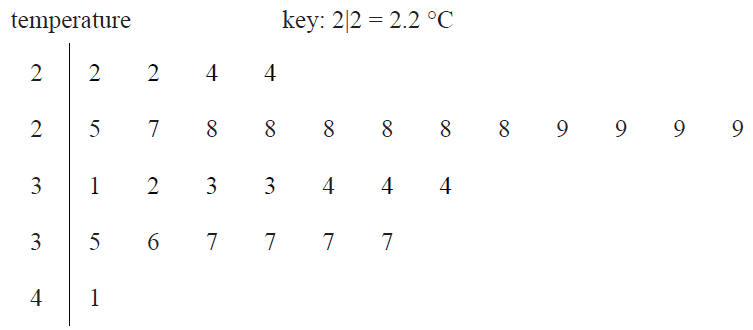
The modal temperature is
- A. 2.8 °C
- B. 2.9 °C
- C. 3.7 °C
- D. 8.0 °C
- E. 9.0 °C
Use the following information to answer Questions 4 and 5.
The weights of male players in a basketball competition are approximately normally distributed with a mean of 78.6 kg and a standard deviation of 9.3 kg.
Question 3There are 456 male players in the competition.
The expected number of male players in the competition with weights above 60 kg is closest to
- A. 3
- B. 11
- C. 23
- D. 433
- E. 445
Brett and Sanjeeva both play in the basketball competition.
When the weights of all players in the competition are considered, Brett has a standardised weight of \(z = -0.96\) and Sanjeeva has a standardised weight of \(z = -0.26\)
Which one of the following statements is not true?
- A. Brett and Sanjeeva are both below the mean weight for players in the basketball competition.
- B. Sanjeeva weighs more than Brett.
- C. If Sanjeeva increases his weight by 2 kg, he would be above the mean weight for players in the basketball competition.
- D. Brett weighs more than 68 kg.
- E. More than 50% of the players in the basketball competition weigh more than Sanjeeva.
The histogram below shows the distribution of the number of billionaires per million people for 53 countries.
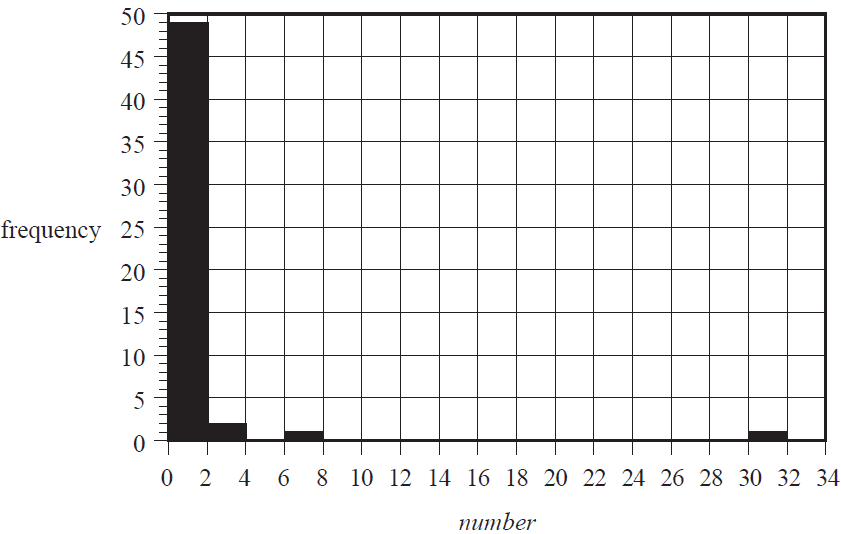
Using this histogram, the percentage of these 53 countries with less than two billionaires per million people is closest to
- A. 49%
- B. 53%
- C. 89%
- D. 92%
- E. 98%
The histogram below shows the distribution of the number of billionaires per million people for the same 53 countries as in Question 6, but this time plotted on a log10 scale.
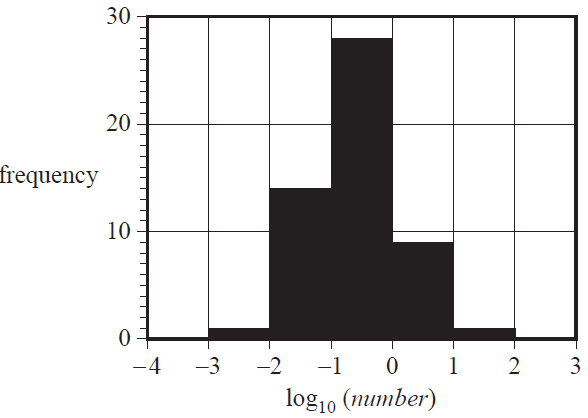
Based on this histogram, the number of countries with one or more billionaires per million people is
- A. 1
- B. 3
- C. 8
- D. 9
- E. 10
Parallel boxplots would be an appropriate graphical tool to investigate the association between the monthly median rainfall, in millimetres, and the
- A. monthly median wind speed, in kilometres per hour.
- B. monthly median temperature, in degrees Celsius.
- C. month of the year (January, February, March, etc.).
- D. monthly sunshine time, in hours.
- E. annual rainfall, in millimetres.
Use the following information to answer Questions 9 and 10.
The scatterplot below shows life expectancy in years (life expectancy) plotted against the Human Development Index (HDI) for a large number of countries in 2011.
A least squares line has been fitted to the data and the resulting residual plot is also shown.
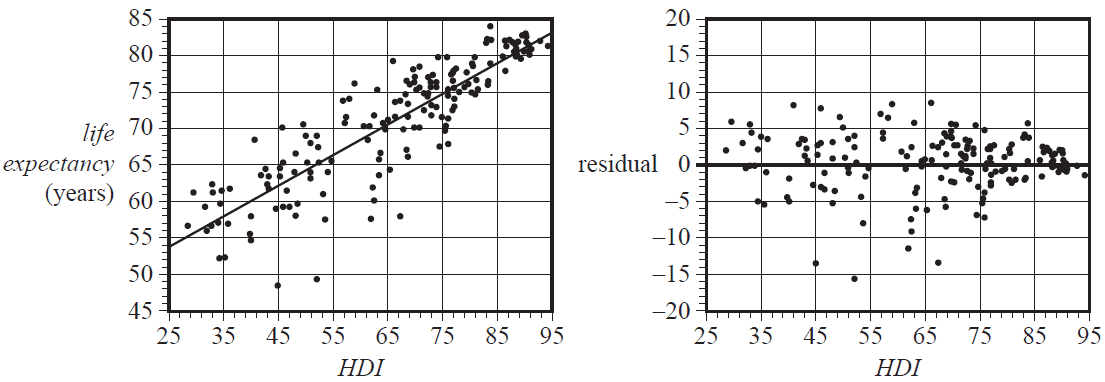
The equation of this least squares line is
life expectancy = 43.0 + 0.422 × HDI
The coefficient of determination is \(r^2 = 0.875\)
Given the information above, which one of the following statements is not true?
- A. The value of the correlation coefficient is close to 0.94
- B. 12.5% of the variation in life expectancy is not explained by the variation in the Human Development Index.
- C. On average, life expectancy increases by 43.0 years for each 10-point increase in the Human Development Index.
- D. Ignoring any outliers, the association between life expectancy and the Human Development Index can be described as strong, positive and linear.
- E. Using the least squares line to predict the life expectancy in a country with a Human Development Index of 75 is an example of interpolation.
End of Multiple-Choice Question Book
VCE is a registered trademark of the VCAA. The VCAA does not endorse or make any warranties regarding this study resource. Past VCE exams and related content can be accessed directly at www.vcaa.vic.edu.au
