VCE General Maths Data Analysis 2016 Mini Test 2
VCAA General Maths Exam 2
This is the full VCE General Maths Exam with worked solutions. You can also try Mini-Tests, which are official VCAA exams split into short tests you can do anytime.
Number of marks: 8
Reading time: 2 minutes
Writing time: 12 minutes
Instructions
• Answer all questions in the spaces provided.
• Write your responses in English.
• In all questions where a numerical answer is required, you should only round your answer when instructed to do so.
• Unless otherwise indicated, the diagrams in this book are not drawn to scale.
Data analysis - 2016 - Exam 2 (Part 2)
The data in the table below shows a sample of actual temperatures and apparent temperatures recorded at the weather station. A scatterplot of the data is also shown.
The data will be used to investigate the association between the variables apparent temperature and actual temperature.
| Apparent temperature (°C) | Actual temperature (°C) |
|---|---|
| 24.7 | 28.5 |
| 24.3 | 27.6 |
| 24.9 | 27.7 |
| 23.2 | 26.9 |
| 24.2 | 26.6 |
| 22.6 | 25.5 |
| 21.5 | 24.4 |
| 20.6 | 23.8 |
| 19.4 | 22.3 |
| 18.4 | 22.1 |
| 17.6 | 20.9 |
| 18.7 | 21.2 |
| 18.2 | 20.5 |
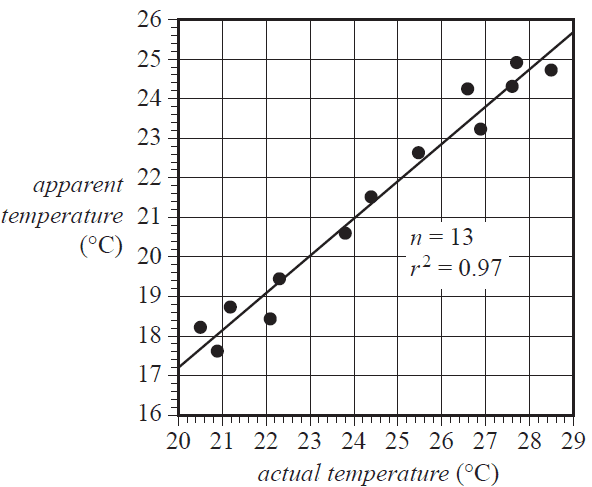
a. Use the scatterplot to describe the association between apparent temperature and actual temperature in terms of strength, direction and form. 1 mark
b. i. Determine the equation of the least squares line that can be used to predict the apparent temperature from the actual temperature. Write the values of the intercept and slope of this least squares line in the appropriate boxes provided below. Round your answers to two significant figures. 3 marks
apparent temperature = + × actual temperature
ii. Interpret the intercept of the least squares line in terms of the variables apparent temperature and actual temperature. 1 mark
c. The coefficient of determination for the association between the variables apparent temperature and actual temperature is 0.97. Interpret the coefficient of determination in terms of these variables. 1 mark
d. The residual plot obtained when the least squares line was fitted to the data is shown below.
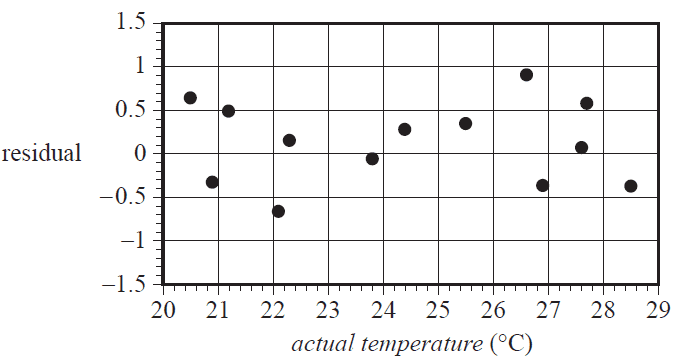
i. A residual plot can be used to test an assumption about the nature of the association between two numerical variables. What is this assumption? 1 mark
ii. Does the residual plot above support this assumption? Explain your answer. 1 mark
End of Multiple-Choice Question Book
VCE is a registered trademark of the VCAA. The VCAA does not endorse or make any warranties regarding this study resource. Past VCE exams and related content can be accessed directly at www.vcaa.vic.edu.au
