2024 VCAA General Maths Exam 2
This is the full VCE General Maths Exam with worked solutions. You can also try Mini-Tests, which are official VCAA exams split into short tests you can do anytime.
Number of marks: 60
Reading time: 15 minutes
Writing time: 1.5 hours
Instructions
• Answer all questions in the spaces provided.
• Write your responses in English.
• In all questions where a numerical answer is required, you should only round your answer when instructed to do so.
• Unless otherwise indicated, the diagrams in this book are not drawn to scale.
Data analysis
Table 1 lists the Olympic year, year, and the gold medal-winning height for the men’s high jump, \(Mgold\), in metres, for each Olympic Games held from 1928 to 2020. No Olympic Games were held in 1940 or 1944, and the 2020 Olympic Games were held in 2021.
Table 1
| year | Mgold (m) |
|---|---|
| 1928 | 1.94 |
| 1932 | 1.97 |
| 1936 | 2.03 |
| 1948 | 1.98 |
| 1952 | 2.04 |
| 1956 | 2.12 |
| 1960 | 2.16 |
| 1964 | 2.18 |
| 1968 | 2.24 |
| 1972 | 2.23 |
| 1976 | 2.25 |
| 1980 | 2.36 |
| 1984 | 2.35 |
| 1988 | 2.38 |
| 1992 | 2.34 |
| 1996 | 2.39 |
| 2000 | 2.35 |
| 2004 | 2.36 |
| 2008 | 2.36 |
| 2012 | 2.33 |
| 2016 | 2.38 |
| 2020 | 2.37 |
a. For the data in Table 1, determine:
i. the maximum \(Mgold\) in metres 1 mark
ii. the percentage of \(Mgold\) values greater than 2.25 m. 1 mark
b. The mean of these \(Mgold\) values is 2.23 m, and the standard deviation is 0.15 m.
Calculate the standardised z-score for the 2000 \(Mgold\) of 2.35 m. 1 mark
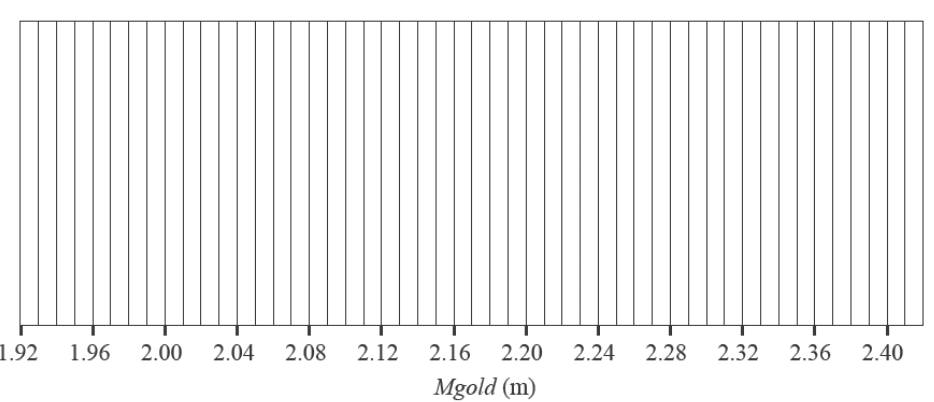
c. Construct a boxplot for the \(Mgold\) data in Table 1 on the grid below. 2 marks
d. A least squares line can also be used to model the association between \(Mgold\) and year.
Using the data from Table 1, determine the equation of the least squares line for this data set.
Use the template below to write your answer.
Round the values of the intercept and slope to three significant figures. 2 marks
\(Mgold = \) \(+\) \(\times \textit{year}\)
e. The coefficient of determination is 0.857
Interpret the coefficient of determination in terms of \(Mgold\) and year. 1 mark
The boxplot below displays the distribution of all gold medal-winning heights for the women’s high jump, \(Wgold\), in metres, for the 19 Olympic Games held from 1948 to 2020.
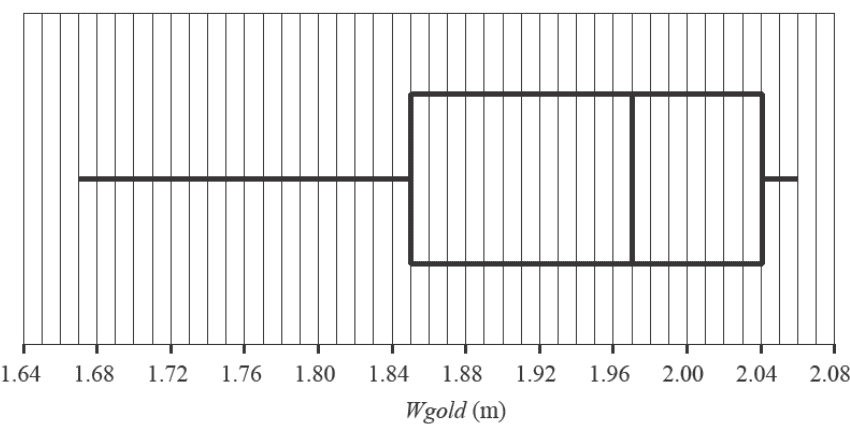
a. Describe the shape of this data distribution. 1 mark
b. For this boxplot, what is the smallest possible number of \(Wgold\) heights lower than 1.85 m? 1 mark
c.
i. Using the boxplot, show that the lower fence is 1.565 m and the upper fence is 2.325 m. 1 mark
ii. Referring to the boxplot, the lower fence and the upper fence, explain why no outliers exist. 1 mark
The Olympic gold medal-winning height for the women’s high jump, \(Wgold\), is often lower than the best height achieved in other international women’s high jump competitions in that same year.
Table 2 lists the Olympic year, year, the gold medal-winning height, \(Wgold\), in metres, and the best height achieved in all international women’s high jump competitions in that same year, \(Wbest\), in metres, for each Olympic year from 1972 to 2020.
Table 2
| year | 1972 | 1976 | 1980 | 1984 | 1988 | 1992 | 1996 | 2000 | 2004 | 2008 | 2012 | 2016 | 2020 |
|---|---|---|---|---|---|---|---|---|---|---|---|---|---|
| Wgold (m) | 1.92 | 1.93 | 1.97 | 2.02 | 2.03 | 2.02 | 2.05 | 2.01 | 2.06 | 2.05 | 2.05 | 1.97 | 2.04 |
| Wbest (m) | 1.94 | 1.96 | 1.98 | 2.07 | 2.07 | 2.05 | 2.05 | 2.02 | 2.06 | 2.06 | 2.05 | 2.01 | 2.05 |
A scatterplot of \(Wbest\) versus \(Wgold\) for this data is also provided.
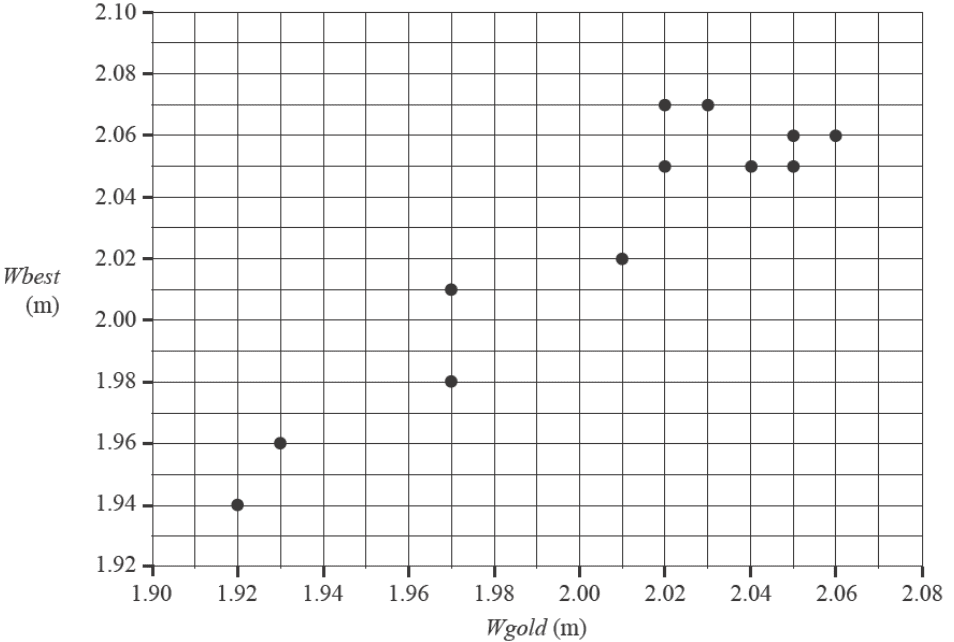
When a least squares line is fitted to the scatterplot, the equation is found to be:
\(Wbest = 0.300 + 0.860 \times Wgold\)
The correlation coefficient is 0.9318
a. Name the response variable in this equation. 1 mark
b. Draw the least squares line on the scatterplot above. 1 mark
c. Determine the value of the coefficient of determination as a percentage.
Round your answer to one decimal place. 1 mark
d. Describe the association between \(Wbest\) and \(Wgold\) in terms of strength and direction. 1 mark
| strength | |
| direction< |
e. Referring to the equation of the least squares line, interpret the value of the slope in terms of the variables \(Wbest\) and \(Wgold\). 1 mark
f. In 1984, the \(Wbest\) value was 2.07 m for a \(Wgold\) value of 2.02 m.
Show that when this least squares line is fitted to the scatterplot, the residual value for this point is 0.0328 2 marks
g. The residual plot obtained when the least squares line was fitted to the data is shown below. The residual value from part f is missing from the residual plot.
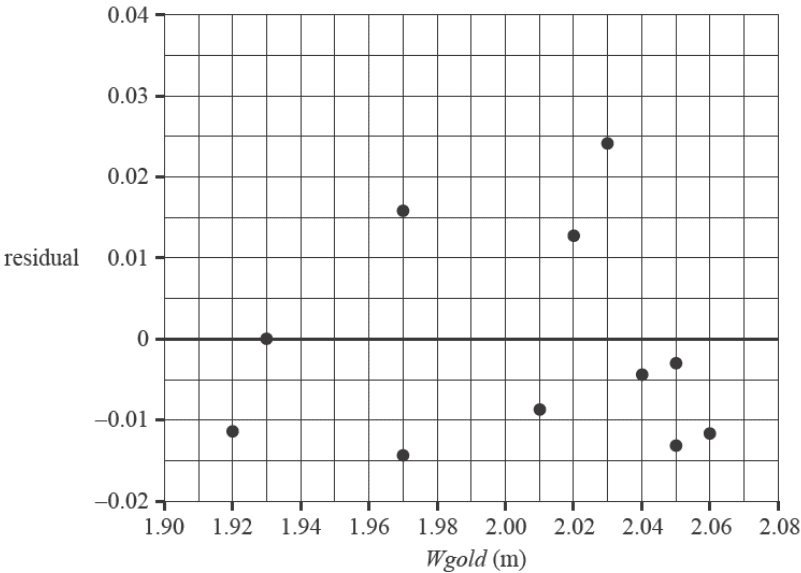
i. Complete the residual plot by adding the residual value from part f, drawn as a cross (X), to the residual plot above. 1 mark
ii. In part b, a least squares line was fitted to the scatterplot.
Does the residual plot from part g justify this? Briefly explain your answer. 1 mark
h. In 1964, the gold medal-winning height, \(Wgold\), was 1.90 m. When the least squares line is used to predict \(Wbest\), it is found to be 1.934 m.
Explain why this prediction is not likely to be reliable. 1 mark
The time series plot below shows the gold medal-winning height for the women’s high jump, \(Wgold\), in metres, for each Olympic year, year, from 1952 to 1988.
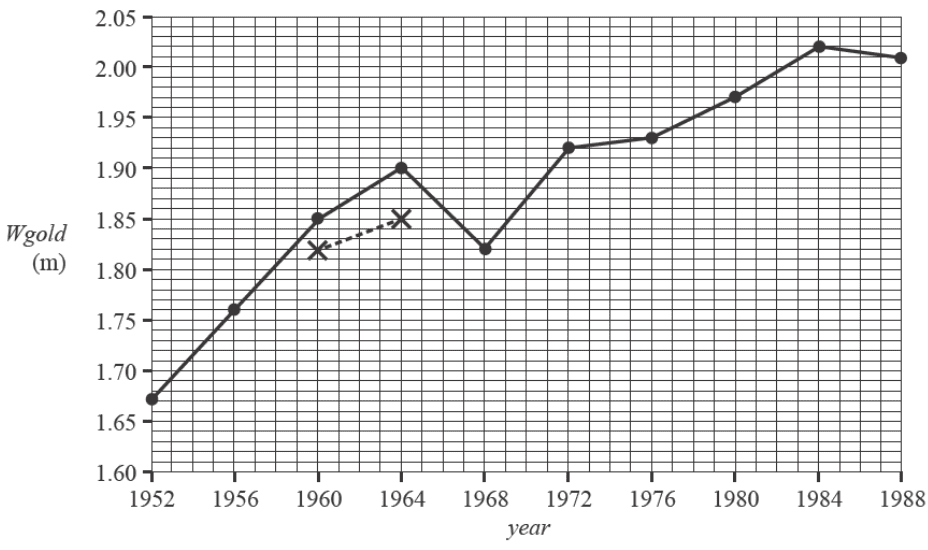
A five-median smoothing process will be used to smooth the time series plot above.
The first two points have been placed on the graph with crosses (X) and joined by a dashed line (---).
a. Complete the five-median smoothing by marking smoothed values with crosses (X) joined by a dashed line (---) on the time series plot above. 1 mark
b. Identify two qualitative features that best describe the time series plot above. 1 mark
Recursion and financial modelling
Emi operates a mobile dog-grooming business.
The value of her grooming equipment will depreciate.
Based on average usage, a rule for the value, in dollars, of the equipment, \(V_n\), after \(n\) weeks is
\(V_n = 15000 - 60n\)
Assume that there are exactly 52 weeks in a year.
a. By what amount, in dollars, does the value of the grooming equipment depreciate each week? 1 mark
b. Emi plans to replace the grooming equipment after four years.
What will be its value, in dollars, at this time? 1 mark
c. \(V_n\) is the value of the grooming equipment, in dollars, after \(n\) weeks.
Write a recurrence relation in terms of \(V_0\), \(V_{n+1}\) and \(V_n\) that can model this value from one week to the next. 1 mark
d. The value of the grooming equipment decreases from one year to the next by the same percentage of the original $15 000 value.
What is this annual flat rate percentage? 1 mark
Emi invested profits of $10 000 into a savings account that earns interest compounding fortnightly, for one year.
The effective interest rate, rounded to two decimal places, is 5.07%.
Assume that there are exactly 26 fortnights in a year.
a. What is the nominal percentage rate of interest for the account?
Round your answer to two decimal places. 1 mark
b. Explain why the nominal interest rate appears lower than the effective interest rate. 1 mark
Emi decides to invest a $300 000 inheritance into an annuity.
Let \(E_n\) be the balance of Emi’s annuity after \(n\) months.
A recurrence relation that can model the value of this balance from month to month is
\(E_0 = 300 000, \quad E_{n+1} = 1.003E_n - 2159.41\)
a. Showing recursive calculations, determine the balance of the annuity after two months.
Round your answer to the nearest cent. 1 mark
b. For how many years will Emi receive the regular payment? 1 mark
c. Calculate the annual compound interest rate for this annuity. 1 mark
d. If Emi wanted the annuity to act as a perpetuity, what monthly payment, in dollars, would she receive? 1 mark
Emi takes out a reducing balance loan of $500 000.
The interest rate is 5.3% per annum, compounding monthly.
Emi makes regular monthly repayments of $3071.63 for the duration of the loan, with only the final repayment amount being slightly different from all the other repayments.
Determine the total cost of Emi’s loan, rounding your answer to the nearest cent, and state the number of payments required to fully repay the loan.
total cost =
number of payments =
Matrices
Vince works on a construction site.
The amount Vince gets paid depends on the type of shift he works, as shown in the table below.
| Shift type | Normal | Overtime | Weekend |
|---|---|---|---|
| Hourly rate of pay ($ per hour) | 36 | 54 | 72 |
This information is shown in matrix \(R\) below.
\(R = [36 \quad 54 \quad 72]\)
a. Matrix \(R^T\) is the transpose of matrix \(R\).
Write down matrix \(R^T\) in the space below. 1 mark
\(R^T = \)
During one week, Vince works 28 hours at the normal rate of pay, 6 hours at the overtime rate of pay, and 8 hours at the weekend rate of pay.
b. Complete the following matrix calculation showing the total amount Vince has been paid for this week. 1 mark
[ ] × \(R^{\mathrm{T}}\) = [ ]
c. Vince will receive $90 per hour if he works a public holiday shift.
Matrix \(Q\), as calculated below, can be used to show Vince’s hourly rate for each type of shift.
\(Q = n \times [1 \quad 1.5 \quad 2 \quad p] = [36 \quad 54 \quad 72 \quad 90]\)
Write the values of \(n\) and \(p\) in the boxes below. 1 mark
\(n = \)
\(p = \)
To access the southern end of the construction site, Vince must enter a security code consisting of five numbers.
The security code is represented by the row matrix \(W\).
The element in row \(i\) and column \(j\) of \(W\) is \(w_{ij}\).
The elements of \(W\) are determined by the rule \((i - j)^2 + 2j\).
a. Complete the following matrix showing the five numbers in the security code. 1 mark
\(W =\) [ ]
To access the northern end of the construction site, Vince enters a different security code, consisting of eight numbers.
This security code is represented by the row matrix \(X\).
The element in row \(i\) and column \(j\) of \(X\) is \(x_{ij}\).
The elements of \(X\) are also determined by the rule \((i - j)^2 + 2j\).
b. What is the last number in this security code to access the northern end of the construction site? 1 mark
A population of a native animal species lives near the construction site.
To ensure that the species is protected, information about the initial female population was collected at the beginning of 2023. The birth rates and the survival rates of the females in this population were also recorded.
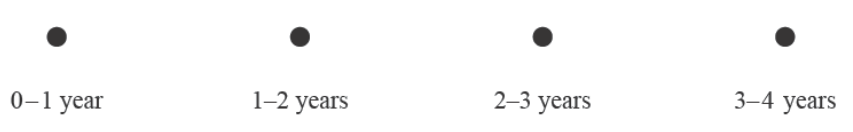
This species has a life span of 4 years and the information collected has been categorised into four age groups: 0–1 year, 1–2 years, 2–3 years, and 3–4 years.
This information is displayed in the initial population matrix, \(R_0\), and the Leslie matrix, \(L\), below.
\[ R_0 = \begin{bmatrix} 70 \\ 80 \\ 90 \\ 40 \end{bmatrix} \quad L = \begin{bmatrix} 0.4 & 0.75 & 0.4 & 0 \\ 0.4 & 0 & 0 & 0 \\ 0 & 0.7 & 0 & 0 \\ 0 & 0 & 0.5 & 0 \end{bmatrix} \]
a. Using the information above
i. complete the following transition diagram. 1 mark
ii. complete the following table, showing the initial female population, and the predicted female population after one year, for each of the age groups. 1 mark
| Age group | ||||
|---|---|---|---|---|
| 0–1 year | 1–2 years | 2–3 years | 3–4 years | |
| Initial population | ||||
| Population after one year | ||||
b. It is predicted that if this species is not protected, the female population of each of the four age groups will rapidly decrease within the next 10 years.
After how many years is it predicted that the total female population of this species will first be half the initial female population? 1 mark
When the construction company established the construction site at the beginning of 2023, it employed 390 staff to work on the site.
The staff comprised 330 construction workers (\(C\)), 50 foremen (\(F\)) and 10 managers (\(M\)).
At the beginning of each year, staff can choose to stay in the same job, move to a different job on the site, or leave the site (\(L\)) and not return.
The transition diagram below shows the proportion of staff who are expected to change their job at the site each year.
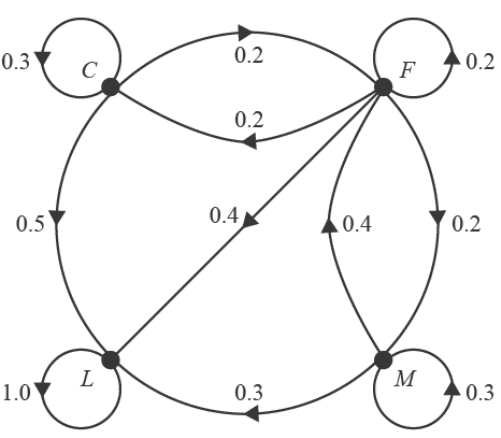
This situation can be modelled by the recurrence relation
\(S_{n+1} = TS_n\), where
\[ T \text{ is the transitional matrix, } S_0 = \begin{bmatrix} 330 \\ 50 \\ 10 \\ 0 \end{bmatrix} \begin{matrix} C \\ F \\ M \\ L \end{matrix} \text{ and } n \text{ is the number of years after 2023.} \]
a. Calculate the predicted percentage decrease in the number of foremen (\(F\)) on the site from 2023 to 2025. 1 mark
b. Determine the total number of staff on the site in the long term. 1 mark
To encourage more construction workers (\(C\)) to stay, the construction company has given workers an incentive to move into the job of foreman (\(F\)).
Matrix \(R\) below shows the ways in which staff are expected to change their jobs from year to year with this new incentive in place.
\[ \begin{array}{@{}c@{\,}c} & \begin{array}{@{}cccc@{}} C & F & M & L \end{array} \\ \begin{matrix} C \\ F \\ M \\ L \end{matrix} & \left[ \begin{array}{cccc} 0.4 & 0.2 & 0 & 0 \\ 0.4 & 0.2 & 0.4 & 0 \\ 0 & 0.2 & 0.3 & 0 \\ 0.2 & 0.4 & 0.3 & 1 \end{array} \right] \end{array} \]
The site always requires at least 330 construction workers.
To ensure that this happens, the company hires an additional 190 construction workers (\(C\)) at the beginning of 2024 and each year thereafter.
The matrix \(V_{n+1}\) will then be given by
\(V_{n+1} = RV_n + Z\), where
\[ V_0 = \begin{bmatrix} 330 \\ 50 \\ 10 \\ 0 \end{bmatrix} \begin{matrix} C \\ F \\ M \\ L \end{matrix} \quad Z = \begin{bmatrix} 190 \\ 0 \\ 0 \\ 0 \end{bmatrix} \begin{matrix} C \\ F \\ M \\ L \end{matrix} \text{ and } n \text{ is the number of years after 2023.} \]
c. How many more staff are there on the site in 2024 than there were in 2023? 1 mark
d. Based on this new model, the company has realised that in the long term there will be more than 200 foremen on site.
In which year will the number of foremen first be above 200? 1 mark
Networks and decision mathematics
A supermarket has five departments, with areas allocated as shown on the floorplan below.
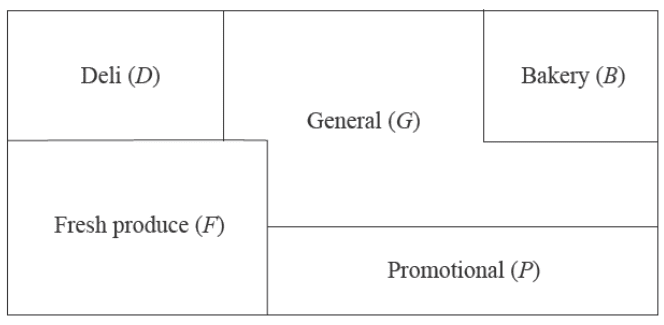
The floorplan is represented by the graph below.
On this graph, vertices represent departments and edges represent boundaries between two departments.
This graph is incomplete.
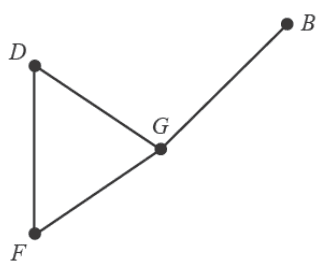
a. Draw the missing vertex and missing edges on the graph above. Include a label. 1 mark
Karla is standing in the Promotional department.
She wants to visit each department in the supermarket once only.
b.
i. In which department will she finish? 1 mark
ii. What is the mathematical name for this type of journey? 1 mark
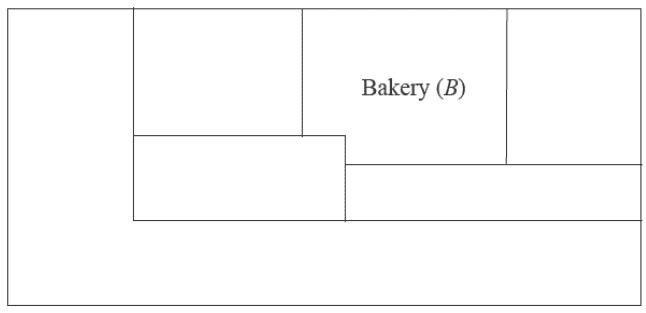
c. The supermarket adds a new Entertainment department (\(E\)), and the floorplan is rearranged.
The boundaries between the departments are represented in the adjacency matrix below, where a ‘1’ indicates a boundary between the departments.
\[ \begin{array}{@{}c@{\,}c} & \begin{array}{@{}cccccc@{}} B & D & E & F & G & P \end{array} \\ \begin{matrix} B \\ D \\ E \\ F \\ G \\ P \end{matrix} & \left[ \begin{array}{cccccc} 0 & 1 & 1 & 1 & 0 & 1 \\ 1 & 0 & 0 & 1 & 1 & 0 \\ 1 & 0 & 0 & 0 & 0 & 1 \\ 1 & 1 & 0 & 0 & 1 & 1 \\ 0 & 1 & 0 & 1 & 0 & 1 \\ 1 & 0 & 1 & 1 & 1 & 0 \end{array} \right] \end{array} \]
Use the adjacency matrix to complete the floorplan below by labelling each department. The Bakery (\(B\)) is already labelled. 1 mark
A manufacturer (\(M\)) makes deliveries to the supermarket (\(S\)) via a number of storage warehouses, \(L, N, O, P, Q\) and \(R\). These eight locations are represented as vertices in the network below.
The numbers on the edges represent the maximum number of deliveries that can be made between these locations each day.
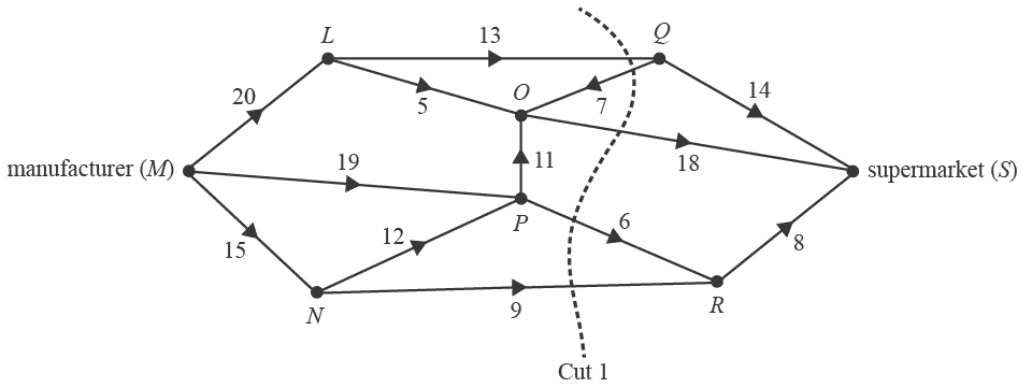
a. When considering the possible flow of deliveries through this network, many different cuts can be made.
Determine the capacity of Cut 1, shown above. 1 mark
b. Determine the maximum number of deliveries that can be made each day from the manufacturer to the supermarket. 1 mark
c. The manufacturer wants to increase the number of deliveries to the supermarket.
This can be achieved by increasing the number of deliveries between one pair of locations.
Complete the following sentence by writing the locations in the boxes provided:
To maximise this increase, the number of deliveries should be increased between locations and 1 mark
An upgrade to the supermarket requires the completion of 11 activities, \(A\) to \(K\).
The directed network below shows these activities and their completion time, in weeks.
The minimum completion time for the project is 29 weeks.
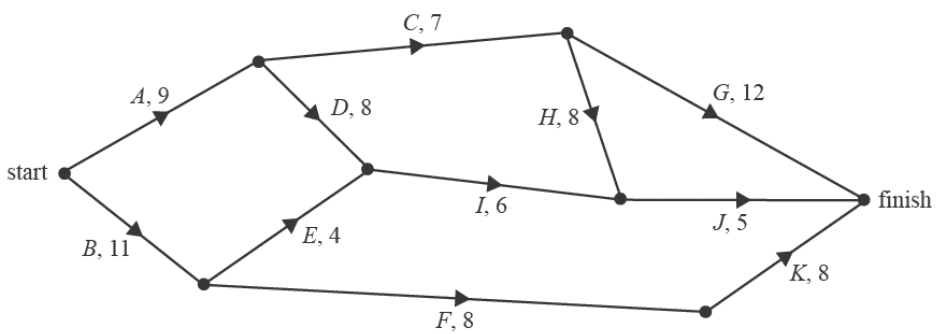
a. Write down the critical path. 1 mark
b. Which activity can be delayed for the longest time without affecting the minimum completion time of the project? 1 mark
Use the following information to answer parts c–e.
A change is made to the order of activities.
The table below shows the activities and their new latest starting times in weeks.
| Activity | Latest starting time (weeks) |
|---|---|
| A | 0 |
| B | 2 |
| C | 10 |
| D | 9 |
| E | 13 |
| F | 14 |
| G | 18 |
| H | 17 |
| I | 19 |
| J | 25 |
| K | 22 |
A dummy activity is now required in the network.
c. On the directed network below, draw a directed edge to represent the dummy activity. Include a label. 1 mark

d. What is the new minimum completion time of the project? 1 mark
e. The owners of the supermarket want the project completed earlier.
They will pay to reduce the time of some of the activities.
A reduction in completion time of an activity will incur an additional cost of $10 000 per week.
Activities can be reduced by a maximum of two weeks.
The minimum number of weeks an activity can be reduced to is seven weeks.
What is the minimum amount the owners of the supermarket will have to pay to reduce the completion time of the project as much as possible? 1 mark
End of Question and Answer Book
VCE is a registered trademark of the VCAA. The VCAA does not endorse or make any warranties regarding this study resource. Past VCE exams and related content can be accessed directly at www.vcaa.vic.edu.au
