2024 VCAA General Maths Exam 1
This is the full VCE General Maths Exam with worked solutions. You can also try Mini-Tests, which are official VCAA exams split into short tests you can do anytime.
Number of marks: 40
Reading time: 15 minutes
Writing time: 1.5 hours
Instructions
• Answer all questions in pencil on your Multiple-Choice Answer Sheet.
• Choose the response that is correct for the question.
• A correct answer scores 1; an incorrect answer scores 0.
• Marks will not be deducted for incorrect answers.
• No marks will be given if more than one answer is completed for any question.
• Unless otherwise indicated, the diagrams in this book are not drawn to scale.
Data analysis
A group of students were asked to name their favourite colour.
The results are displayed in the percentage segmented bar chart below.
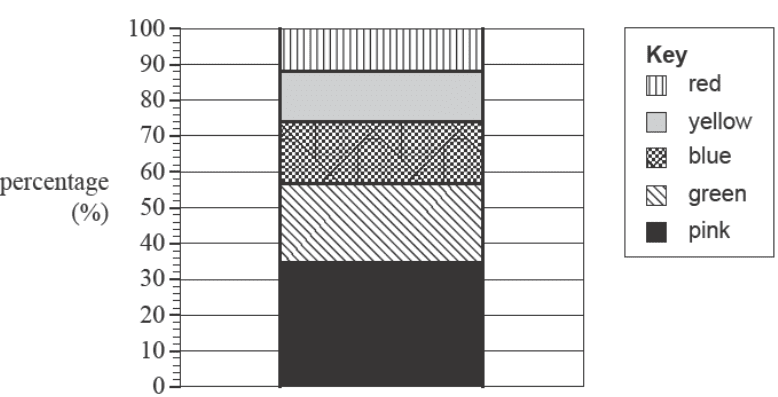
The percentage of students who named blue as their favourite colour is closest to
- A. 14%
- B. 18%
- C. 26%
- D. 74%
Freddie organised a function at work. He surveyed the staff about their preferences.
He asked them about their payment preference (cash or electronic payment) and their budget preference (less than $50 or more than $50).
The variables in this survey, payment preference and budget preference, are
- A. both categorical variables.
- B. both numerical variables.
- C. categorical and numerical variables, respectively.
- D. numerical and categorical variables, respectively.
Use the following information to answer Questions 3 and 4.
The histogram below displays the population density, in people per km², of the 27 countries in the European Union in 2021. The histogram has a logarithmic (base 10) scale.
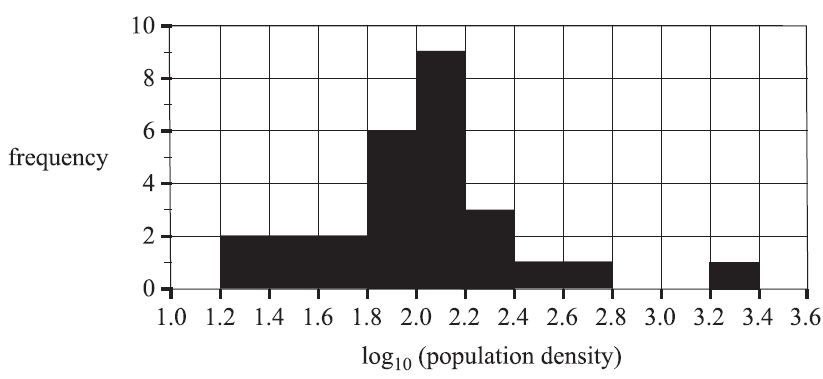
The median value occurs in a column with a frequency of
- A. 2
- B. 3
- C. 6
- D. 9
There is one outlier at the upper end of the histogram.
This value could be
- A. 330
- B. 1330
- C. 2030
- D. 2730
The number of siblings of each member of a class of 24 students was recorded.
The results are displayed in the table below.
| 2 | 1 | 3 | 2 | 1 | 1 | 1 | 4 | 1 | 1 | 1 | 1 |
| 1 | 2 | 1 | 2 | 2 | 1 | 3 | 4 | 2 | 2 | 3 | 1 |
A boxplot was constructed to display the spread of the data.
Which one of the following statements about this boxplot is correct?
- A. There are no outliers.
- B. The value of the interquartile range (IQR) is 1.5
- C. The value of the median is 1.5
- D. All of the five-number summary values are whole numbers.
More than 11 000 athletes from more than 200 countries competed in the Tokyo Summer Olympic Games.
An analysis of the number of athletes per country produced the following five-number summary.
| Minimum | First quartile | Median | Third quartile | Maximum |
|---|---|---|---|---|
| 2 | 5 | 11 | 48 | 613 |
The smallest number of athletes per country that would display as an outlier on a boxplot of this data is
- A. 49
- B. 112
- C. 113
- D. 613
Fiona plays nine holes of golf each week, and records her score.
Her mean score for all rounds in 2024 is 55.7
In one round, when she recorded a score of 48, her standardised score was \(z = -1.75\)
The standard deviation for score in 2024 is
- A. 1.1
- B. 2.3
- C. 4.4
- D. 6.95
The scatterplot below displays the average number of female athletes per competing nation, females, against the number of the Summer Olympic Games, number, from the first Olympic Games, in 1896, to the 29th Olympic Games, held in 2021.
A least squares line has been fitted to the scatterplot.
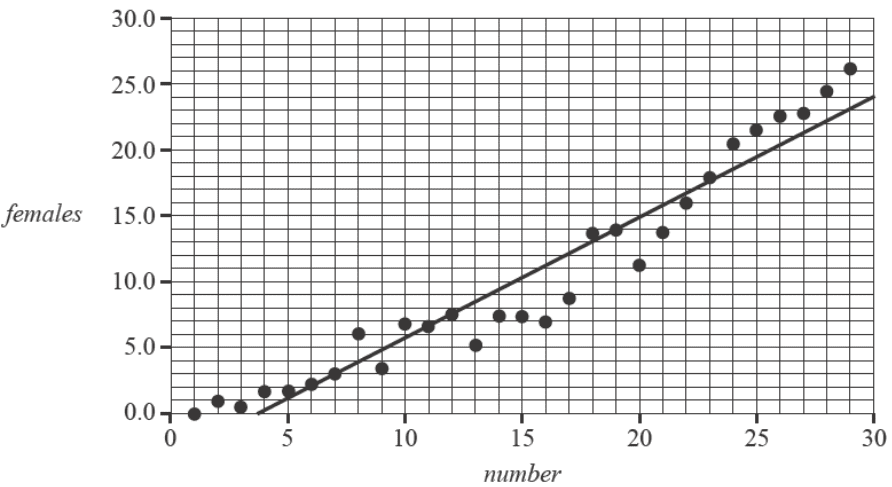
The equation of the least squares line is closest to
- A. females = -4.87 + 1.02 × number
- B. females = -3.39 + 0.91 × number
- C. number = -3.39 + 0.91 × females
- D. number = -0.91 + 3.39 × females
Use the following information to answer Questions 9 and 10.
The least squares equation for the relationship between the average number of male athletes per competing nation, males, and the number of the Summer Olympic Games, number, is
males = 67.5 – 1.27 × number
The summary statistics for the variables number and males are shown in the table below.
| number | males | |
|---|---|---|
| mean | 15.0 | 48.4 |
| standard deviation | 8.51 | 19.0 |
The value of Pearson's correlation coefficient, \(r\), rounded to three decimal places, is closest to
- A. –0.569
- B. –0.394
- C. 0.394
- D. 0.569
At which Summer Olympic Games will the predicted average number of males be closest to 25.6?
- A. 31st
- B. 32nd
- C. 33rd
- D. 34th
Use the following information to answer Questions 11 and 12.
The number of breeding pairs of a small parrot species has been declining over recent years. The table below shows the number of breeding pairs counted, pairs, and the year number, year, for the last 12 years. A scatterplot of this data is also provided.
The association between pairs and year is non-linear.
| year | pairs |
|---|---|
| 1 | 320 |
| 2 | 250 |
| 3 | 225 |
| 4 | 208 |
| 5 | 190 |
| 6 | 180 |
| 7 | 170 |
| 8 | 165 |
| 9 | 160 |
| 10 | 158 |
| 11 | 155 |
| 12 | 150 |
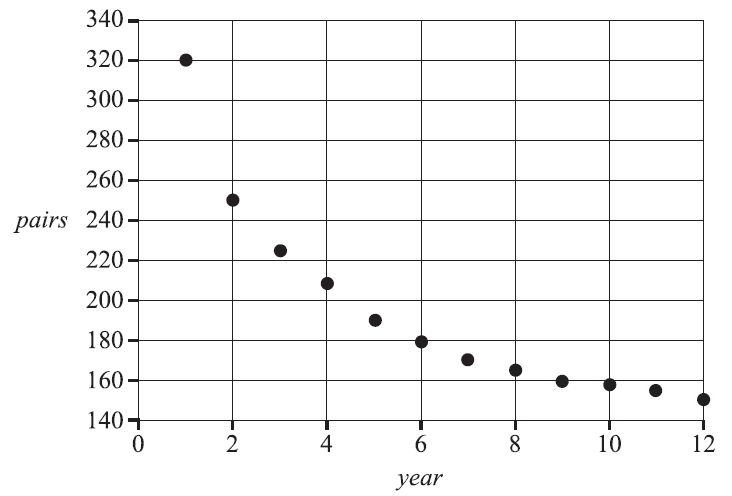
The scatterplot can be linearised using a logarithmic (base 10) transformation applied to the explanatory variable.
The least squares equation calculated from the transformed data is closest to
- A. \( \log_{10}(\textit{pairs}) = 2.44 – 0.0257 \times \textit{year} \)
- B. \( \log_{10}(\textit{pairs}) = 151 – 303 \times \textit{year} \)
- C. \( \textit{pairs} = 274 – 12.3 \times \log_{10}(\textit{year}) \)
- D. \( \textit{pairs} = 303 – 151 \times \log_{10}(\textit{year}) \)
A reciprocal transformation applied to the variable pairs can also be used to linearise the scatterplot.
When a least squares line is fitted to the plot of \( \frac{1}{\textit{pairs}} \) versus year, the largest difference between the actual value and the predicted value occurs at year
- A. 1
- B. 2
- C. 11
- D. 12
Use the following information to answer Questions 13 and 14.
A school runs an orientation program for new staff each January.
The time series plot below shows the number of new staff, new, for each year, year, from 2011 to 2022 (inclusive).
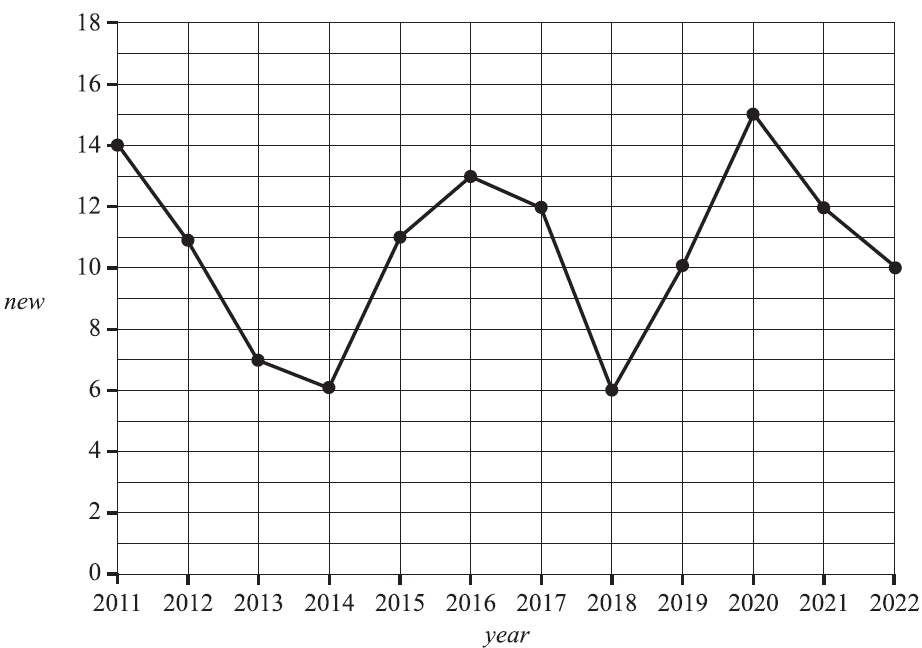
The time series is smoothed using seven-median smoothing.
The smoothed value of new for the year 2016 is
- A. 10
- B. 11
- C. 12
- D. 13
The number of new staff in 2023 is added to the total number of new staff from the previous 12 years.
For these 13 years, the mean number of new staff is 11.
The number of new staff in 2023 is
- A. 11
- B. 16
- C. 17
- D. 19
The table below shows the total number of cans of soft drink sold each month at a suburban cafe in 2023.
| Month | 1 | 2 | 3 | 4 | 5 | 6 | 7 | 8 | 9 | 10 | 11 | 12 |
| Cans sold | 316 | 321 | 365 | 306 | 254 | 308 | 354 | 357 | 381 | 355 | 365 | 324 |
The six-mean smoothed value of the number of cans sold, with centring, for month 5 is closest to
- A. 315
- B. 318
- C. 321
- D. 324
The table below shows the seasonal indices for the monthly takings of a bistro.
The seasonal indices for months 3 and 6 are missing.
| Month | 1 | 2 | 3 | 4 | 5 | 6 | 7 | 8 | 9 | 10 | 11 | 12 |
| Seasonal index | 1.08 | 1.13 | 0.92 | 0.67 | 1.09 | 1.35 | 0.82 | 0.88 | 1.01 | 0.98 |
The seasonal index for month 3 is twice the seasonal index for month 6.
The seasonal index for month 3 is closest to
- A. 0.69
- B. 1.04
- C. 1.38
- D. 2.07
Recursion and financial modelling
A first-order linear recurrence relation of the form
\( u_0 = a, \quad u_{n+1} = Ru_n + d \)
generates the terms of a sequence. A geometric sequence will be generated if
- A. \(R=1\) and \(d=-1\)
- B. \(R=1\) and \(d=1\)
- C. \(R=4\) and \(d=-1\)
- D. \(R=2\) and \(d=0\)
Trevor took out a reducing balance loan of $400 000, with interest calculated weekly.
The balance of the loan, in dollars, after \(n\) weeks, \(T_n\), can be modelled by the recurrence relation
\( T_0 = 400\,000, \quad T_{n+1} = 1.00075T_n - 677.55 \)
Assume that there are exactly 52 weeks in a year.
The interest rate, per annum, for this loan is
- A. 0.75%
- B. 3.9%
- C. 4.5%
- D. 7.5%
Liv bought a new car for $35 000. The value of the car will be depreciated by 18% per annum using the reducing balance method.
A recurrence relation that models the year-to-year value of her car is of the form
\( L_0 = 35\,000, \quad L_{n+1} = k \times L_n \)
The value of \(k\) is
- A. 0.0082
- B. 0.18
- C. 0.82
- D. 1.18
Dainika invested $2000 for three years at 4.4% per annum, compounding quarterly.
To earn the same amount of interest in three years in a simple interest account, the annual simple interest rate would need to be closest to
- A. 4.60%
- B. 4.68%
- C. 4.84%
- D. 4.98%
Lee took out a loan of $121 000, with interest compounding monthly. He makes monthly repayments of $2228.40 for five years until the loan is repaid in full.
The total interest paid by Lee is closest to
- A. $4434
- B. $5465
- C. $10 539
- D. $12 704
Use the following information to answer Questions 22 and 23.
Stewart takes out a reducing balance loan of $240 000, with interest calculated monthly.
Stewart makes regular monthly repayments.
Three lines of the amortisation table are shown below.
| Payment number | Payment ($) | Interest ($) | Principal reduction ($) | Balance ($) |
|---|---|---|---|---|
| 0 | 0.00 | 0.00 | 0.00 | 240 000.00 |
| 1 | 2741.05 | 960.00 | 1781.05 | 238 218.95 |
| 2 | 2741.05 |
The principal reduction associated with Payment number 2 is closest to
- A. $1773.93
- B. $1781.05
- C. $1788.17
- D. $2741.05
The number of years that it will take Stewart to repay the loan in full is closest to
- A. 9
- B. 10
- C. 11
- D. 12
André invested $18 000 in an account for five years, with interest compounding monthly.
He adds an extra payment into the account each month immediately after the interest is calculated.
For the first two years, the balance of the account, in dollars, after \(n\) months, \(A_n\), can be modelled by the recurrence relation
\( A_0 = 18\,000, \quad A_{n+1} = 1.002A_n + 100 \)
After two years, André decides he would like the account to reach a balance of $30 000 at the end of the five years.
He must increase the value of the monthly extra payment to achieve this.
The minimum value of the new payment for the last three years is closest to
- A. $189.55
- B. $195.45
- C. $202.35
- D. $246.55
Matrices
Matrix \(J\) is a \(2 \times 3\) matrix.
Matrix \(K\) is a \(3 \times 1\) matrix.
Matrix \(L\) is added to the product \(JK\).
The order of matrix \(L\) is
- A. \(1 \times 3\)
- B. \(2 \times 1\)
- C. \(2 \times 3\)
- D. \(3 \times 2\)
A market stall sells three types of candles.
The cost of each type of candle is shown in matrix \(C\) below.
\( C = \begin{bmatrix} 25 & 32 & 43 \end{bmatrix} \)
Towards the end of the day, the cost of each item is discounted by 15%.
Which one of the following expressions can be used to determine each discounted price?
- A. \(0.15C\)
- B. \(0.85C\)
- C. \(8.5C\)
- D. \(15C\)
Consider the following matrix, where \(h \neq 0\).
\( \begin{bmatrix} 4 & g \\ 8 & h \end{bmatrix} \)
The inverse of this matrix does not exist when \(g\) is equal to
- A. \(-2h\)
- B. \( \frac{h}{2} \)
- C. \(h\)
- D. \(2h\)
A primary school is hosting a sports day.
Students represent one of four teams: blue (\(B\)), green (\(G\)), red (\(R\)) or yellow (\(Y\)).
Students compete in one of three sports: football (\(F\)), netball (\(N\)) or tennis (\(T\)).
Matrix \(W\) shows the number of students competing in each sport and the team they represent.
\[ \begin{array}{c@{}c@{}c} & \begin{array}{@{}cccc@{}} B & G & R & Y \end{array} & \\ W= & \begin{bmatrix} 85 & 60 & 64 & 71 \\ 62 & 74 & 80 & 64 \\ 63 & 76 & 66 & 75 \end{bmatrix} & \begin{matrix} F \\ N \\ T \end{matrix} \end{array} \]
Matrix \(W\) is multiplied by the matrix \( \begin{bmatrix} 1 \\ 1 \\ 1 \\ 1 \end{bmatrix} \) to produce matrix \(X\).
Element \(x_{31}\) indicates that
- A. 210 students represent the blue team.
- B. 210 students compete in netball.
- C. 280 students compete in tennis.
- D. 280 students compete in football.
A tennis team consists of five players: Quinn, Rosie, Siobhan, Trinh and Ursula.
When the team competes, players compete in the order of first, then second, then third, then fourth.
The fifth player has a bye (does not compete).
On week 1 of the competition, the players competed in the following order.
| First | Second | Third | Fourth | Bye |
|---|---|---|---|---|
| Quinn | Rosie | Siobhan | Trinh | Ursula |
This information can be represented by matrix \(G_1\), shown below.
\( G_1 = \begin{bmatrix} Q & R & S & T & U \end{bmatrix} \)
Let \(G_n\) be the order of play in week \(n\).
The playing order changes each week and can be determined by the rule \(G_{n+1} = G_n \times P\)
where \( P = \begin{bmatrix} 0 & 1 & 0 & 0 & 0 \\ 0 & 0 & 0 & 0 & 1 \\ 1 & 0 & 0 & 0 & 0 \\ 0 & 0 & 1 & 0 & 0 \\ 0 & 0 & 0 & 1 & 0 \end{bmatrix} \)
Which player has a bye in week 4?
- A. Quinn
- B. Rosie
- C. Siobhan
- D. Trinh
Data has been collected on the female population of a species of mammal located on a remote island.
The female population has been divided into three age groups, with the initial population (at the time of data collection), the birth rate, and the survival rate of each age group shown in the table below.
| 0–2 | 2–4 | 4–6 | |
|---|---|---|---|
| Initial population | 2100 | 6400 | 4260 |
| Birth rate | 0 | 1.8 | 1.2 |
| Survival rate | 0.7 | 0.6 | 0 |
The Leslie matrix (\(L\)) that may be used to model this particular population is
- A. \( L = \begin{bmatrix} 0 & 1.8 & 0 \\ 0.7 & 0 & 1.2 \\ 0 & 0.6 & 0 \end{bmatrix} \)
- B. \( L = \begin{bmatrix} 0 & 1.8 & 1.2 \\ 0.7 & 0 & 0 \\ 0 & 0.6 & 0 \end{bmatrix} \)
- C. \( L = \begin{bmatrix} 0 & 1.8 & 1.2 \\ 0.7 & 0.6 & 0 \\ 0 & 0 & 0 \end{bmatrix} \)
- D. \( L = \begin{bmatrix} 2100 & 6400 & 4260 \\ 0 & 1.8 & 1.2 \\ 0.7 & 0.6 & 0 \end{bmatrix} \)
The matrix below shows the results of a round-robin chess tournament between five players: \(H, I, J, K\) and \(L\). In each game, there is a winner and a loser.
Two games still need to be played.
A '1' in the matrix shows that the player named in that row defeated the player named in that column.
For example, the 1 in row 4 shows that player \(K\) defeated player \(L\).
A '...' in the matrix shows that the player named in that row has not yet competed against the player in that column.
At the end of the tournament, players will be ranked by calculating the sum of their one-step and two-step dominances.
The player with the highest sum will be ranked first. The player with the second-highest sum will be ranked second, and so on.
Which one of the following is not a potential outcome after the final two games have been played?
- A. Player \(I\) will be ranked first.
- B. Player \(I\) will be ranked fifth.
- C. Player \(J\) will be ranked first.
- D. Player \(J\) will be ranked fifth.
A large sporting event is held over a period of four consecutive days: Thursday, Friday, Saturday and Sunday.
People can watch the event at four different sites throughout the city: Botanical Gardens (\(G\)), City Square (\(C\)), Riverbank (\(R\)) or Main Beach (\(M\)).
Let \(S_n\) be the state matrix that shows the number of people at each location \(n\) days after Thursday.
The expected number of people at each location can be determined by the matrix recurrence rule
\( S_{n+1} = TS_n + A \)
where \( T = \begin{bmatrix} 0.4 & 0.2 & 0.4 & 0 \\ 0.4 & 0.1 & 0.3 & 0.3 \\ 0.1 & 0.4 & 0.1 & 0.2 \\ 0.1 & 0.3 & 0.2 & 0.5 \end{bmatrix} \) and \( A = \begin{bmatrix} 300 \\ 200 \\ 100 \\ 300 \end{bmatrix} \)
Given the state matrix \( S_3 = \begin{bmatrix} 5620 \\ 6386 \\ 4892 \\ 6902 \end{bmatrix} \)
the number of people watching the event at the Botanical Gardens (\(G\)) from Thursday to Sunday has
- A. decreased by 162
- B. decreased by 212
- C. increased by 124
- D. increased by 696
Networks and decision mathematics
Consider the following graph.
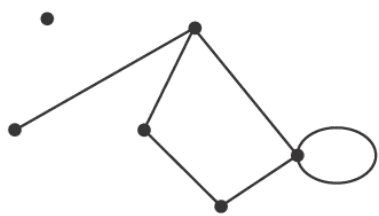
The sum of the degrees of the vertices is
- A. 10
- B. 11
- C. 12
- D. 13
Consider the following graph.
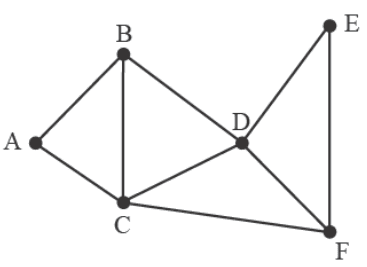
A Eulerian trail through this graph could be
- A. ABCDEF
- B. ACBDCFDEF
- C. BACBDCFDEF
- D. BDCABCDFCDEF
Consider the following graph.
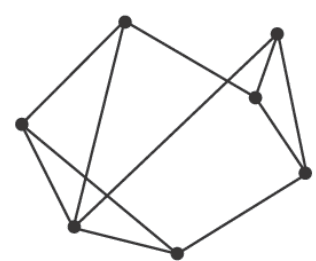
The number of faces is
- A. 5
- B. 6
- C. 7
- D. 8
Eight houses in an estate are to be connected to the internet via underground cables.
The network below shows the possible connections between the houses.
The vertices represent the houses.
The numbers on the edges represent the length of cable connecting pairs of houses, in metres.
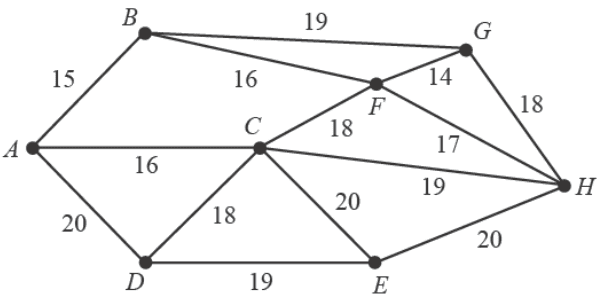
The graph that represents the minimum length of cable needed to connect all the houses is
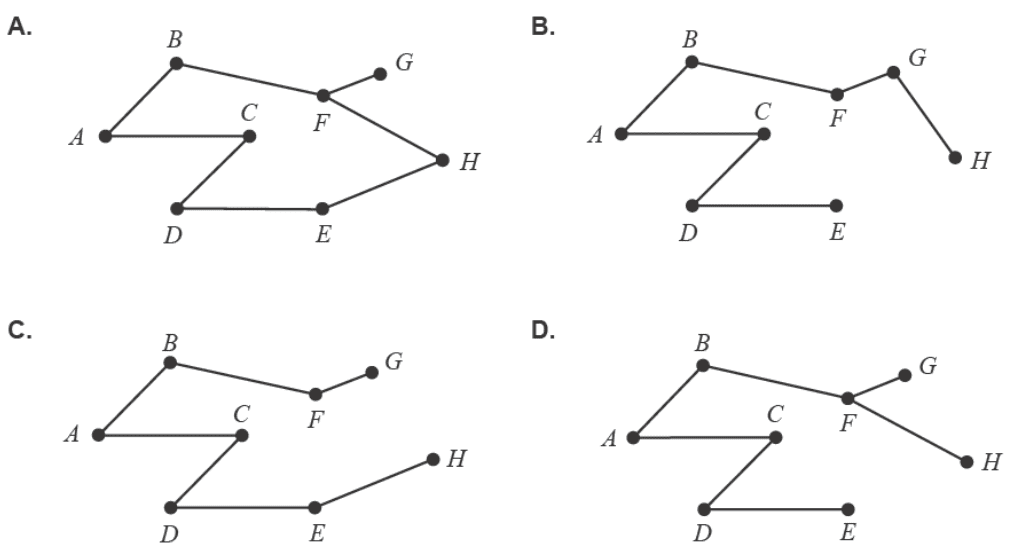
- A.
- B.
- C.
- D.
The network below represents paths through a park from the carpark to a lookout.
The vertices represent various attractions, and the numbers on the edges represent the distances between them in metres.
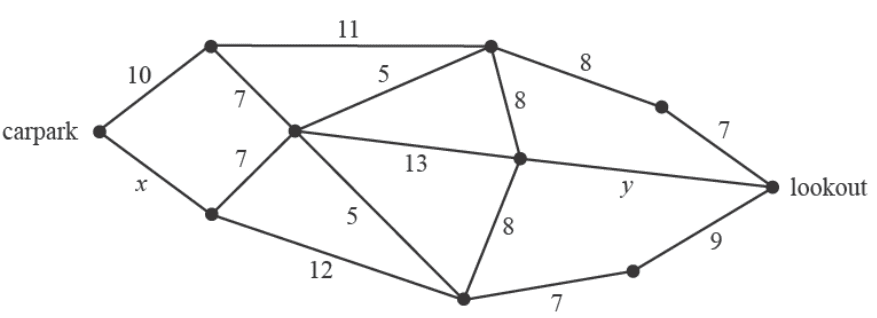
The shortest path from the carpark to the lookout is 34 m.
This can be achieved when
- A. \(x = 8\) and \(y = 8\)
- B. \(x = 9\) and \(y = 7\)
- C. \(x = 10\) and \(y = 6\)
- D. \(x = 11\) and \(y = 5\)
A connected graph has six vertices and six edges.
How many of the following four statements must always be true?
- the graph has no vertices of odd degree
- the graph contains a Eulerian trail
- the graph contains a Hamiltonian path
- the sum of the degrees of the vertices is 12
- A. 1
- B. 2
- C. 3
- D. 4
Anush, Blake, Carly and Dexter are workers on a construction site. They are each allocated one task.
The time, in hours, it takes for each worker to complete each task is shown in the table below.
| Task 1 | Task 2 | Task 3 | Task 4 | |
|---|---|---|---|---|
| Anush | 12 | 8 | 16 | 9 |
| Blake | 10 | 7 | 15 | 10 |
| Carly | 11 | 10 | 18 | 12 |
| Dexter | 10 | 14 | 16 | 11 |
The tasks must be completed sequentially and in numerical order: Task 1, Task 2, Task 3 and then Task 4.
Management makes an initial allocation of tasks to minimise the amount of time required, but then decides that it takes the workers too long.
Another worker, Edgar, is brought in to complete one of the tasks.
His completion times, in hours, are listed below.
| Task 1 | Task 2 | Task 3 | Task 4 | |
|---|---|---|---|---|
| Edgar | 9 | 5 | 14 | 8 |
When a new allocation is made and Edgar takes over one of the tasks, the minimum total completion time compared to the initial allocation will be reduced by
- A. 1 hour.
- B. 2 hours.
- C. 3 hours.
- D. 4 hours.
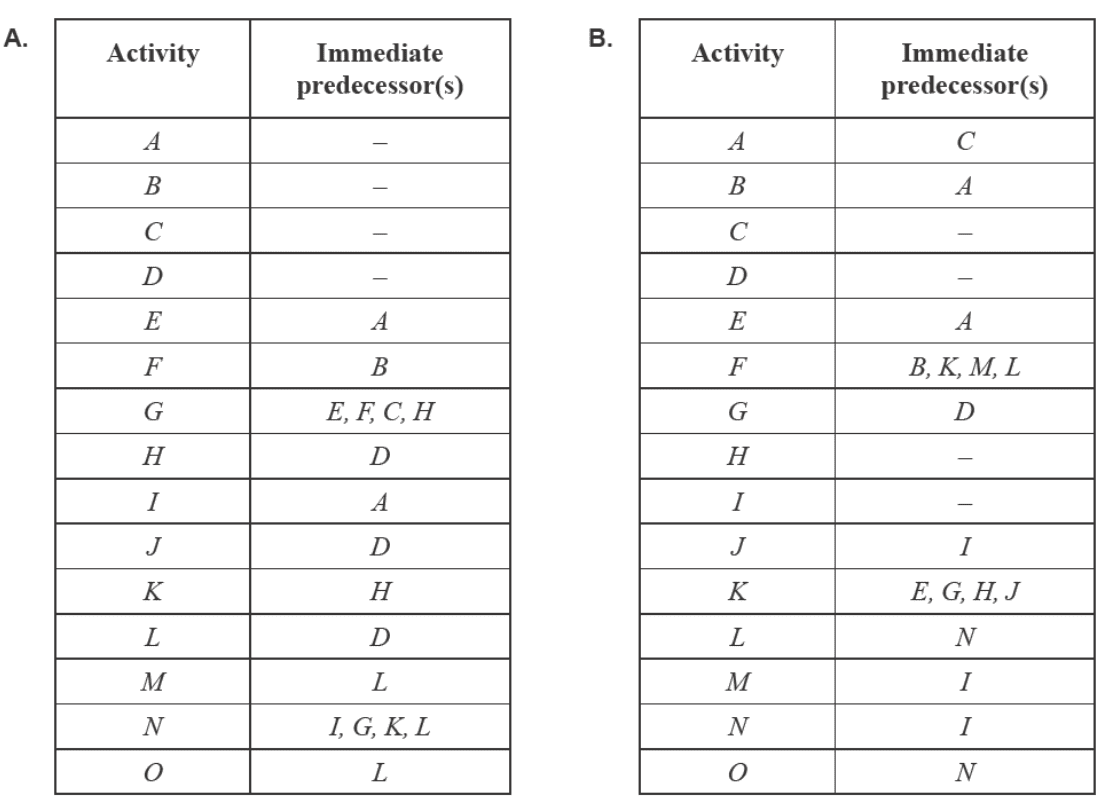
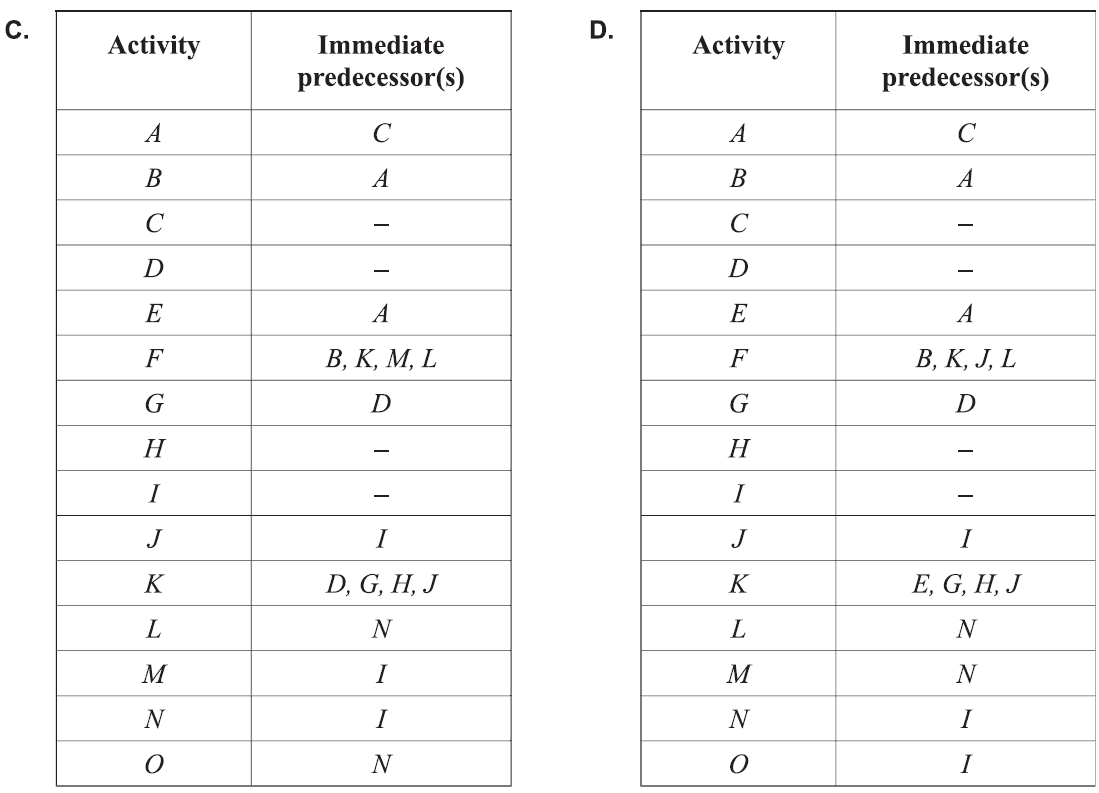
A project has 15 activities, \(A–O\), that need to be completed.
The directed network that represents this project is shown below.
The activities are not labelled.
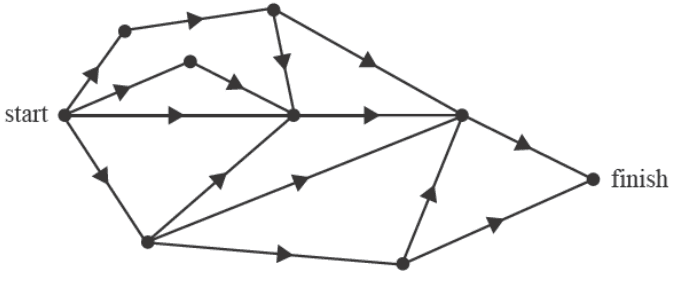
The activity table that could represent this project is
End of Multiple-Choice Question Book
VCE is a registered trademark of the VCAA. The VCAA does not endorse or make any warranties regarding this study resource. Past VCE exams and related content can be accessed directly at www.vcaa.vic.edu.au
