2023 VCAA General Maths Exam 2
This is the full VCE General Maths Exam with worked solutions. You can also try Mini-Tests, which are official VCAA exams split into short tests you can do anytime.
Number of marks: 60
Reading time: 15 minutes
Writing time: 1.5 hours
Instructions
• Answer all questions in pencil on your Multiple-Choice Answer Sheet.
• Choose the response that is correct for the question.
• A correct answer scores 1; an incorrect answer scores 0.
• Marks will not be deducted for incorrect answers.
• No marks will be given if more than one answer is completed for any question.
• Unless otherwise indicated, the diagrams in this book are not drawn to scale.
Data analysis
Data was collected to investigate the use of electronic images to automate the sizing of oysters for sale.
The variables in this study were:
- • ID: identity number of the oyster
- • weight: weight of the oyster in grams (g)
- • volume: volume of the oyster in cubic centimetres (cm³)
- • image size: oyster size determined from its electronic image (in megapixels)
- • size: oyster size when offered for sale: small, medium or large
The data collected for a sample of 15 oysters is displayed in Table 1.
Table 1
| ID | Weight (g) | Volume (cm³) | Image size (megapixels) | Size |
|---|---|---|---|---|
| 1 | 12.9 | 13.0 | 5.1 | large |
| 2 | 11.4 | 11.7 | 4.8 | medium |
| 3 | 17.4 | 17.4 | 6.5 | large |
| 4 | 6.8 | 7.2 | 2.9 | small |
| 5 | 9.6 | 10.1 | 3.7 | medium |
| 6 | 15.5 | 15.6 | 5.7 | large |
| 7 | 9.7 | 9.9 | 4.0 | small |
| 8 | 7.0 | 7.5 | 2.7 | small |
| 9 | 12.6 | 12.7 | 5.5 | medium |
| 10 | 12.5 | 12.7 | 5.0 | medium |
| 11 | 10.1 | 10.5 | 3.9 | medium |
| 12 | 10.6 | 10.8 | 4.1 | medium |
| 13 | 13.0 | 13.1 | 5.3 | large |
| 14 | 8.1 | 8.5 | 3.5 | small |
| 15 | 14.1 | 14.2 | 5.3 | large |
a. Write down the number of categorical variables in Table 1. 1 mark
b. Determine, in grams:
i. the mean weight of all the oysters in this sample 1 mark
mean =
ii. the median weight of the large oysters in this sample. 1 mark
median =
c. When a least squares line is used to model the association between oyster weight and volume, the equation is:
\(\textit{volume} = 0.780 + 0.953 \times \textit{weight}\)
i. Name the response variable in this equation. 1 mark
ii. Complete the following sentence by filling in the box provided. 1 mark
This equation predicts that, on average, each 10 g increase in the weight of an oyster is associated with a cm³ increase in its volume.
d. A least squares line can also be used to model the association between an oyster’s volume, in cm³, and its electronic image size, in megapixels. In this model, image size is the explanatory variable.
Using data from Table 1, determine the equation of this least squares line. Use the template below to write your answer. Round the values of the intercept and slope to four significant figures. 2 marks
\(=\) \(+\) \(\times\)
e. The number of megapixels needed to construct an accurate electronic image of an oyster is approximately normally distributed.
Measurements made on recently harvested oysters showed that:
- • 97.5% of the electronic images contain less than 4.6 megapixels
- • 84% of the electronic images contain more than 4.3 megapixels.
Use the 68–95–99.7% rule to determine, in megapixels, the mean and standard deviation of this normal distribution. 2 marks
mean =
standard deviation =
a. The following data shows the sizes of a sample of 20 oysters rated as small, medium or large.
| small | small | large | medium | medium |
| medium | large | small | medium | medium |
| small | medium | small | small | medium |
| medium | medium | medium | small | large |
i. Use the data above to complete the following frequency table. 1 mark
Table 2
| Frequency | ||
|---|---|---|
| Size | Number | Percentage (%) |
| small | 35 | |
| medium | 50 | |
| large | 15 | |
| Total | 100 | |
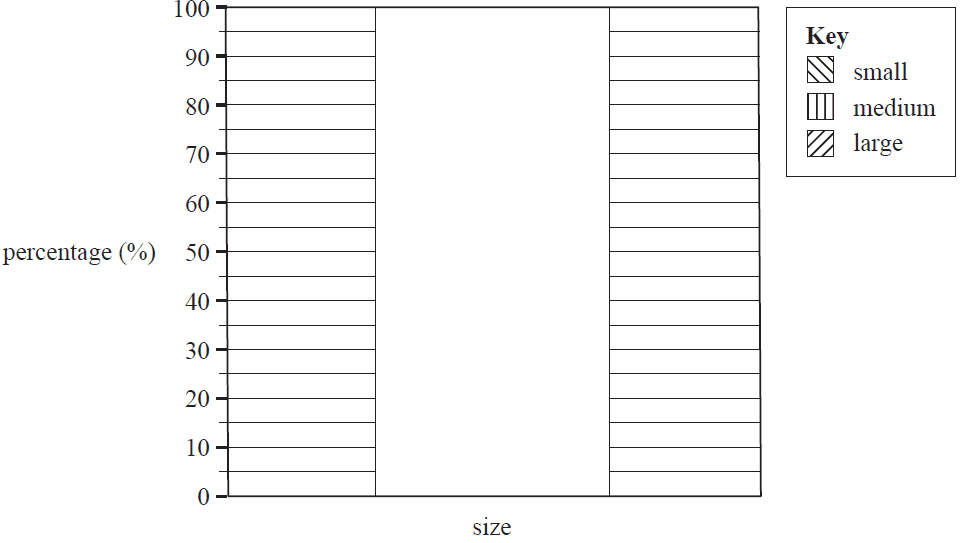
ii. Use the percentages in Table 2 to construct a percentage segmented bar chart below. A key has been provided. 1 mark
An oyster farmer has two farms, A and B.
She takes a random sample of oysters from each of the farms and has the oysters classified as small, medium or large.
The number of oysters of each size is displayed in the two-way table below.
Table 3
| Oyster size | Farm A | Farm B |
|---|---|---|
| small | 42 | 114 |
| medium | 124 | 160 |
| large | 44 | 46 |
| Total | 210 | 320 |
b.
i. Calculate the percentage of the total number of oysters graded as ‘large’ in this investigation. Round the percentage to the nearest whole number. 1 mark
ii. The farmer believes that farm A has a greater capacity to grow larger oysters than farm B. Does the information in Table 3 support the farmer’s belief? Explain your conclusion by comparing the values of two appropriate percentages. Round these percentages to the nearest whole number. 2 marks
The scatterplot below plots the average monthly ice cream consumption, in litres/person, against average monthly temperature, in °C. The data for the graph was recorded in the Northern Hemisphere.
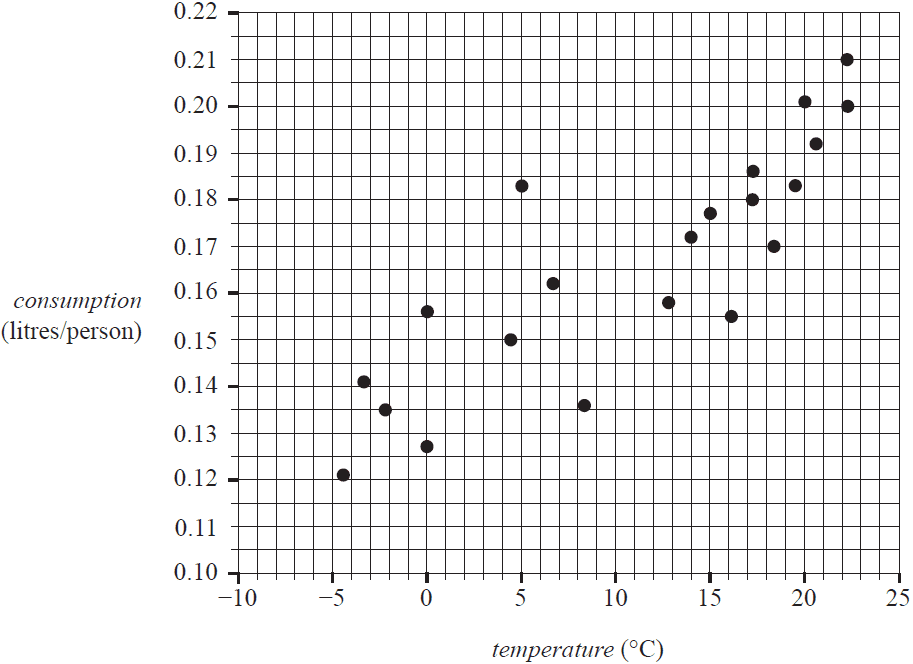
When a least squares line is fitted to the scatterplot, the equation is found to be:
\(\textit{consumption} = 0.1404 + 0.0024 \times \textit{temperature}\)
The coefficient of determination is 0.7212
a. Draw the least squares line on the scatterplot graph above. 1 mark
b. Determine the value of the correlation coefficient \(r\).
Round your answer to three decimal places. 1 mark
c. Describe the association between average monthly ice cream consumption and average monthly temperature in terms of strength, direction and form. 1 mark
| strength | |
| direction | |
| form |
d. Referring to the equation of the least squares line, interpret the value of the intercept in terms of the variables consumption and temperature. 1 mark
e. Use the equation of the least squares line to predict the average monthly ice cream consumption, in litres per person, when the monthly average temperature is –6 °C. 1 mark
f. Write down whether this prediction is an interpolation or an extrapolation. 1 mark
The time series plot below shows the average monthly ice cream consumption recorded over three years, from January 2010 to December 2012.
The data for the graph was recorded in the Northern Hemisphere.
In this graph, month number 1 is January 2010, month number 2 is February 2010 and so on.
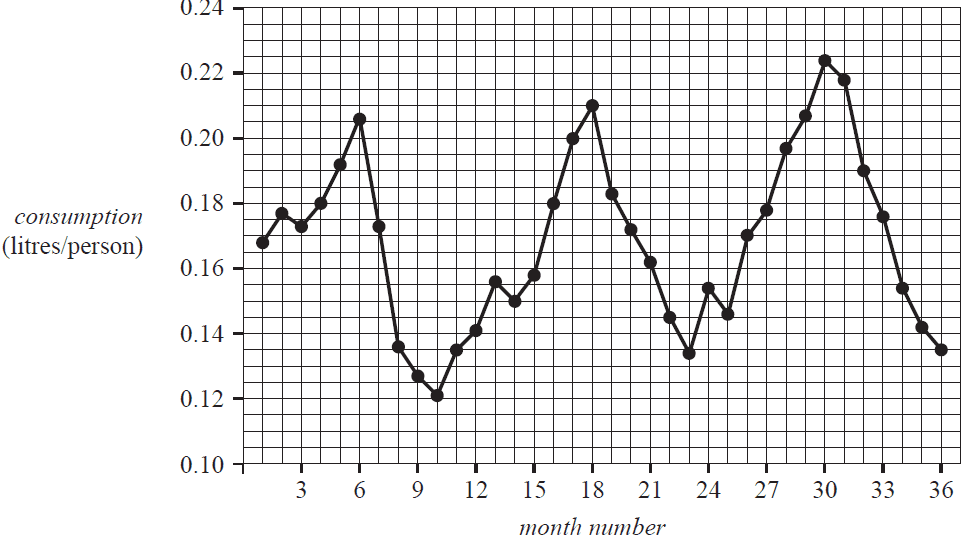
a. Identify a feature of this plot that is consistent with this time series having a seasonal component. 1 mark
b. The long-term seasonal index for April is 1.05.
Determine the deseasonalised value for average monthly ice cream consumption in April 2010 (month 4).
Round your answer to two decimal places. 1 mark
c. Table 4 below shows the average monthly ice cream consumption for 2011.
Table 4
| Consumption (litres/person) | ||||||||||||
|---|---|---|---|---|---|---|---|---|---|---|---|---|
| Year | Jan | Feb | Mar | Apr | May | Jun | Jul | Aug | Sep | Oct | Nov | Dec |
| 2011 | 0.156 | 0.150 | 0.158 | 0.180 | 0.200 | 0.210 | 0.183 | 0.172 | 0.162 | 0.145 | 0.134 | 0.154 |
Show that, when rounded to two decimal places, the seasonal index for July 2011 estimated from this data is 1.10. 2 marks
Recursion and financial modelling
Arthur borrowed $30 000 to buy a new motorcycle.
Interest on this loan is charged at the rate of 6.4% per annum, compounding quarterly.
Arthur will repay the loan in full with quarterly repayments over six years.
a. How many repayments, in total, will Arthur make? 1 mark
The balance of the loan, in dollars, after \(n\) quarters, \(A_n\), can be modelled by the recurrence relation
\(A_0 = 30000, \quad A_{n+1} = 1.016A_n - 1515.18\)
b. Showing recursive calculations, determine the balance of the loan after two quarters. Round your answer to the nearest cent. 1 mark
c. The final repayment required will differ slightly from all the earlier repayments of $1515.18
Determine the value of the final repayment.
Round your answer to the nearest cent. 1 mark
Arthur invests $600 000 in an annuity that provides him with a monthly payment of $3973.00
Interest is calculated monthly.
Three lines of the amortisation table for this annuity are shown below.
| Payment number | Payment ($) | Interest ($) | Principal reduction ($) | Balance ($) |
|---|---|---|---|---|
| 0 | 0.00 | 0.00 | 0.00 | 600 000.00 |
| 1 | 3973.00 | 2520.00 | 1453.00 | 598 547.00 |
| 2 | 3973.00 | 2513.90 | 1459.10 | 597 087.90 |
a. The interest rate for the annuity is 0.42% per month.
Determine the interest rate per annum. 1 mark
b. Using the values in the table, complete the next line of the amortisation table.
Write your answers in the spaces provided in the table below.
Round all values to the nearest cent. 1 mark
| Payment number | Payment ($) | Interest ($) | Principal reduction ($) | Balance ($) |
|---|---|---|---|---|
| 0 | 0.00 | 0.00 | 0.00 | 600 000.00 |
| 1 | 3973.00 | 2520.00 | 1453.00 | 598 547.00 |
| 2 | 3973.00 | 2513.90 | 1459.10 | 597 087.90 |
| 3 |
c. Let \(V_n\) be the balance of Arthur’s annuity, in dollars, after \(n\) months.
Write a recurrence relation in terms of \(V_0\), \(V_{n+1}\) and \(V_n\) that can model the value of the annuity from month to month. 1 mark
d. The amortisation tables on page 11 show that the balance of the annuity reduces each month.
If the balance of an annuity remained constant from month to month, what name would be given to this type of annuity? 1 mark
Arthur takes out a new loan of $60 000 to pay for an overseas holiday.
Interest on this loan compounds weekly.
The balance of the loan, in dollars, after \(n\) weeks, \(V_n\), can be determined using a recurrence relation of the form
\(V_0 = 60 000, \quad V_{n+1} = 1.0015V_n - d\)
a. Show that the interest rate for this loan is 7.8% per annum. 1 mark
b. Determine the value of \(d\) in the recurrence relation if
i. Arthur makes interest-only repayments 1 mark
ii. Arthur fully repays the loan in five years. Round your answer to the nearest cent. 1 mark
c. Arthur decides that the value of \(d\) will be 300 for the first year of repayments.
If Arthur fully repays the loan with exactly three more years of repayments, what new value of \(d\) will apply for these three years?
Round your answer to the nearest cent. 1 mark
d. For what value of \(d\) does the recurrence relation generate a geometric sequence? 1 mark
Matrices
A circus sells three different types of tickets: family (\(F\)), adult (\(A\)) and child (\(C\)).
The cost of admission, in dollars, for each ticket type is presented in matrix \(N\) below.
\[ N = \begin{bmatrix} 36 \\ 15 \\ 8 \end{bmatrix} \begin{matrix} F \\ A \\ C \end{matrix} \]
The element in row \(i\) and column \(j\) of matrix \(N\) is \(n_{ij}\).
a. Which element shows the cost for one child ticket? 1 mark
b. A family ticket will allow admission for two adults and two children.
Complete the matrix equation below to show that purchasing a family ticket could give families a saving of $10. 1 mark
[ 0 2 2 ] × \(N\) − [ ] × \(N\) = [ 10 ]
c. On the opening night, the circus sold 204 family tickets, 162 adult tickets and 176 child tickets.
The owners of the circus want a 3 × 1 product matrix that displays the revenue for each ticket type: family, adult and child.
This product matrix can be achieved by completing the following matrix multiplication.
\[ K \times N = \begin{bmatrix} 7344 \\ 2430 \\ 1408 \end{bmatrix} \]
Write down matrix \(K\) in the space below. 1 mark
\(K = \)
The circus is held at five different locations, \(E, F, G, H\) and \(I\).
The table below shows the total revenue for the ticket sales, rounded to the nearest hundred dollars, for the last 20 performances held at each of the five locations.
| Location | E | F | G | H | I |
|---|---|---|---|---|---|
| Ticket sales | $960 000 | $990 500 | $940 100 | $920 800 | $901 300 |
The ticket sales information is presented in matrix \(R\) below.
\(R = [960\,000 \quad 990\,500 \quad 940\,100 \quad 920\,800 \quad 901\,300]\)
a. Complete the matrix equation below that calculates the average ticket sales per performance at each of the five locations. 1 mark
[ ] × \(R\) = [ ]
The circus would like to increase its total revenue from the ticket sales from all five locations.
The circus will use the following matrix calculation to target the next 20 performances.
\[ [t] \times R \times \begin{bmatrix} 1 \\ 1 \\ 1 \\ 1 \\ 1 \end{bmatrix} \]
b. Determine the value of \(t\) if the circus would like to increase its revenue from ticket sales by 25%. 1 mark
c. The circus moves from one location to the next each month. It rotates through each of the five locations, before starting the cycle again.
The following matrix displays the movement between the five locations.
\[ \begin{array}{c@{}c} & \begin{array}{c} \textit{this month} \\ \begin{array}{@{}ccccc@{}} E & F & G & H & I \end{array} \end{array} \\ \begin{matrix} E \\ F \\ G \\ H \\ I \end{matrix} & \left[ \begin{array}{@{}ccccc@{}} 0 & 0 & 0 & 1 & 0 \\ 0 & 0 & 1 & 0 & 0 \\ 1 & 0 & 0 & 0 & 0 \\ 0 & 0 & 0 & 0 & 1 \\ 0 & 1 & 0 & 0 & 0 \end{array} \right] \end{array} \quad \textit{next month} \]
The circus plans to add a sixth location, \(J\).
The only change to the cycle is that the circus will be held at location \(J\) after location \(E\) and before location \(G\).
d. Complete the three columns in the following matrix, showing the new movement between the six locations, \(E, F, G, H, I\) and \(J\). 1 mark
\[ \begin{array}{c@{}c} & \begin{array}{c} \textit{this month} \\ \begin{array}{@{}cccccc@{}} E & F & G & H & I & J \end{array} \end{array} \\ \begin{matrix} E \\ F \\ G \\ H \\ I \\ J \end{matrix} & \left[ \begin{array}{@{}cccccc@{}} \underline{\hspace{0.5cm}} & 0 & \underline{\hspace{0.5cm}} & 1 & 0 & \underline{\hspace{0.5cm}} \\ \underline{\hspace{0.5cm}} & 0 & \underline{\hspace{0.5cm}} & 0 & 0 & \underline{\hspace{0.5cm}} \\ \underline{\hspace{0.5cm}} & 0 & \underline{\hspace{0.5cm}} & 0 & 0 & \underline{\hspace{0.5cm}} \\ \underline{\hspace{0.5cm}} & 0 & \underline{\hspace{0.5cm}} & 0 & 1 & \underline{\hspace{0.5cm}} \\ \underline{\hspace{0.5cm}} & 1 & \underline{\hspace{0.5cm}} & 0 & 0 & \underline{\hspace{0.5cm}} \\ \underline{\hspace{0.5cm}} & 0 & \underline{\hspace{0.5cm}} & 0 & 0 & \underline{\hspace{0.5cm}} \end{array} \right] \end{array} \quad \textit{next month} \]Within the circus, there are different types of employees: directors (\(D\)), managers (\(M\)), performers (\(P\)) and sales staff (\(S\)). Customers (\(C\)) attend the circus.
Communication between the five groups depends on whether they are customers or employees, and on what type of employee they are.
Matrix \(G\) below shows the communication links between the five groups.
\[ \begin{array}{cc} & \begin{array}{c} \mathrm{receiver} \\ \begin{array}{ccccc} D & M & P & S & C \end{array} \end{array} \\ G = \mathrm{sender} \begin{matrix} D \\ M \\ P \\ S \\ C \end{matrix} & \left[ \begin{array}{ccccc} 0 & 1 & 1 & 1 & 1 \\ 1 & 0 & 1 & 1 & 1 \\ 0 & 1 & 0 & 0 & 0 \\ 0 & 1 & 0 & 0 & 1 \\ 0 & 0 & 0 & 1 & 0 \end{array} \right] \end{array} \]
In this matrix:
- • The ‘1’ in row \(D\), column \(M\) indicates that the directors can communicate directly with the managers.
- • The ‘0’ in row \(P\), column \(D\) indicates that the performers cannot communicate directly with the directors.
a. A customer wants to make a complaint to a director.
What is the shortest communication sequence that will successfully get this complaint to a director? 1 mark
b. Matrix \(H\) below shows the number of two-step communication links between each group. Sixteen elements in this matrix are missing.
\[ \begin{array}{cc} & \begin{array}{c} \mathrm{receiver} \\ \begin{array}{ccccc} D & M & P & S & C \end{array} \end{array} \\ H = \mathrm{sender} \begin{matrix} D \\ M \\ P \\ S \\ C \end{matrix} & \left[ \begin{array}{ccccc} 1 & \_ & \_ & \_ & \_ \\ 0 & \_ & \_ & \_ & \_ \\ 1 & \_ & \_ & \_ & \_ \\ 1 & \_ & \_ & \_ & \_ \\ 0 & 1 & 0 & 0 & 1 \end{array} \right] \end{array} \]
i. Complete matrix \(H\) above by filling in the missing elements. 1 mark
ii. What information do elements \(g_{21}\) and \(h_{21}\) provide about the communication between the circus employees? 1 mark
The circus requires 180 workers to put on each show.
From one show to the next, workers can either continue working (\(W\)) or they can leave the circus (\(L\)).
Once workers leave the circus, they do not return.
It is known that 95% of the workers continue working at the circus.
This situation can be modelled by the matrix recurrence relation
\(S_0 = \begin{bmatrix} 180 \\ 0 \end{bmatrix}, \quad S_{n+1} = TS_n + B\)
a. Write down matrix \(T\), the transition matrix, for this recurrence relation. 1 mark
\[ T = \begin{array}{cc} & \begin{array}{c} \mathrm{this \ show} \\ \begin{array}{cc} W & L \end{array} \end{array} \\ \begin{matrix} W \\ L \end{matrix} & \left[ \begin{array}{cc} \_ & \_ \\ \_ & \_ \end{array} \right] \quad \mathrm{next \ show} \end{array} \]
b. Write down matrix \(B\) for this recurrence relation to ensure that the circus always has 180 workers. 1 mark
\[ B = \begin{bmatrix} \_ \\ \_ \end{bmatrix} \]
Networks and decision mathematics
A country has five states, \(A, B, C, D\) and \(E\).
A graph can be drawn with vertices to represent each of the states.
Edges represent a border shared between two states.
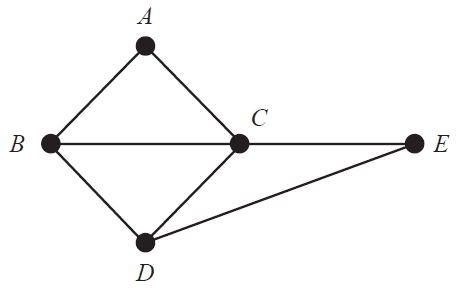
a. What is the sum of the degrees of the vertices of the graph above? 1 mark
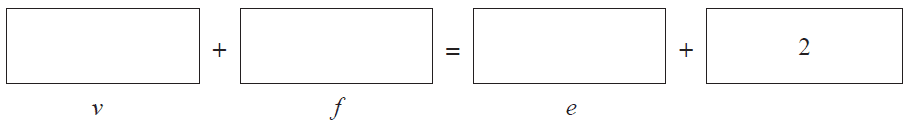
b. Euler’s formula, \(v + f = e + 2\), holds for this graph.
i. Complete the formula by writing the appropriate numbers in the boxes provided below. 1 mark
ii. Complete the sentence by writing the appropriate word in the box provided below. 1 mark
Euler’s formula holds for this graph because the graph is connected and .
c. The diagram below shows the position of state \(A\) on a map of this country.
The four other states are indicated on the diagram as 1, 2, 3 and 4.
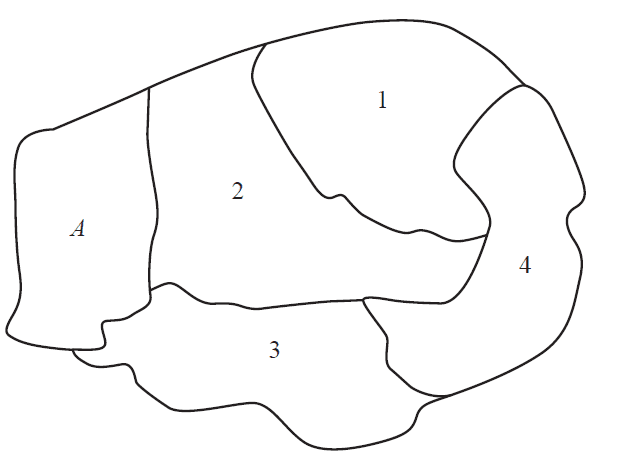
Use the information in the graph on page 20 to complete the table below. Match the state (\(B, C, D\) and \(E\)) with the corresponding state number (1, 2, 3 and 4) given in the map above. 1 mark
| State | State number |
|---|---|
| B | |
| C | |
| D | |
| E |
The state \(A\) has nine landmarks, \(G, H, I, J, K, L, M, N\) and \(O\).
The edges on the graph represent the roads between the landmarks.
The numbers on each edge represent the length, in kilometres, along each road.
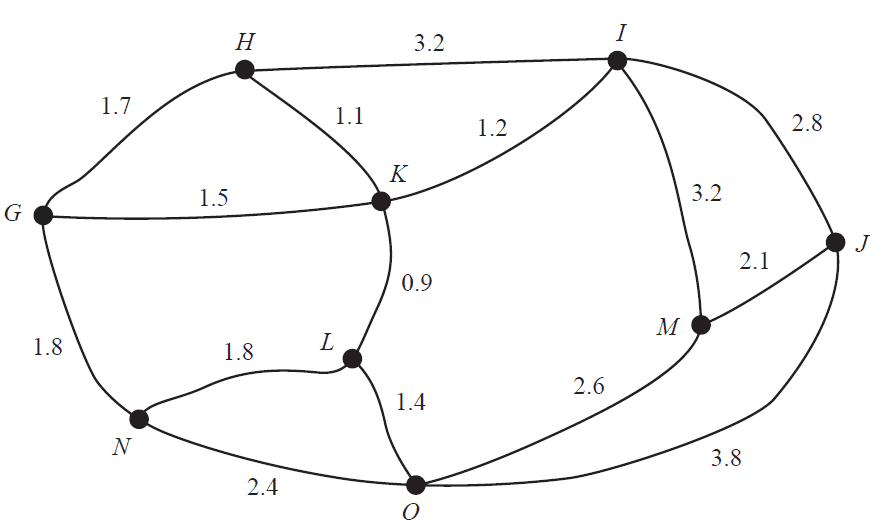
Three friends, Eden, Reynold and Shyla, meet at landmark \(G\).
a. Eden would like to visit landmark \(M\).
What is the minimum distance Eden could travel from \(G\) to \(M\)? 1 mark
b. Reynold would like to visit all the landmarks and return to \(G\).
Write down a route that Reynold could follow to minimise the total distance travelled. 1 mark
c. Shyla would like to travel along all the roads.
To complete this journey in the minimum distance, she will travel along two roads twice.
Shyla will leave from landmark \(G\) but end at a different landmark.
Complete the following by filling in the boxes provided.
The two roads that will be travelled along twice are the roads between:
- • vertex and vertex
- • vertex and vertex
One of the landmarks in state \(A\) requires a renovation project.
This project involves 12 activities, \(A\) to \(L\). The directed network below shows these activities and their completion times, in days.
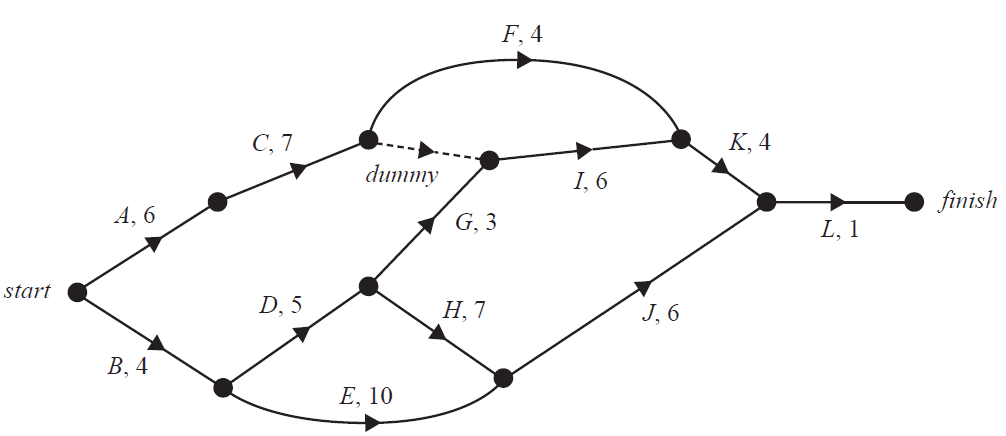
The table below shows the 12 activities that need to be completed for the renovation project.
It also shows the earliest start time (EST), the duration, and the immediate predecessors for the activities.
The immediate predecessor(s) for activity \(I\) and the EST for activity \(J\) are missing.
| Activity | EST | Duration | Immediate predecessor(s) |
|---|---|---|---|
| A | 0 | 6 | – |
| B | 0 | 4 | – |
| C | 6 | 7 | A |
| D | 4 | 5 | B |
| E | 4 | 10 | B |
| F | 13 | 4 | C |
| G | 9 | 3 | D |
| H | 9 | 7 | D |
| I | 13 | 6 | |
| J | 6 | E, H | |
| K | 19 | 4 | F, I |
| L | 23 | 1 | J, K |
a. Write down the immediate predecessor(s) for activity \(I\). 1 mark
b. What is the earliest start time, in days, for activity \(J\)? 1 mark
c. How many activities have a float time of zero? 1 mark
The managers of the project are able to reduce the time, in days, of six activities.
These reductions will result in an increase in the cost of completing the activity.
The maximum decrease in time of any activity is two days.
| Activity | A | B | F | H | I | K |
|---|---|---|---|---|---|---|
| Daily cost ($) | 1500 | 2000 | 2500 | 1000 | 1500 | 3000 |
d. If activities \(A\) and \(B\) have their completion time reduced by two days each, the overall completion time of the project will be reduced.
What will be the maximum reduction time, in days? 1 mark
e. The managers of the project have a maximum budget of $15 000 to reduce the time for several activities to produce the maximum reduction in the project’s overall completion time.
Complete the table below, showing the reductions in individual activity completion times that would achieve the earliest completion time within the $15 000 budget. 1 mark
| Activity | Reduction in completion time (0, 1 or 2 days) |
|---|---|
| A | |
| B | |
| F | |
| H | |
| I | |
| K |
End of Multiple-Choice Question Book
VCE is a registered trademark of the VCAA. The VCAA does not endorse or make any warranties regarding this study resource. Past VCE exams and related content can be accessed directly at www.vcaa.vic.edu.au
