2023 VCAA General Maths Exam 1
This is the full VCE General Maths Exam with worked solutions. You can also try Mini-Tests, which are official VCAA exams split into short tests you can do anytime.
Number of marks: 40
Reading time: 15 minutes
Writing time: 1.5 hours
Instructions
• Answer all questions in pencil on your Multiple-Choice Answer Sheet.
• Choose the response that is correct for the question.
• A correct answer scores 1; an incorrect answer scores 0.
• Marks will not be deducted for incorrect answers.
• No marks will be given if more than one answer is completed for any question.
• Unless otherwise indicated, the diagrams in this book are not drawn to scale.
Data analysis
Use the following information to answer Questions 1 and 2.
The dot plot below shows the times, in seconds, of 40 runners in the qualifying heats of their 800 m club championship.
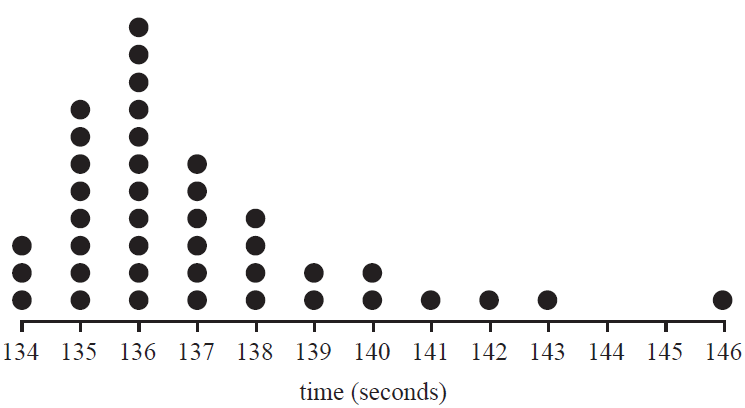
The median time, in seconds, of these runners is
- A. 135.5
- B. 136
- C. 136.5
- D. 137
- E. 137.5
The shape of this distribution is best described as
- A. positively skewed with one or more possible outliers.
- B. positively skewed with no outliers.
- C. approximately symmetric with one or more possible outliers.
- D. approximately symmetric with no outliers.
- E. negatively skewed with one or more possible outliers.
Gemma's favourite online word puzzle allows her 12 attempts to guess a mystery word. Her number of attempts for the last five days is displayed in the table below.
| Day | Number of attempts |
|---|---|
| 1 | 8 |
| 2 | 11 |
| 3 | 5 |
| 4 | 6 |
| 5 | 9 |
On day six, how many attempts can she make so that the mean number of attempts for these six days is exactly eight?
- A. 5
- B. 6
- C. 7
- D. 8
- E. 9
The time spent by visitors in a museum is approximately normally distributed with a mean of 82 minutes and a standard deviation of 11 minutes.
2380 visitors are expected to visit the museum today.
Using the 68–95–99.7% rule, the number of these visitors who are expected to spend between 60 and 104 minutes in the museum is
- A. 1128
- B. 1618
- C. 2256
- D. 2261
- E. 2373
The heights of a group of Year 8 students have a mean of 163.56 cm and a standard deviation of 8.14 cm. One student's height has a standardised \(z\)-score of –0.85.
This student's height, in centimetres, is closest to
- A. 155.4
- B. 156.6
- C. 162.7
- D. 170.5
- E. 171.7
The histogram below displays the distribution of prices, in dollars, of the cars for sale in a used-car yard. The histogram has a logarithm (base 10) scale.
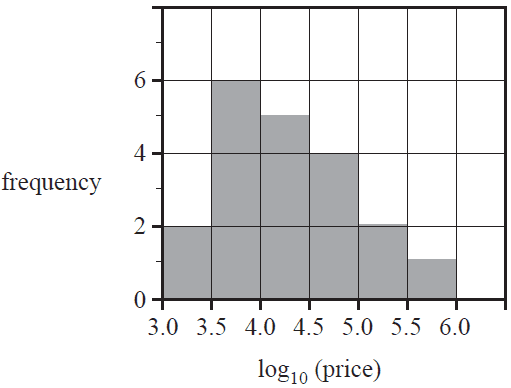
Six of the cars in the yard have the following prices:
- $2450
- $3175
- $4999
- $8925
- $10 250
- $105 600
How many of the six car prices listed above are in the modal class interval?
- A. 1
- B. 2
- C. 3
- D. 4
- E. 6
Use the following information to answer Questions 7 and 8.
A teacher analysed the class marks of 15 students who sat two tests. The test 1 mark and test 2 mark, all whole number values, are shown in the scatterplot below. A least squares line has been fitted to the scatterplot.
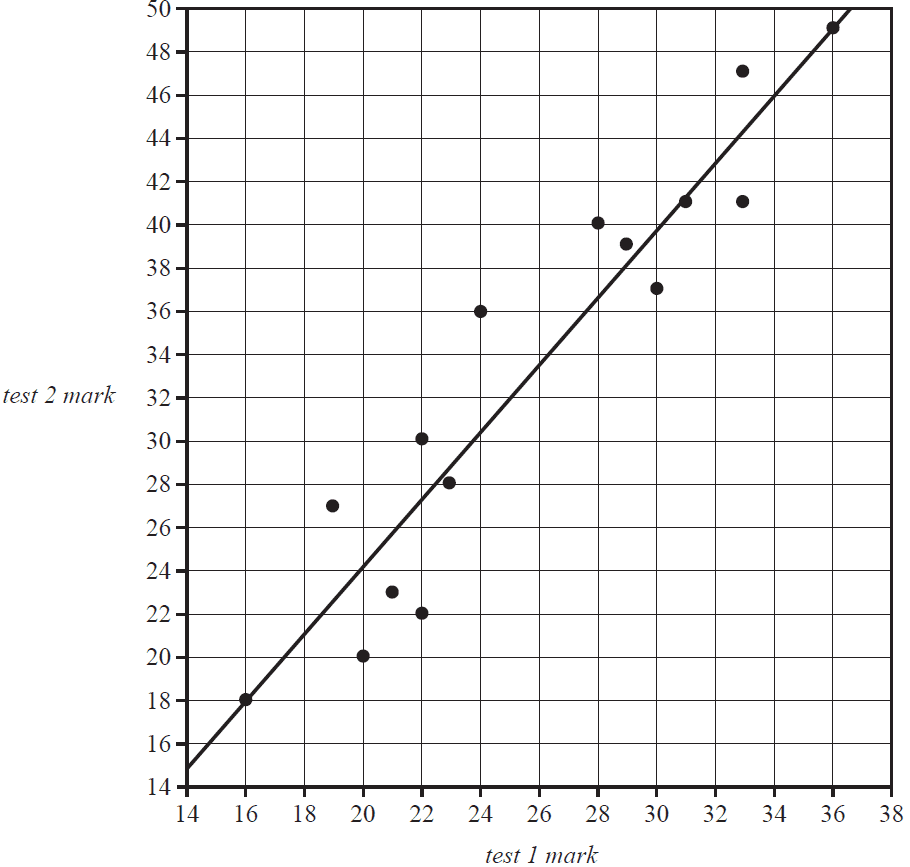
The equation of the least squares line is closest to
- A. test 2 mark = –6.83 + 1.55 × test 1 mark
- B. test 2 mark = 15.05 + 0.645 × test 1 mark
- C. test 2 mark = –6.78 + 0.645 × test 1 mark
- D. test 2 mark = 1.36 + 1.55 × test 1 mark
- E. test 2 mark = 6.83 + 1.55 × test 1 mark
The least squares line shows the predicted test 2 mark for each student based on their test 1 mark. The number of students whose actual test 2 mark was within two marks of that predicted by the line is
- A. 3
- B. 4
- C. 5
- D. 6
- E. 7
A least squares line can be used to model the birth rate (children per 1000 population) in a country from the average daily food energy intake (megajoules) in that country. When a least squares line is fitted to data from a selection of countries it is found that:
- for a country with an average daily food energy intake of 8.53 megajoules, the birth rate will be 32.2 children per 1000 population
- for a country with an average daily food energy intake of 14.9 megajoules, the birth rate will be 9.9 children per 1000 population.
The slope of this least squares line is closest to
- A. –4.7
- B. –3.5
- C. –0.29
- D. 2.7
- E. 25
A study of Year 10 students shows that there is a negative association between the scores of topic tests and the time spent on social media. The coefficient of determination is 0.72. From this information it can be concluded that
- A. a decreased time spent on social media is associated with an increased topic test score.
- B. less time spent on social media causes an increase in topic test performance.
- C. an increased time spent on social media is associated with an increased topic test score.
- D. too much time spent on social media causes a reduction in topic test performance.
- E. a decreased time spent on social media is associated with a decreased topic test score.
Use the following information to answer Questions 11 and 12.
The table below shows the height, in metres, and the age, in years, for 11 plantation trees. A scatterplot displaying this data is also shown.
| age (years) |
height (m) |
|---|---|
| 10 | 9.5 |
| 8 | 8.0 |
| 13 | 9.7 |
| 9 | 9.1 |
| 11 | 9.4 |
| 14 | 9.8 |
| 6 | 6.0 |
| 4 | 3.5 |
| 12 | 9.6 |
| 7 | 7.8 |
| 5 | 4.0 |
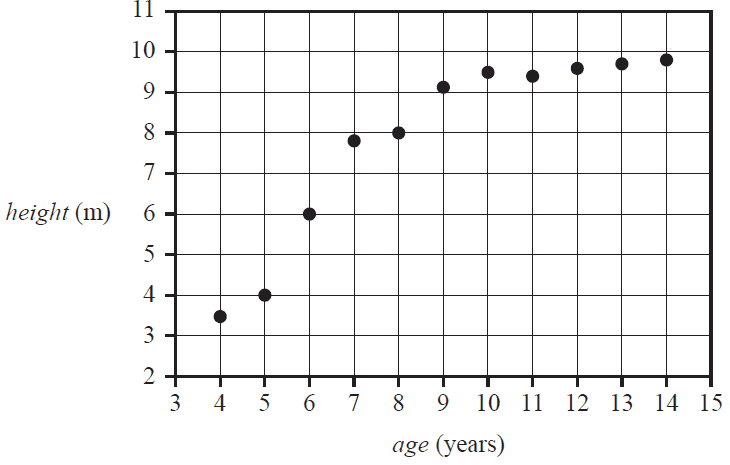
A reciprocal transformation applied to the variable age can be used to linearise the scatterplot.
With \( \frac{1}{\textit{age}} \) as the explanatory variable, the equation of the least squares line fitted to the linearised data is closest to
- A. \( \textit{height} = -13.04 + 40.22 \times \frac{1}{\textit{age}} \)
- B. \( \textit{height} = -10.74 + 8.30 \times \frac{1}{\textit{age}} \)
- C. \( \textit{height} = 2.14 + 0.63 \times \frac{1}{\textit{age}} \)
- D. \( \textit{height} = 13.04 - 40.22 \times \frac{1}{\textit{age}} \)
- E. \( \textit{height} = 16.56 - 22.47 \times \frac{1}{\textit{age}} \)
The scatterplot can also be linearised using a logarithm (base 10) transformation applied to the variable age. The equation of the least squares line is
\( \textit{height} = -3.8 + 12.6 \times \log_{10}(\textit{age}) \)
Using this equation, the age, in years, of a tree with a height of 8.52 m is closest to
- A. 7.9
- B. 8.9
- C. 9.1
- D. 9.5
- E. 9.9
Use the following information to answer Questions 13 and 14.
The following graph shows a selection of winning times, in seconds, for the women's 800 m track event from various athletic events worldwide. The graph shows one winning time for each calendar year from 2000 to 2022.
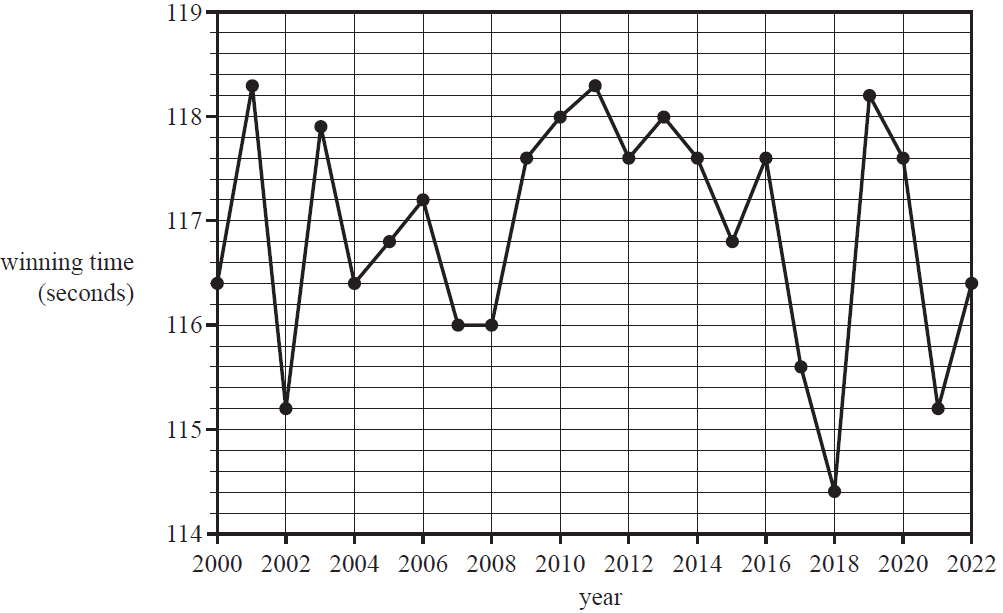
The time series is smoothed using seven-median smoothing. The smoothed value for the winning time in 2006, in seconds, is closest to
- A. 116.0
- B. 116.4
- C. 116.8
- D. 117.2
- E. 117.6
The median winning time, in seconds, for all the calendar years from 2000 to 2022 is closest to
- A. 116.8
- B. 117.2
- C. 117.6
- D. 118.0
- E. 118.3
The number of visitors to a public library each day for 10 consecutive days was recorded. These results are shown in the table below.
| Day number | 1 | 2 | 3 | 4 | 5 | 6 | 7 | 8 | 9 | 10 |
|---|---|---|---|---|---|---|---|---|---|---|
| Number of visitors | 337 | 317 | 313 | 335 | 322 | 335 | 322 | 338 | 302 | 349 |
The eight-mean smoothed number of visitors with centring for day number 6 is
- A. 323
- B. 324
- C. 325
- D. 326
- E. 327
The number of visitors each month to a zoo is seasonal. To correct the number of visitors in January for seasonality, the actual number of visitors, to the nearest percent, is increased by 35%.
The seasonal index for that month is closest to
- A. 0.61
- B. 0.65
- C. 0.69
- D. 0.74
- E. 0.77
Recursion and financial modelling
A sequence of numbers is generated by the recurrence relation shown below.
\( T_0 = 5, \quad T_{n+1} = -T_n \)
The value of \(T_2\) is
- A. –10
- B. –5
- C. 0
- D. 5
- E. 10
Use the following information to answer Questions 18 and 19.
Gus purchases a coffee machine for $15 000 and depreciates its value using the unit cost method. The rate of depreciation is $0.04 per cup of coffee made. A recurrence relation that models the year-to-year value \(G_n\), in dollars, of the machine is
\( G_0 = 15000, \quad G_{n+1} = G_n - 1314 \)
A rule for \(G_n\), the value of the machine after \(n\) years is
- A. \( G_n = 15000 - 0.04n \)
- B. \( G_n = 15000 + 0.04n \)
- C. \( G_n = 15000 - 1314n \)
- D. \( G_n = 1314 - 0.04n \)
- E. \( G_n = 1314 + 0.04n \)
The number of cups made by the machine per year is
- A. 1314
- B. 13 686
- C. 15 000
- D. 31 536
- E. 32 850
Use the following information to answer Questions 20 and 21.
For taxation purposes, Audrey depreciates the value of her $3000 computer over a four-year period. At the end of the four years, the value of the computer is $600.
If Audrey uses flat rate depreciation, the depreciation rate, per annum is
- A. 10%
- B. 15%
- C. 20%
- D. 25%
- E. 33%
If Audrey uses reducing balance depreciation, the depreciation rate, per annum is closest to
- A. 10%
- B. 15%
- C. 20%
- D. 25%
- E. 33%
Timmy took out a reducing balance loan of $500 000, with interest calculated monthly. The balance of the loan, in dollars, after \(n\) months, \(T_n\), can be modelled by the recurrence relation
\( T_0 = 500\,000, \quad T_{n+1} = 1.00325T_n - 2611.65 \)
A final repayment that will fully repay the loan to the nearest cent is
- A. $2605.65
- B. $2609.18
- C. $2611.65
- D. $2614.12
- E. $2615.81
Tavi took out a loan of $20 000, with interest compounding quarterly. She makes quarterly repayments of $653.65. The graph below represents the balance in dollars of Tavi's loan at the end of each quarter of the first year of the loan.
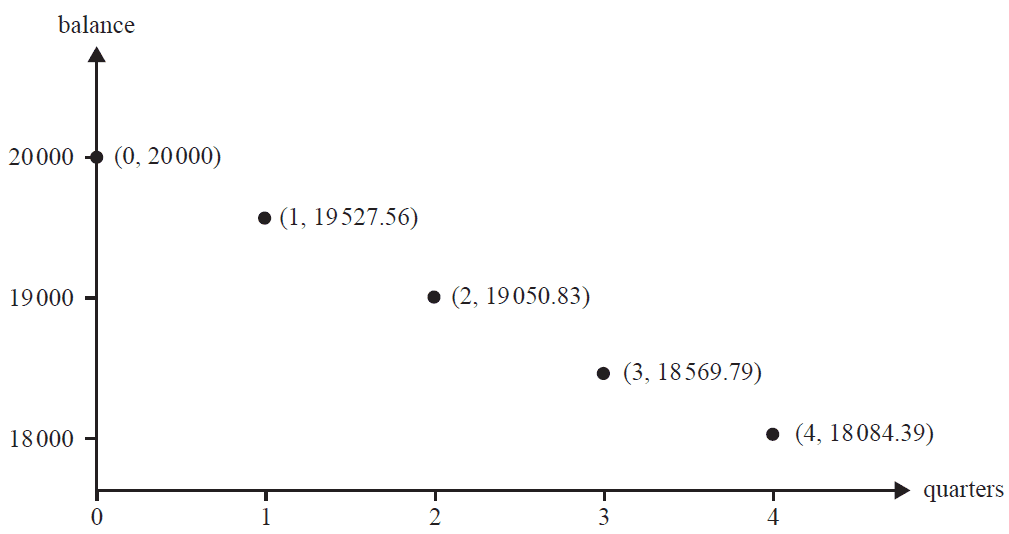
The effective interest rate for the first year of Tavi's loan is closest to
- A. 3.62%
- B. 3.65%
- C. 3.66%
- D. 3.67%
- E. 3.68%
The following recurrence relation models the value, \(P_n\), of a perpetuity after \(n\) time periods.
\( P_0 = a, \quad P_{n+1} = RP_n - d \)
The value of \(R\) can be found by calculating
- A. \( a + d \)
- B. \( \frac{a+d}{a} \)
- C. \( \frac{a+d}{d} \)
- D. \( 1 + \frac{a+d}{a} \)
- E. \( 1 + \frac{a+d}{d} \)
Matrices
The daily maximum temperature at a regional town for two weeks is displayed in the table below.
| Monday | Tuesday | Wednesday | Thursday | Friday | Saturday | Sunday | |
|---|---|---|---|---|---|---|---|
| Week 1 | 20 °C | 17 °C | 23 °C | 20 °C | 18 °C | 19 °C | 30 °C |
| Week 2 | 29 °C | 27 °C | 28 °C | 21 °C | 20 °C | 20 °C | 22 °C |
This information can also be represented by matrix \(M\), shown below.
\( M = \begin{bmatrix} 20 & 17 & 23 & 20 & 18 & 19 & 30 \\ 29 & 27 & 28 & 21 & 20 & 20 & 22 \end{bmatrix} \)
Element \(m_{21}\) indicates that
- A. the temperature was 29 °C on Monday in week 2.
- B. the temperature was 17 °C on Tuesday in week 1.
- C. the lowest temperature for these two weeks was 17 °C.
- D. the highest temperature for these two weeks was 29 °C.
- E. week 2 had a higher average maximum temperature than week 1.
Matrix \(P\) is a permutation matrix and matrix \(Q\) is a column matrix.
\( P = \begin{bmatrix} 1 & 0 & 0 & 0 & 0 \\ 0 & 0 & 1 & 0 & 0 \\ 0 & 0 & 0 & 1 & 0 \\ 0 & 1 & 0 & 0 & 0 \\ 0 & 0 & 0 & 0 & 1 \end{bmatrix} \quad Q = \begin{bmatrix} t \\ e \\ a \\ m \\ s \end{bmatrix} \)
When \(Q\) is multiplied by \(P\), which three letters change position?
- A. \(t, e, a\)
- B. \(e, a, m\)
- C. \(a, m, s\)
- D. \(m, s, t\)
- E. \(e, a, s\)
The following transition matrix, \(T\), models the movement of a species of bird around three different locations, \(M, N\) and \(O\) from one day to the next.
\[ T = \begin{array}{@{}c@{\,}c} & \begin{array}{@{}ccc@{}} M & N & O \end{array} \\ \begin{array}{c} M \\ N \\ O \end{array} & \left[ \begin{array}{ccc} \frac{1}{3} & 0 & \frac{9}{10} \\ \frac{1}{3} & 1 & \frac{1}{10} \\ \frac{1}{3} & 0 & 0 \end{array} \right] \end{array} \quad \textit{next day} \]Which one of the following statements best represents what will occur in the long term?
- A. No birds will remain at location M.
- B. No birds will remain at location N.
- C. All of the birds will end up at location M.
- D. All of the birds will end up at location O.
- E. An equal number of birds will be at all three locations.
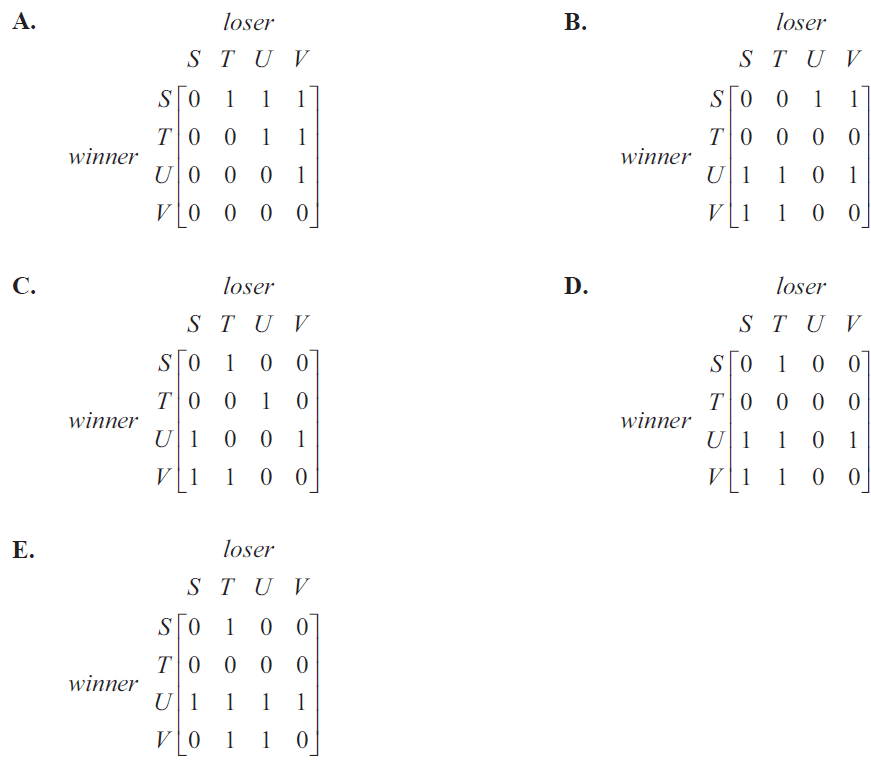
Four table tennis teams played in a round-robin tournament. Each team played each other team once and there were no draws. The overall ranking of each team at the end of the tournament, based on number of wins, is shown in the table below.
| First | Unicorns (U) |
| Second | Vampires (V) |
| Third | Scorpions (S) |
| Fourth | Titans (T) |
A dominance matrix can display the results of each game, where a ‘1’ in the matrix shows that the team named in that row defeated the team named in that column. The dominance matrix for this tournament could be
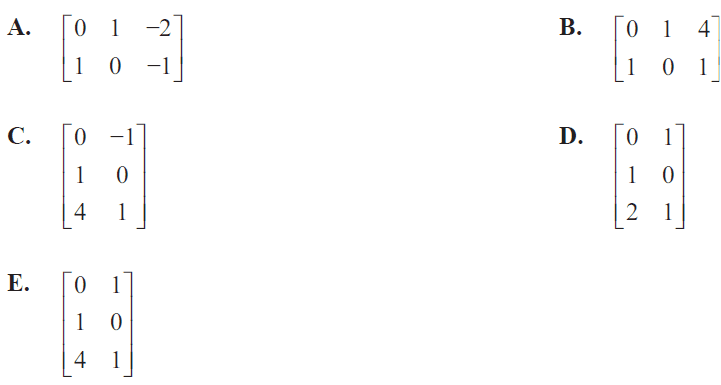
Matrix \(K\) is a 3 × 2 matrix. The elements of \(K\) are determined by the rule \(k_{ij} = (i - j)^2\). Matrix \(K\) is
How many of the following statements are true?
- All square matrices have an inverse.
- The inverse of a matrix could be the same as the transpose of that matrix.
- If the determinant of a matrix is equal to zero, then the inverse does not exist.
- It is possible to take the inverse of an identity matrix.
- A. 0
- B. 1
- C. 2
- D. 3
- E. 4
A species of bird has a life span of three years. The females in this species do not reproduce in their first year but produce an average of four female offspring in their second year, and three in their third year.
The Leslie matrix, \(L\), below is used to model the female population distribution of this species of bird.
\( L = \begin{bmatrix} 0 & 4 & 3 \\ 0.2 & 0 & 0 \\ 0 & 0.4 & 0 \end{bmatrix} \)
The element in the second row, first column states that on average 20% of this population will
- A. be female.
- B. never reproduce.
- C. survive into their second year.
- D. produce offspring in their first year.
- E. live for the entire lifespan of three years.
For one particular week in a school year, students at Phyllis Island Primary School can spend their lunch break at the playground (\(P\)), basketball courts (\(B\)), oval (\(O\)) or the library (\(L\)). Students stay at the same location for the entire lunch break. The transition diagram below shows the proportion of students who change location from one day to the next.
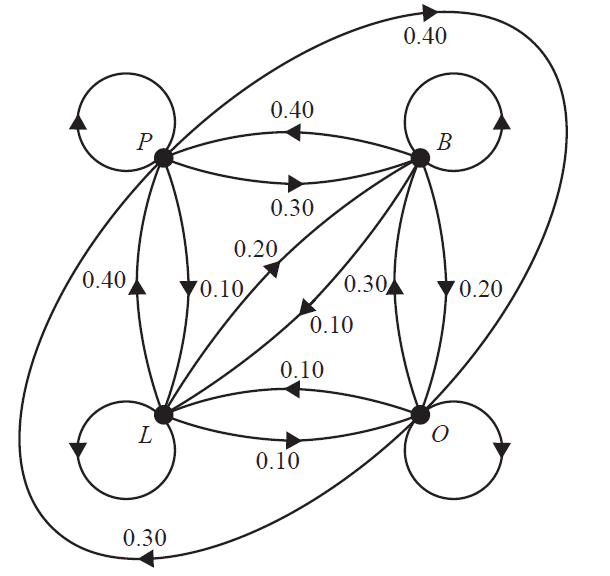
The transition diagram is incomplete. On the Monday, 150 students spent their lunch break at the playground, 50 students spent it at the basketball courts, 220 students spent it at the oval, and 40 students spent it in the library. Of the students expected to spend their lunch break on the oval on the Wednesday, the percentage of these students who also spent their lunch break on the oval on Tuesday is closest to
- A. 27%
- B. 30%
- C. 33%
- D. 47%
- E. 52%
Networks and decision mathematics
Consider the following graph.
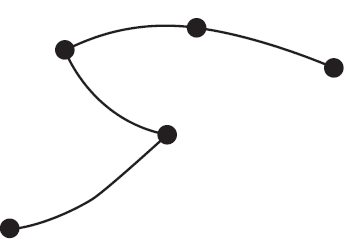
How many of the following five statements are true?
- The graph is a tree.
- The graph is connected.
- The graph contains a path.
- The graph contains a cycle.
- The sum of the degrees of the vertices is eight.
- A. 1
- B. 2
- C. 3
- D. 4
- E. 5
A bipartite graph is typically used to display which one of the following?
- A. the allocation of tasks on a construction site
- B. the path used to visit five different construction sites
- C. the total distance travelled between two construction sites
- D. the critical path of activities to be completed in a construction project
- E. the minimum length of cable required to connect six construction sites
Consider the weighted graph shown below.
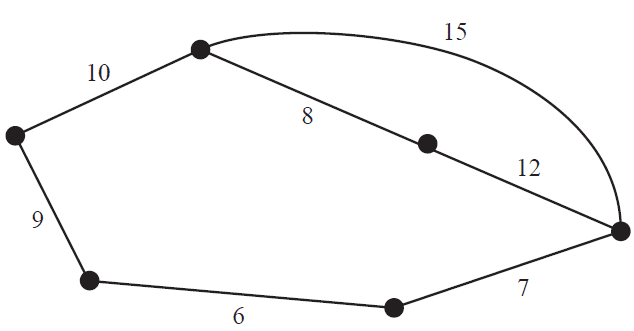
The weight of the minimum spanning tree is
- A. 30
- B. 32
- C. 40
- D. 42
- E. 52
Four employees, Anthea, Bob, Cho and Dario, are each assigned a different duty by their manager. The time taken for each employee to complete duties 1, 2, 3 and 4, in minutes, is shown in the table below.
| Duty 1 | Duty 2 | Duty 3 | Duty 4 | |
|---|---|---|---|---|
| Anthea | 8 | 7 | 7 | 8 |
| Bob | 10 | 8 | 10 | 9 |
| Cho | 8 | 9 | 7 | 10 |
| Dario | 7 | 7 | 8 | 9 |
The manager allocates the duties so as to minimise the total time taken to complete the four duties. The minimum total time taken to complete the four duties, in minutes, is
- A. 29
- B. 30
- C. 31
- D. 32
- E. 33
The adjacency matrix below represents a planar graph with five vertices.
\[ \begin{array}{@{}c@{\,}c} & \begin{array}{ccccc} J & K & L & M & N \end{array} \\ \begin{matrix} J \\ K \\ L \\ M \\ N \end{matrix} & \left[ \begin{array}{ccccc} 0 & 1 & 0 & 1 & 1 \\ 1 & 0 & 2 & 1 & 1 \\ 0 & 2 & 0 & 1 & 1 \\ 1 & 1 & 1 & 0 & 1 \\ 1 & 1 & 1 & 1 & 0 \end{array} \right] \end{array} \]The number of faces on the planar graph is
- A. 5
- B. 7
- C. 9
- D. 15
- E. 17
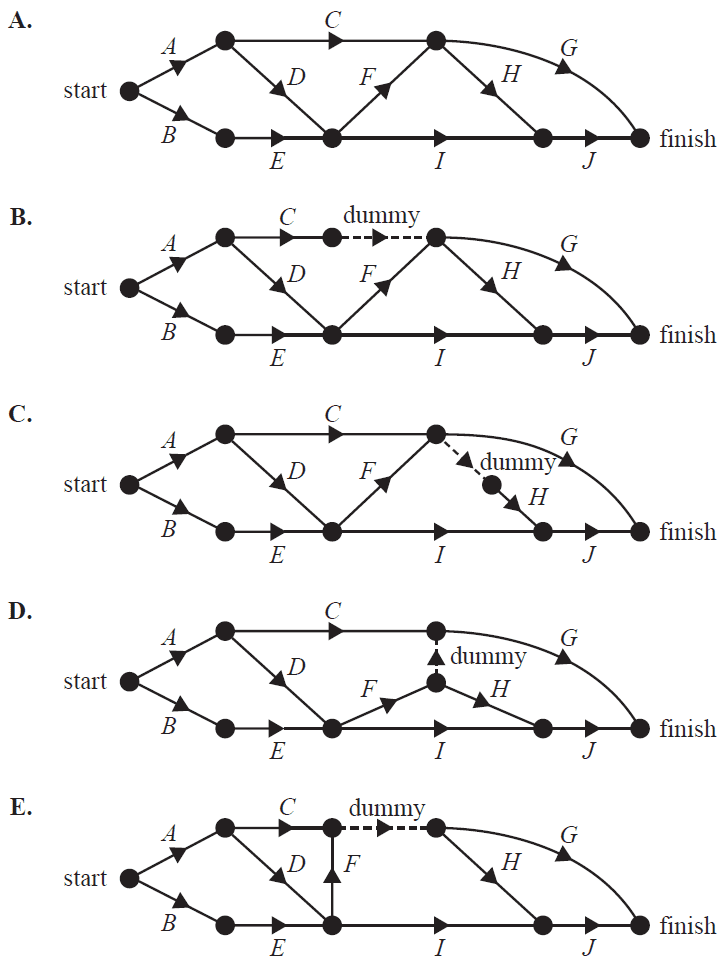
A particular building project has ten activities that must be completed. These activities and their immediate predecessor(s) are shown in the table below.
| Activity | Immediate predecessor(s) |
|---|---|
| A | – |
| B | – |
| C | A |
| D | A |
| E | B |
| F | D, E |
| G | C, F |
| H | F |
| I | D, E |
| J | H, I |
A directed graph that could represent this project is
Use the following information to answer Questions 39 and 40.
The network below shows the one-way paths between the entrance, \(A\), and the exit, \(H\), of a children's maze. The vertices represent the intersections of the one-way paths. The number on each edge is the maximum number of children who are allowed to travel along that path per minute.
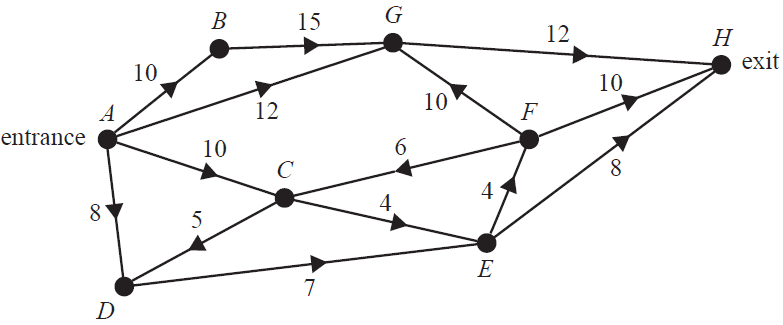
Cuts on this network are used to consider the possible flow of children through the maze. The capacity of the minimum cut would be
- A. 20
- B. 23
- C. 24
- D. 29
- E. 30
One path in the maze is to be changed. Which one of these five changes would lead to the largest increase in flow from entrance to exit?
- A. increasing the capacity of flow along the edge \(CE\) to 12
- B. increasing the capacity of flow along the edge \(FH\) to 14
- C. increasing the capacity of flow along the edge \(GH\) to 16
- D. reversing the direction of flow along the edge \(CF\)
- E. reversing the direction of flow along the edge \(GF\)
End of Multiple-Choice Question Book
VCE is a registered trademark of the VCAA. The VCAA does not endorse or make any warranties regarding this study resource. Past VCE exams and related content can be accessed directly at www.vcaa.vic.edu.au
