2022 VCE Further Maths Exam 2
This is the full VCE Further Maths Exam with worked solutions. You can also try Mini-Tests, which are official VCAA exams split into short tests you can do anytime.
Number of marks: 60
Reading time: 15 minutes
Writing time: 1.5 hours
Instructions
• Answer all questions in pencil on your Multiple-Choice Answer Sheet.
• Choose the response that is correct for the question.
• A correct answer scores 1; an incorrect answer scores 0.
• Marks will not be deducted for incorrect answers.
• No marks will be given if more than one answer is completed for any question.
• Unless otherwise indicated, the diagrams in this book are not drawn to scale.
SECTION A – Core
Data analysis
The back-to-back stem plot below displays the distribution of daily maximum wind speed, in kilometres per hour, recorded at a weather station in April and November 2021.
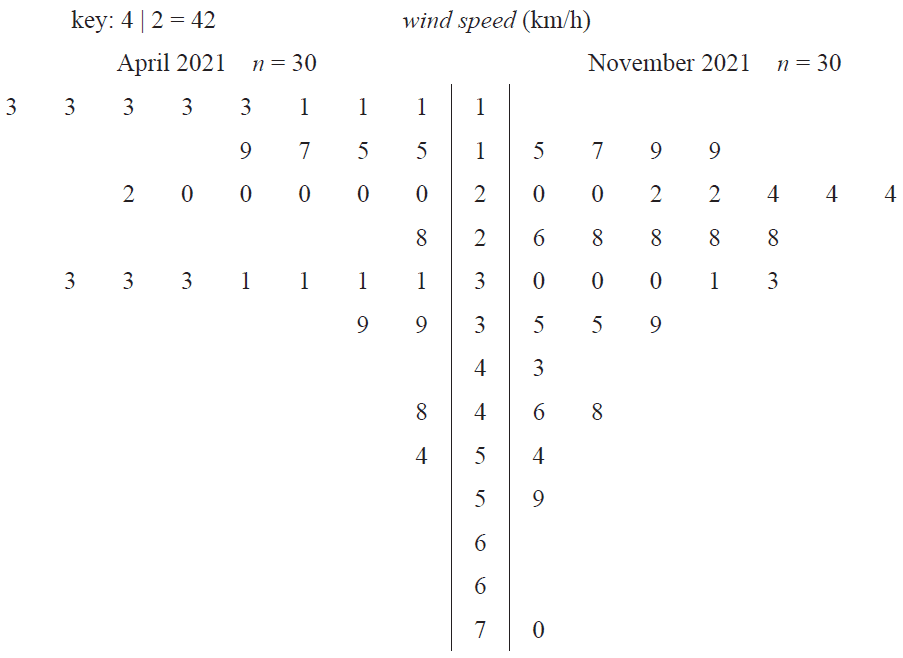
a. For April 2021, determine
i. the median wind speed, in kilometres per hour 1 mark
ii. the percentage of days for which the wind speed was less than 25 km/h. 1 mark
b. The five-number summary for wind speed in November 2021 is given below.
| Minimum | First quartile (\(Q_1\)) |
Median | Third quartile (\(Q_3\)) |
Maximum |
| 15 | 22 | 28 | 35 | 70 |
The wind speeds for November are to be used to construct a boxplot.
Show that the wind speeds of 59 km/h and 70 km/h would appear as outliers in this boxplot. 2 marks
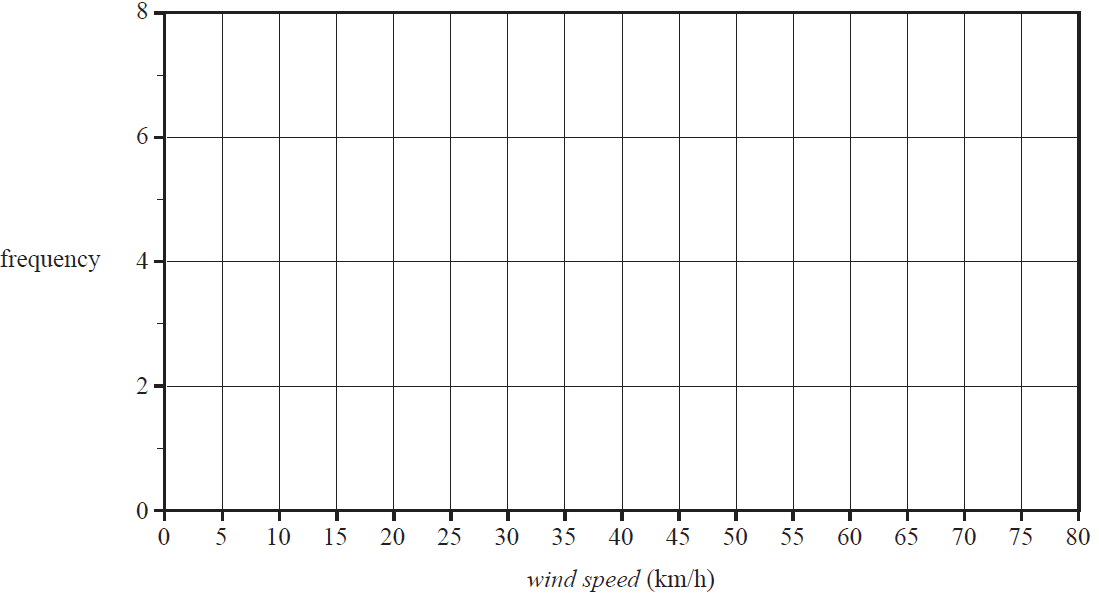
c. On the grid below, use the data from the stem plot on page 2 to construct a histogram that displays the distribution of wind speed for November 2021. Use class intervals of widths of five, starting at 15 km/h. 2 marks
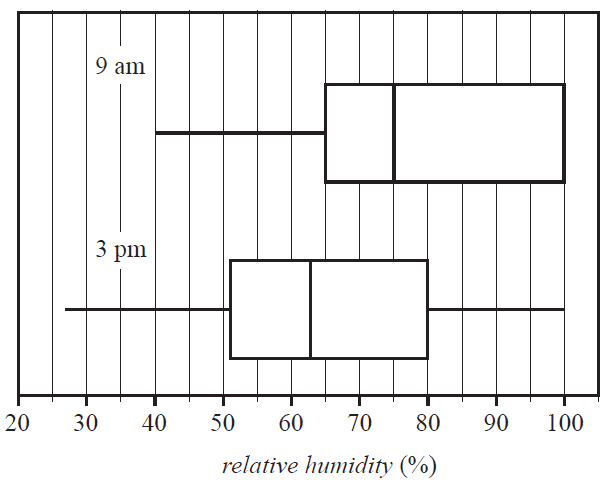
The boxplots below show the distribution of relative humidity (%) at 9 am and 3 pm at a weather station for the 30 days of November 2021.
a.
i. Determine whether the relative humidity in November is more variable at 9 am or 3 pm. Give the approximate values of both the interquartile ranges in your answer. 1 mark
ii. Write down the percentage of days in November for which the relative humidity at 3 pm was less than 80%. 1 mark
iii. Complete the five-number summaries for the distributions of relative humidity at 9 am and 3 pm by writing the missing values in the table below. 1 mark
| Time | Minimum | First quartile (\(Q_1\)) |
Median | Third quartile (\(Q_3\)) |
Maximum |
|---|---|---|---|---|---|
| 9 am | 65 | 75 | |||
| 3 pm | 27 | 51 | 63 |
b. Do the boxplots support the contention that there is an association between relative humidity and time of day? Refer to the values of an appropriate statistic in your answer. 2 marks
Table 1 displays data for seven weather-related variables for the first eight days of December 2021.
Table 1
| Day number | Minimum temperature (°C) | Maximum temperature (°C) | Rainfall (mm) | Maximum wind speed (km/h) | Direction of maximum wind speed | Temperature 9 am (°C) |
|---|---|---|---|---|---|---|
| 1 | 19.4 | 28.3 | 0 | 35 | ENE | 22.9 |
| 2 | 17.6 | 29.7 | 1.0 | 35 | WSW | 24.2 |
| 3 | 7.6 | 16.5 | 11.6 | 26 | WSW | 12.7 |
| 4 | 7.5 | 15.9 | 0 | 30 | WSW | 10.9 |
| 5 | 5.7 | 19.0 | 0.2 | 24 | ESE | 10.4 |
| 6 | 9.9 | 23.8 | 0 | 39 | NE | 17.8 |
| 7 | 11.0 | 11.9 | 0 | 22 | SSW | 11.7 |
| 8 | 6.5 | 14.2 | 0 | 28 | ESE | 9.5 |
a. Write down
i. the number of numerical variables in Table 1 1 mark
ii. the median rainfall, in millimetres, for the eight-day period. 1 mark
b. A least squares line is used to model the association between daily maximum temperature and daily minimum temperature.
With unrounded values for the intercept and slope, the equation of the least squares line is
maximum temperature = 9.235946... + 1.002493... × minimum temperature
Round the intercept and slope to four significant figures. Write your answers in the boxes provided. 1 mark
maximum temperature = + × minimum temperature
c. Calculate the coefficient of determination for the association between the daily maximum temperature and the daily minimum temperature. Write down its value as a percentage, rounded to one decimal place. 1 mark
coefficient of determination = %
The scatterplot below shows the relative humidity (%) at 9 am plotted against the temperature (°C) at 9 am for the 30 days of November 2021.
A least squares line has been fitted to the scatterplot.
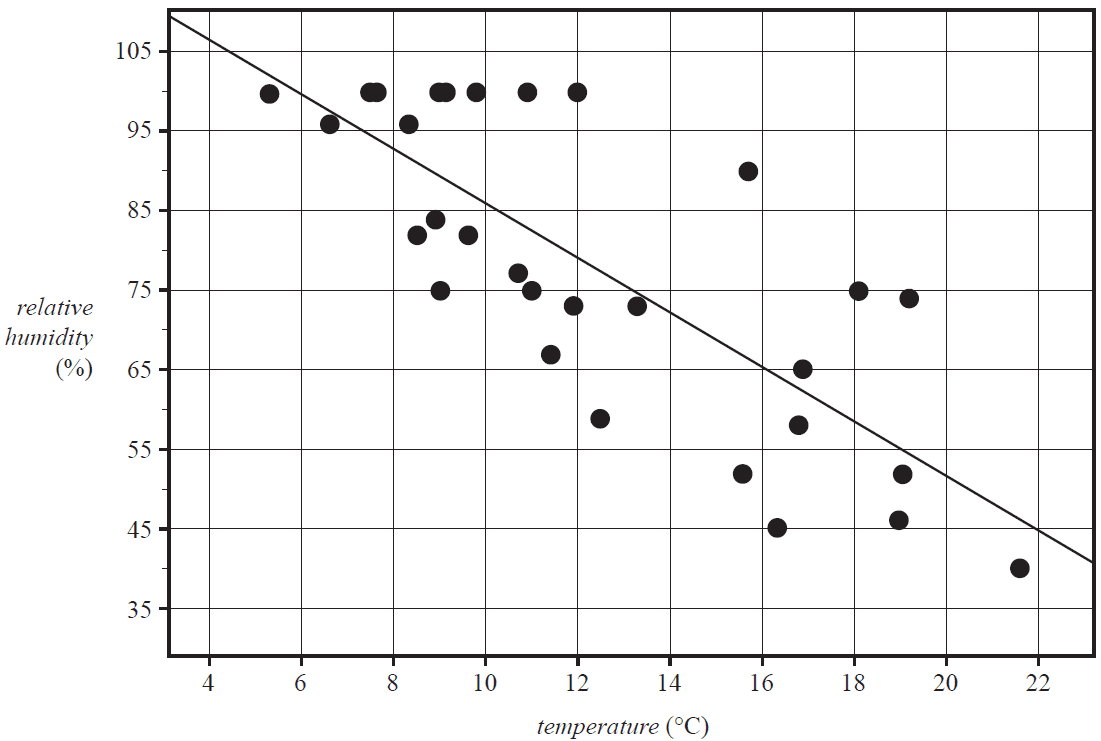
The equation of the least squares line is
relative humidity = 120.1 – 3.417 × temperature
The coefficient of determination is 0.6073
a. The equation of the least squares line can be used to predict relative humidity at 9 am from the temperature at 9 am.
Name the explanatory variable. 1 mark
b. Describe the association between relative humidity and temperature in terms of strength and direction. 1 mark
c. Interpret the slope of the least squares line in terms of the variables relative humidity and temperature. 1 mark
d. On the day when the temperature at 9 am was 16.3 °C, the relative humidity was 45.0%.
The following least squares line can be used to predict the relative humidity at 9 am on this day.
relative humidity = 120.1 – 3.417 × temperature
Calculate the residual value.
Round your answer to one decimal place. 2 marks
The time series plot below shows the monthly rainfall, in millimetres, recorded at a weather station over a 36-month period.
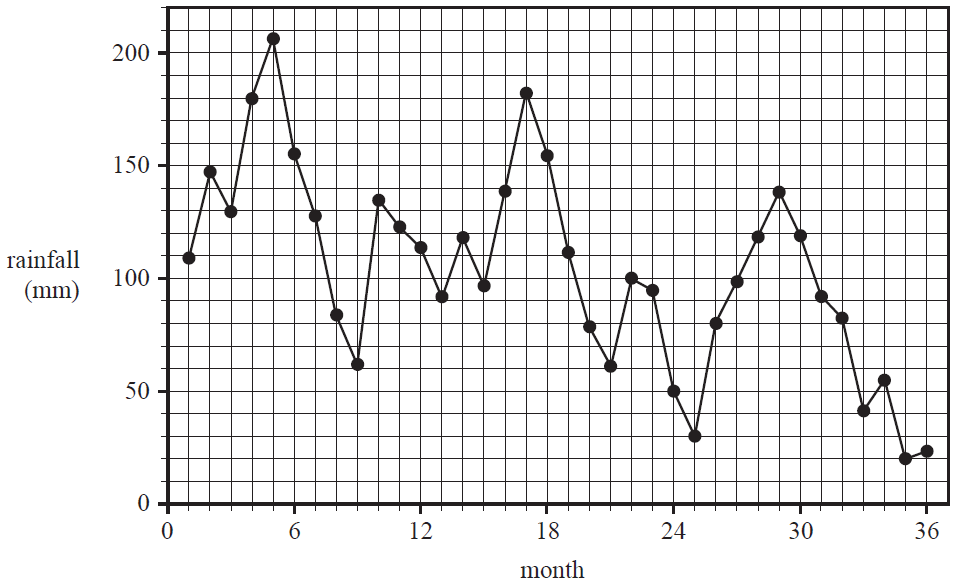
a. The time series plot contains irregular fluctuations.
Give two other descriptions of the pattern in this time series plot. 1 mark
b. Write down the value of the five-median smoothed rainfall for month 20. 1 mark
c. The data for months 1 to 12 of the time series plot is shown in the table below.
| Month number | 1 | 2 | 3 | 4 | 5 | 6 | 7 | 8 | 9 | 10 | 11 | 12 |
| Rainfall (mm) | 109.0 | 147.2 | 129.6 | 179.6 | 206.2 | 155.2 | 127.6 | 83.8 | 61.8 | 134.6 | 122.8 | 113.6 |
i. Calculate the nine-mean smoothed rainfall for month 7.
Round your answer to one decimal place. 1 mark
ii. What would be the number of points in the smoothed plot if nine-mean smoothing is applied for the full 36-month period? 1 mark
Recursion and financial modelling
Pina owns workplace equipment, which she depreciates in value using flat rate depreciation.
The value of the equipment, in dollars, after \(n\) years, \(V_n\), can be determined using the rule
\(V_n = 200\,000 - 12\,500n\)
a. Determine \(V_1\), the value of the equipment after one year. 1 mark
b. After how many years will the equipment first have a value of zero? 1 mark
c. The value of the equipment, in dollars, after \(n\) years, \(V_n\), can also be modelled by a recurrence relation.
Write this recurrence relation in terms of \(V_0\), \(V_{n+1}\) and \(V_n\). 1 mark
d. Using Pina's depreciation model, the value of the equipment decreases by a fixed percentage of its original value each year.
Alternatively, the value of the equipment could have been depreciated by a fixed percentage of its current value each year.
What name is given to this type of depreciation? 1 mark
Pina invests $540 000 in an annuity paying 3% interest per annum, compounding monthly. Her annuity will provide a monthly payment of $5214.28 for 10 years.
Four lines of the amortisation table for Pina's annuity are shown below.
The information for payment number 3 is missing.
| Payment number | Payment ($) | Interest ($) | Principal reduction ($) | Balance ($) |
|---|---|---|---|---|
| 0 | 0.00 | 0.00 | 0.00 | 540 000.00 |
| 1 | 5214.28 | 1350.00 | 3864.28 | 536 135.72 |
| 2 | 5214.28 | 1340.34 | 3873.94 | 532 261.78 |
| 3 |
a. What is the value of payment number 3? 1 mark
b. Calculate the interest associated with payment number 3.
Round your answer to the nearest cent. 1 mark
c. Let \(P_n\) be the balance, in dollars, of Pina's annuity after \(n\) months.
Write a recurrence relation, in terms of \(P_0\), \(P_{n+1}\) and \(P_n\), that can model this balance from month to month. 1 mark
d. If Pina had invested the original $540 000 annuity as a simple perpetuity, what monthly payment would she have drawn? 1 mark
To purchase additional workplace equipment, Pina took out a reducing balance loan of $580 000 with interest calculated monthly.
The balance of the loan, in dollars, after \(n\) months, \(L_n\), can be modelled by the recurrence relation
\(L_0 = 580\,000, \quad L_{n+1} = 1.002L_n - 3045.26\)
a. Showing recursive calculations, determine the balance of the loan after two months.
Round your answer to the nearest cent. 1 mark
b. Determine the annual compound interest rate for this loan. 1 mark
c. The final repayment that is required to fully pay off the loan is smaller than all other repayments by an amount less than one dollar.
Determine this small amount in dollars, rounded to the nearest cent. 1 mark
d. The original recurrence relation
\(L_0 = 580\,000, \quad L_{n+1} = 1.002L_n - 3045.26\)
models the loan being fully repaid in a certain number of years.
Using a different multiplication factor (other than 1.002) the loan would be fully repaid one year sooner.
Determine this multiplication factor.
Round your answer to four decimal places. 1 mark
SECTION B – Modules
Module 1 – Matrices
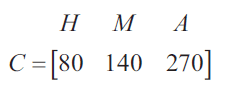
Matrix \(C\) shows the nightly cost, in dollars, of three types of family accommodation at a ski resort: hostel (\(H\)), motel (\(M\)) and apartment (\(A\)).
The Dwyer family is planning to stay at the ski resort for five nights.
a. Complete the matrix equation below to show the cost of staying at each type of accommodation for five nights. 1 mark

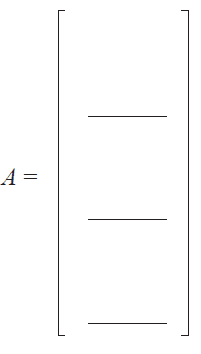
b. The family has decided to stay at the motel for two nights and in an apartment for three nights.
Write down the column matrix \(A\) for which the product matrix \(CA\) gives the total accommodation cost for the five nights. 1 mark
Visitors can hire skis and snowboards at the ski resort.
The following system of simultaneous linear equations represents two school groups who have hired skis and snowboards, where \(x\) represents the daily cost, in dollars, of hiring one set of skis and \(y\) represents the daily cost, in dollars, of hiring one snowboard.
\(20x + 40y = 3700\)
\(30x + 50y = 4900\)
a. Write the equations in matrix form by completing the following template. 1 mark
\[ \begin{bmatrix} 20 & 40 \\ 30 & 50 \end{bmatrix} \begin{bmatrix} \vphantom{0} \\ \vphantom{0} \end{bmatrix} = \begin{bmatrix} \vphantom{0} \\ \vphantom{0} \end{bmatrix} \]
b.
i. Show that the determinant of the matrix \( \begin{bmatrix} 20 & 40 \\ 30 & 50 \end{bmatrix} \) is -200. 1 mark
ii. Interpret the value of this determinant in relation to the solution of the simultaneous linear equations above. 1 mark
c. Complete the matrix below, showing the daily cost of hiring one set of skis and one snowboard. 1 mark
\[ \begin{bmatrix} x \\ y \end{bmatrix} = \begin{bmatrix} \vphantom{0} \\ \vphantom{0} \end{bmatrix} \]
Students from a nearby school spend one school term skiing at the resort. One year, the school term begins on 16 July and ends on 22 September.
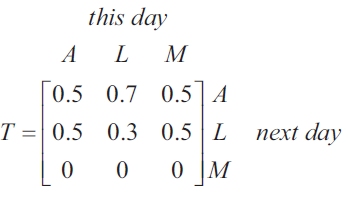
The resort has three different types of ski runs, each of which is classified as beginner (\(B\)), intermediate (\(I\)) or advanced (\(A\)).
Each day, the students use one of the three types of ski runs.
Matrix \(T\) below contains the proportion of students who are expected to change their choice of ski run from day to day.
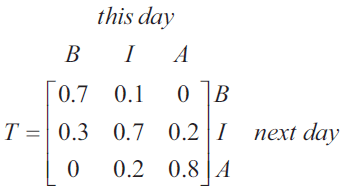
Let \(S_n\) be the matrix that shows the number of students who choose each type of ski run \(n\) days after 16 July.
Matrix \(S_0\) below shows the number of skiers who chose each type of ski run on 16 July.
\[ S_0 = \begin{bmatrix} 210 \\ 190 \\ 80 \end{bmatrix} \begin{matrix} B \\ I \\ A \end{matrix} \]
a. How many skiers are expected to choose the same ski run on 17 July? 1 mark
b. Consider the skiers who are expected to choose the advanced ski run on 17 July.
What percentage of these skiers also chose the advanced ski run on 16 July?
Round your answer to the nearest whole number. 1 mark
c. What is the maximum number of students expected to ski the intermediate ski run on any one day?
Round your answer to the nearest whole number. 1 mark
At the end of the school term, the students vote for who they want to captain the ski team for the next ski season.
Three students – Ali, Lee and Max – have been nominated for captain.
Seven days before the end of the school term, the students were asked who they planned to vote for.
The following table shows each candidate and the number of students who plan to vote for each candidate at the start of the seven days.
| Candidate | Number of people who plan to vote for the candidate |
|---|---|
| Ali | 160 |
| Lee | 140 |
| Max | 180 |
Each day all students are asked who they plan to vote for.
It is expected that students may change the candidate they plan to vote for each day over the seven days as follows. Some percentages are missing.
- 40% of students who plan to vote for Ali one day will plan to vote for Ali the next day.
- 30% of students who plan to vote for Ali one day will plan to vote for Lee the next day.
- 50% of students who plan to vote for Lee one day will plan to vote for Lee the next day.
- 30% of students who plan to vote for Lee one day will plan to vote for Max the next day.
- 50% of students who plan to vote for Max one day will plan to vote for Max the next day.
- 20% of students who plan to vote for Max one day will plan to vote for Lee the next day.
a. How many students plan to vote for Ali after one day? 1 mark
b. Max decides to withdraw his nomination after one day.
Matrix \(T\) below shows the proportion of students who change their preferred candidate from one day to the next for the remaining six days after Max withdraws his nomination.
At the end of the seven days, who is expected to become captain of the ski team and how many votes will this person receive?
Round your answer to the nearest whole number. 2 marks
Module 2 – Networks and decision mathematics
Joe owns a holiday park with seven cabins.
The diagram below shows a network of roads in the holiday park.
Joe's office is labelled as a vertex on the network. The other vertices – \(A, B, C, D, E, F\) and \(G\) – represent the cabins.
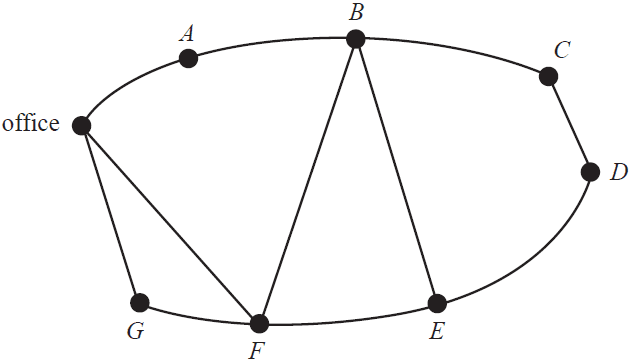
In the morning, Joe leaves his office and visits each cabin once only before returning to the office.
a. Write down a route that Joe could follow. 1 mark
b. Later in the day, Joe will leave his office and travel along each road once only to check the road conditions.
i. Which vertex will Joe finish on? 1 mark
ii. What is the mathematical term for this route? 1 mark
Joe plans to add a new cabin to the holiday park.
This project requires 10 activities to be completed.
The network below shows these 10 activities and their completion times in weeks.
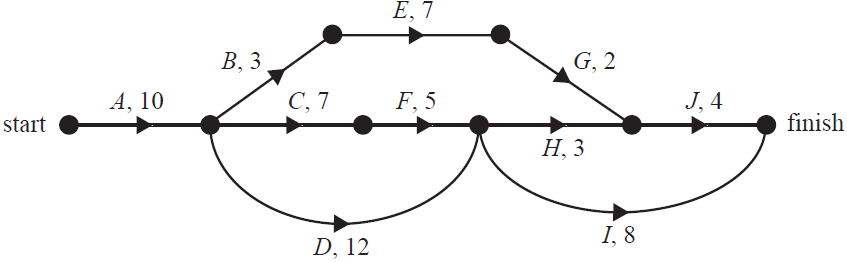
a. How many of these activities have two immediate predecessors? 1 mark
b. What is the minimum completion time, in weeks, for this project? 1 mark
c. It is possible to reduce the completion time of two activities.
One activity can have its completion time decreased by two weeks and another activity can have its completion time decreased by one week.
These two changes result in the minimum completion time being reduced by three weeks.
Complete the table below, showing the two activities that could have their completion times reduced and the reduction in individual activity completion time that would achieve the three-week reduction. 1 mark
| Activity | Reduction in completion time (1 week or 2 weeks) |
|---|---|
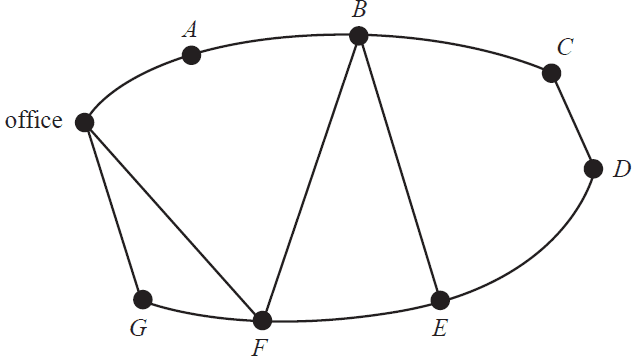
d. The holiday park has had some changes to its roads to accommodate the new cabin.
The adjacency matrix below shows road connections between the office and each cabin. The new cabin, \(H\), is included in the matrix.
\[ \begin{array}{c@{}c} & \begin{array}{@{}ccccccccc@{}} \text{office} & A & B & C & D & E & F & G & H \end{array} \\ \begin{matrix} \text{office} \\ A \\ B \\ C \\ D \\ E \\ F \\ G \\ H \end{matrix} & \left[ \begin{array}{@{}ccccccccc@{}} 0 & 1 & 0 & 0 & 0 & 0 & 1 & 1 & 0 \\ 1 & 0 & 1 & 0 & 0 & 0 & 0 & 0 & 0 \\ 0 & 1 & 0 & 1 & 0 & 1 & 1 & 0 & 0 \\ 0 & 0 & 1 & 0 & 1 & 0 & 0 & 0 & 0 \\ 0 & 0 & 0 & 1 & 0 & 1 & 0 & 0 & 1 \\ 0 & 0 & 1 & 0 & 1 & 0 & 1 & 0 & 1 \\ 1 & 0 & 1 & 0 & 0 & 1 & 0 & 1 & 0 \\ 1 & 0 & 0 & 0 & 0 & 0 & 1 & 0 & 0 \\ 0 & 0 & 0 & 0 & 1 & 1 & 0 & 0 & 1 \end{array} \right] \end{array} \]
On the diagram below, add the new cabin, \(H\), and any additional roads to the network. 2 marks
A series of pipelines is installed to allow for the flow of stormwater from the holiday park.
The capacity of these pipes, in litres per minute, is shown in the directed network below.
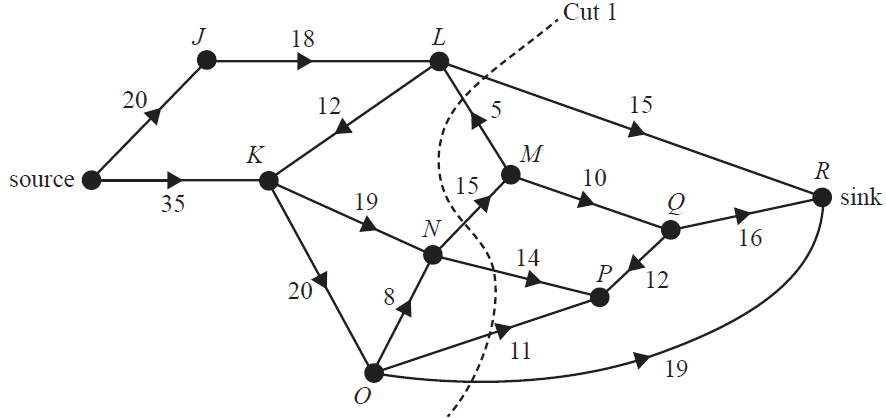
When considering the possible flow of stormwater through this network, many different cuts can be made.
a. Determine the capacity of Cut 1, shown above. 1 mark
b. What is the maximum flow of stormwater, in litres per minute, from the source to the sink? 1 mark
Joe would like to increase the maximum flow through this network.
The maximum flow through this network may be increased either by reversing the direction of flow through one pipe or by increasing the capacity of one pipe.
c. The direction of flow is reversed through one pipe.
Complete the following sentence by filling in the boxes provided. 1 mark
The pipe that should have its flow reversed to cause the largest increase in flow from source to sink is the pipe that runs from vertex to vertex .
d. The capacity of one pipe is increased.
Complete the following sentences by filling in the boxes provided. 1 mark
The pipe that should have its capacity increased to cause the largest increase in flow from source to sink is the pipe that runs from vertex to vertex . Its new capacity, in litres per minute, should be at least .
Module 3 – Geometry and measurement
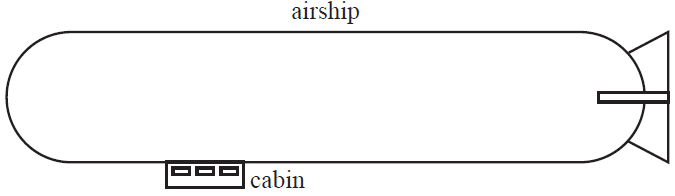
Airships are a form of aircraft.
An airship has a cabin in which the pilots and passengers travel, and cargo is carried. This is shown in the simplified diagram below.
The floor of the cabin is a rectangle, with a length of 9 m and a width of 2.5 m.
The cockpit occupies an area 1.5 m by 2.5 m at the front of the cabin. This is shown shaded in the diagram below.
The remainder of the floor space is available for passengers and cargo.
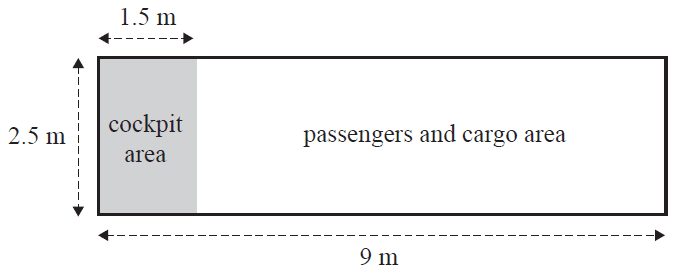
a. Calculate the area available for passengers and cargo, in square metres. 1 mark
The cabin is a rectangular prism 9 m by 3 m by 2.5 m. This is shown in the diagram below.
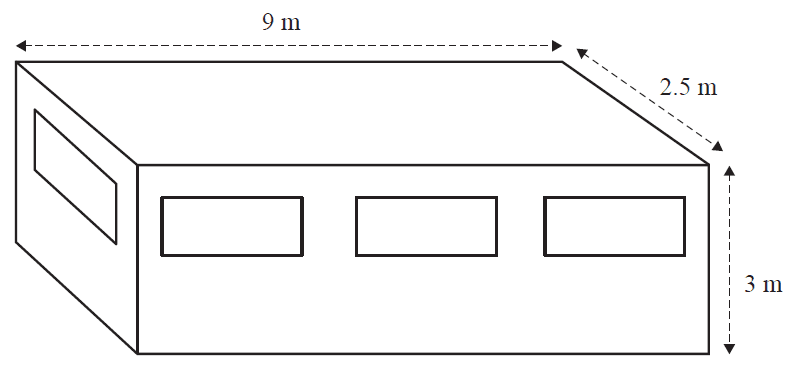
b. Calculate the volume of the cabin, in cubic metres. 1 mark
c. There are eight windows in the cabin – one at each end and three along each side.
These eight windows are identical rectangles.
The height of each window is 0.85 m.
The total area of the eight windows is 14.62 m².
Calculate the length of each window, in metres. 1 mark
d. A cable connects the airship nose to a large concrete block on level ground.
When the 60 m length of cable is pulled tight, the nose of the airship is 55 m horizontally from the concrete block. This is shown in the diagram below.
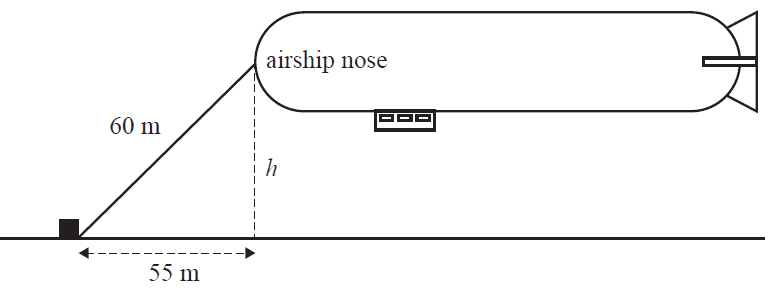
Calculate the height, \(h\), of the airship nose from the ground.
Round your answer to the nearest metre. 1 mark
e. The airship body is modelled on a cylinder with a hemisphere at each end.
The cylinder has a length of 60 m and a diameter of 15 m. This is shown in the diagram below.
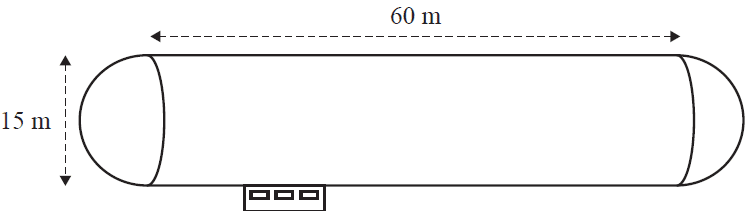
i. Determine the total length, in metres, of the airship body. 1 mark
ii. The outside of the airship body is covered in fabric, except where the entire roof of the cabin is attached to the airship frame. This cabin-roof attachment means that 22.6 m² less fabric is required to cover the airship body.
Calculate the total area of fabric required.
Round your answer to the nearest square metre. 1 mark
a. At Brisbane Airport, an airship waited for survey equipment to arrive on a flight from Frankfurt, Germany.
The flight from Frankfurt to Brisbane took 23 hours.
That month, the time difference between Frankfurt (50° N, 9° E) and Brisbane (27° S, 153° E) was nine hours.
At what time and on what weekday did the flight leave Frankfurt if it arrived in Brisbane at 6.30 am on Thursday? 1 mark
b. The equipment was used to survey a site in South Australia.
The airship flew from Brisbane (27° S, 153° E) to the survey site (27° S, 141° E) along a small circle. Assume that the radius of Earth is 6400 km.
i. Show that the radius of the small circle was 5702 km, rounded to the nearest kilometre. 1 mark
ii. Calculate the distance that the airship flew from Brisbane (27° S, 153° E) to the survey site (27° S, 141° E).
Round your answer to the nearest kilometre. 1 mark
c. The survey was done at night.
Two spotlights, attached to the airship cabin base 8 m apart, were set at the same angle (\(\theta\)) so that their beams formed a single spot when the cabin base was 15 m above ground level. This is shown in the diagram below.
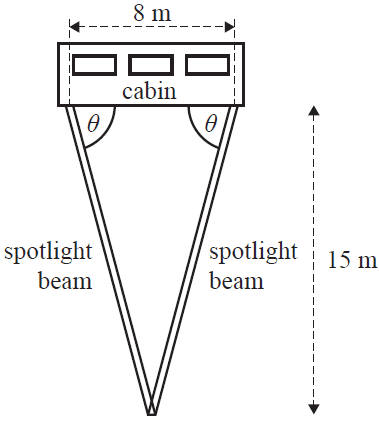
Calculate the value of \(\theta\), rounded to the nearest degree. 1 mark
a. After completing the survey, the airship flew south from the survey site (27° S, 141° E) to Mount Gambier (38° S, 141° E) along the 141° E meridian.
Assume that the radius of Earth is 6400 km.
Calculate the distance that the airship flew, from the survey site to Mount Gambier.
Round your answer to the nearest kilometre. 1 mark
b. In order to unload the survey equipment, the airship was lowered so that the cabin base was at ground level.
A person was waiting on the ground. Their eye level was 1.6 m above ground and the top of a 2 m tall vertical post intersected their line of sight with the airship nose.
They were standing 2.0 m from the post.
The airship nose was 10.5 m above ground level.
This is shown in the diagram below.
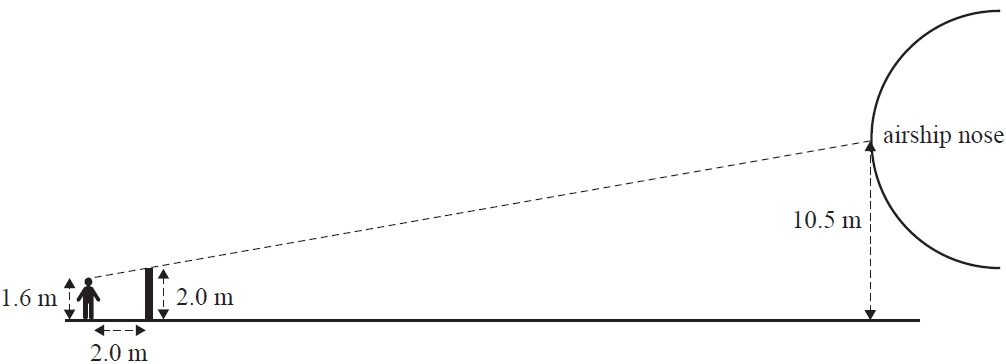
Calculate the horizontal distance between the person and the airship nose, in metres. 1 mark
Module 4 – Graphs and relations
A bed company makes and sells single-size bed frames.
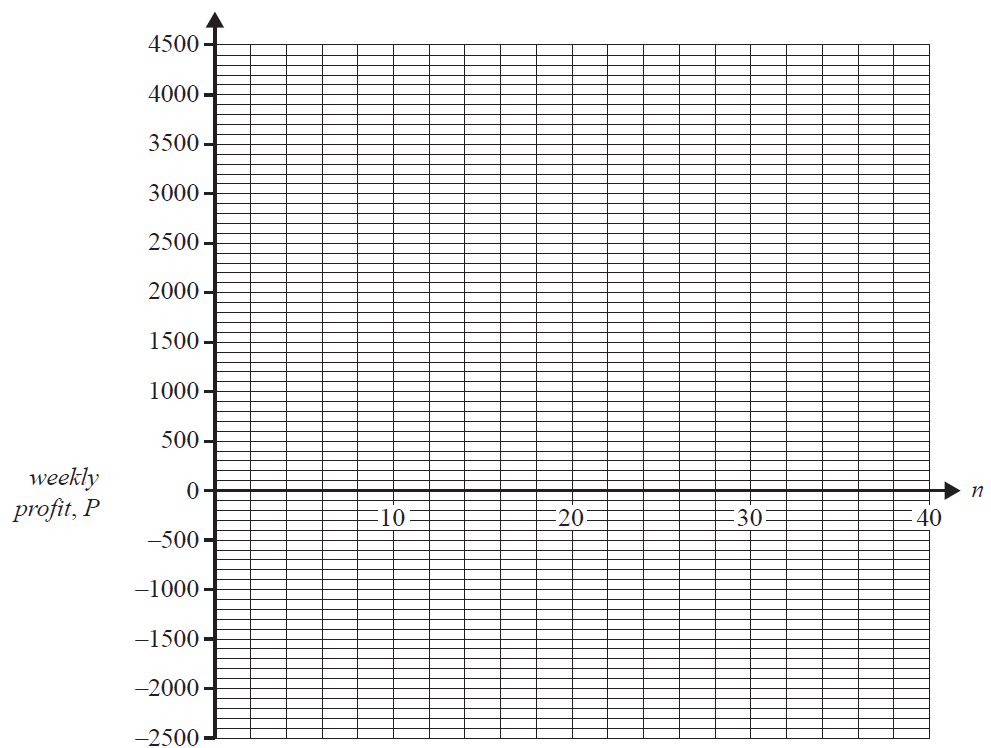
The weekly profit, \(P\), in dollars, from selling \(n\) single-size bed frames is given by
\(P = 130n - 1560\)
a. Calculate the weekly profit, in dollars, if 25 single-size bed frames are sold. 1 mark
b. Find the number of single-size bed frames that need to be sold each week in order to break even. 1 mark
c. Sketch the weekly profit, \(P\), of selling \(n\) single-size bed frames for \(0 \le n \le 40\) on the graph below. 1 mark
d. The single-size bed frames sell for $350 each.
An equation for the weekly cost, \(C\), to produce \(n\) single-size bed frames can be determined.
Complete this equation by filling in the boxes below. 1 mark
\(C = \) \( \times n + \)
The bed company also sells complete beds in its showroom.
The bed company purchases mattresses from an outside source.
Single-size mattresses cost $480 and queen-size mattresses cost $1200.
a. How much will it cost, in dollars, to purchase 10 single-size mattresses and seven queen-size mattresses? 1 mark
b. An order for single-size mattresses and queen-size mattresses was placed recently.
These 25 mattresses cost a total of $18 480.
How many queen-size mattresses were ordered? 1 mark
c. The bed company has a deal with its supplier. The total cost, \(T\), of purchasing \(s\) single-size mattresses is given by
\[ T = \begin{cases} 480s & 0 < s \le 20 \\ 420s + p & s \ge 20 \end{cases} \]
Determine the value of \(p\). 1 mark
d. The springs used in the mattresses will compress by 32 mm when a force of 500 N is applied to them.
The equation \(F = kx\), where \(k\) is the spring constant, is used to model the relationship between the force applied, \(F\), in newtons, and the distance the spring is compressed, \(x\), in millimetres.
Find the distance, in millimetres, the springs will compress if a force of 800 N is applied to them. 1 mark
The bed company manufactures queen-size and king-size bed frames.
- Each queen-size bed frame takes three hours to make and one hour to paint.
- Each king-size bed frame takes four hours to make and two hours to paint.
- Let \(x\) represent the number of queen-size bed frames produced each week.
- Let \(y\) represent the number of king-size bed frames produced each week.
There are certain constraints that must be met each week. These constraints are represented by Inequalities 1 to 4 below.
Inequality 1 \(x \ge 20\)
Inequality 2 \(y \ge 10\)
Inequality 3 \(3x + 4y \le 190\) (framing department)
Inequality 4 \(x + 2y \le 76\) (painting department)
a. What is the minimum number of king-size bed frames produced each week? 1 mark
The graph below shows the feasible region (shaded) that satisfies Inequalities 1 to 4.
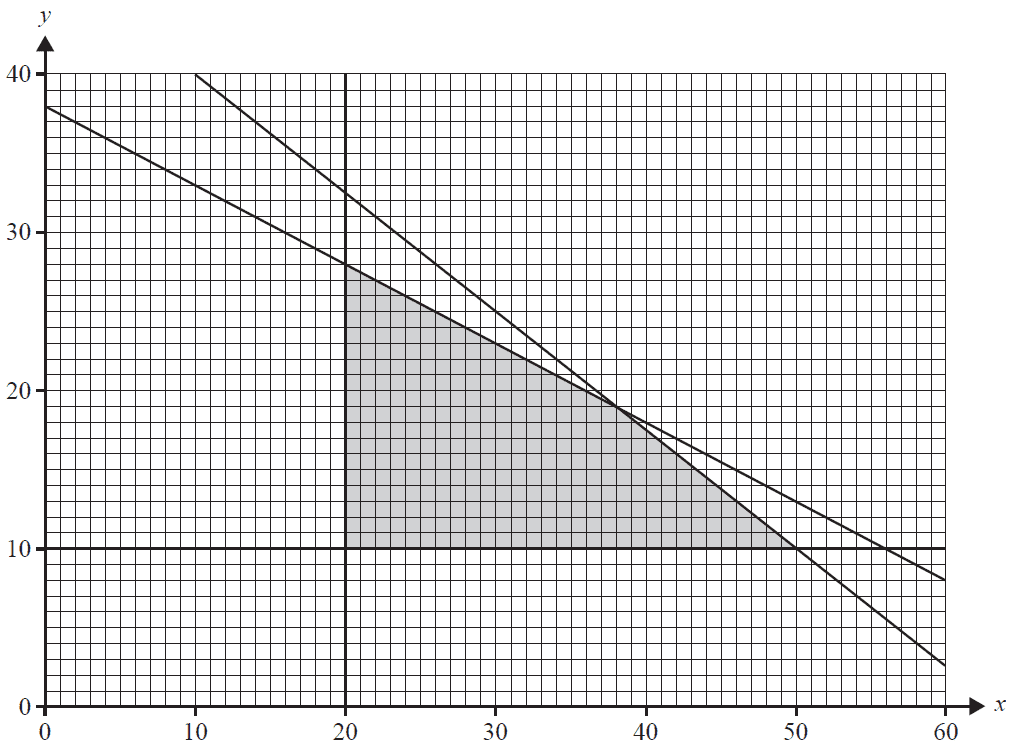
b. On a week in which 15 king-size bed frames are produced, what is the maximum number of queen-size bed frames that can be produced? 1 mark
The company makes a profit of $210 on queen-size bed frames and $350 on king-size bed frames.
c. Calculate the maximum weekly profit. 1 mark
d. The profit made on a queen-size bed frame is reduced.
Below what value must this profit fall so that the maximum weekly profit will result only at the point (20, 28) on the graph on page 37? 1 mark
End of Multiple-Choice Question Book
VCE is a registered trademark of the VCAA. The VCAA does not endorse or make any warranties regarding this study resource. Past VCE exams and related content can be accessed directly at www.vcaa.vic.edu.au
