2022 VCE Further Maths Exam 1
This is the full VCE Further Maths Exam with worked solutions. You can also try Mini-Tests, which are official VCAA exams split into short tests you can do anytime.
Number of marks: 40
Reading time: 15 minutes
Writing time: 1.5 hours
Instructions
• Answer all questions in pencil on your Multiple-Choice Answer Sheet.
• Choose the response that is correct for the question.
• A correct answer scores 1; an incorrect answer scores 0.
• Marks will not be deducted for incorrect answers.
• No marks will be given if more than one answer is completed for any question.
• Unless otherwise indicated, the diagrams in this book are not drawn to scale.
SECTION A – Core
Data analysis
Use the following information to answer Questions 1–3.
The histogram below displays the distribution of skull width, in millimetres, for 46 female possums.
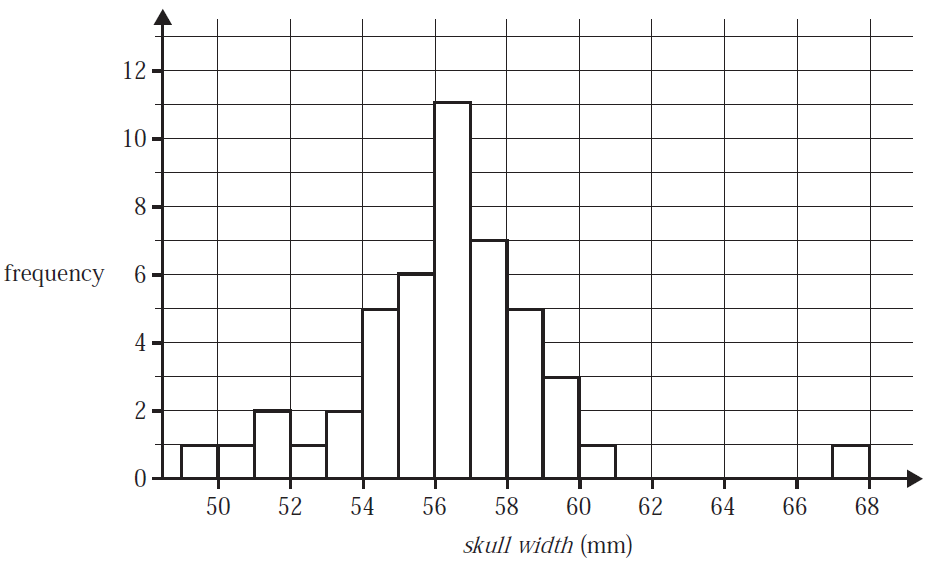
The shape of the distribution is best described as
- A. negatively skewed.
- B. approximately symmetric.
- C. negatively skewed with a possible outlier.
- D. positively skewed with a possible outlier.
- E. approximately symmetric with a possible outlier.
The percentage of the 46 possums with a skull width of less than 55 mm is closest to
- A. 12%
- B. 26%
- C. 39%
- D. 61%
- E. 74%
The third quartile (\(Q_3\)) for this distribution, in millimetres, could be
- A. 55.8
- B. 56.2
- C. 56.9
- D. 57.7
- E. 58.3
The age, in years, of a sample of 14 possums is displayed in the dot plot below.
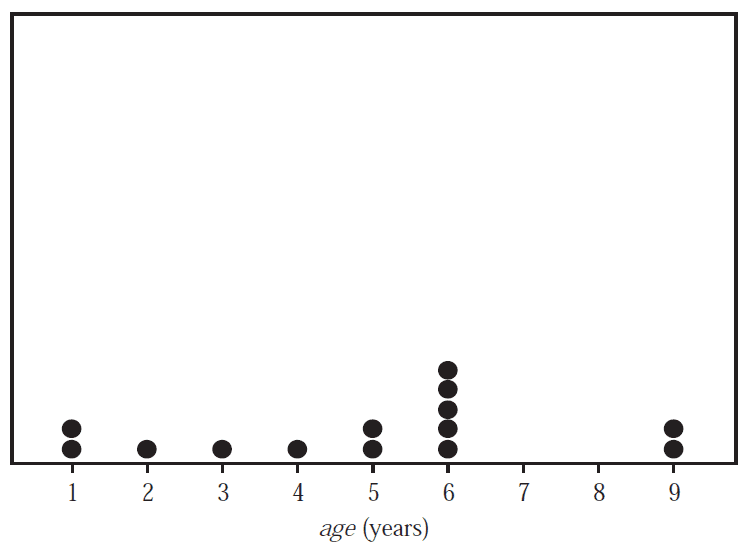
The mean and the standard deviation of age for this sample of possums are closest to
- A. \(\textit{mean} = 4.25 \quad \textit{standard deviation} = 2.6\)
- B. \(\textit{mean} = 4.8 \quad \textit{standard deviation} = 2.4\)
- C. \(\textit{mean} = 4.8 \quad \textit{standard deviation} = 2.5\)
- D. \(\textit{mean} = 4.9 \quad \textit{standard deviation} = 2.4\)
- E. \(\textit{mean} = 4.9 \quad \textit{standard deviation} = 2.5\)
The possum population of a large city park is 2498.
The body lengths of this species of possum are known to be approximately normally distributed with a mean
of 88 cm and a standard deviation of 4 cm.
Using the 68–95–99.7% rule, the number of possums in this park with a body length between 84 cm and
96 cm is closest to
- A. 2036
- B. 2043
- C. 2047
- D. 2105
- E. 2156
The histogram below displays the distribution of spleen weight for a sample of 32 seals.
The histogram has a \(\log_{10}\) scale.
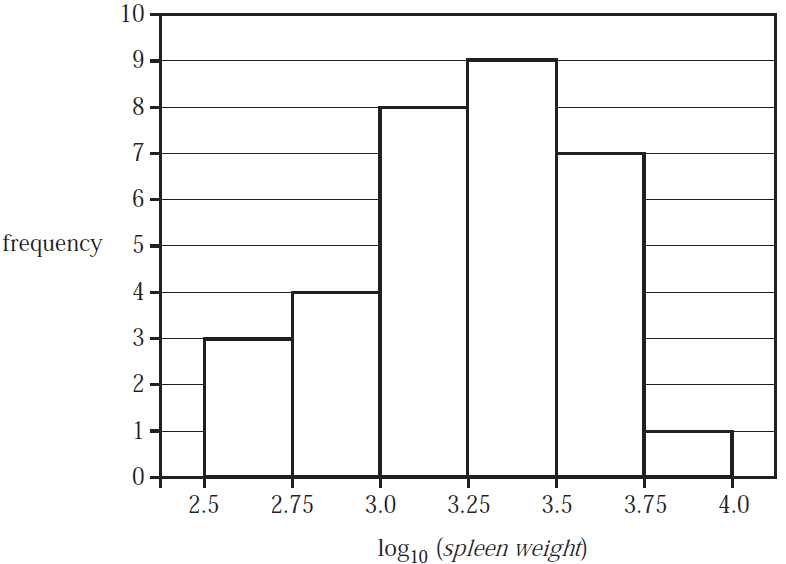
The number of seals in this sample with a spleen weight of 1000 g or more is
- A. 7
- B. 8
- C. 17
- D. 25
- E. 27
Use the following information to answer Questions 7 and 8.
The association between the weight of a seal’s spleen, spleen weight, in grams, and its age, in months, for a
sample of seals is non-linear.
This association can be linearised by applying a \(\log_{10}\) transformation to the variable spleen weight.
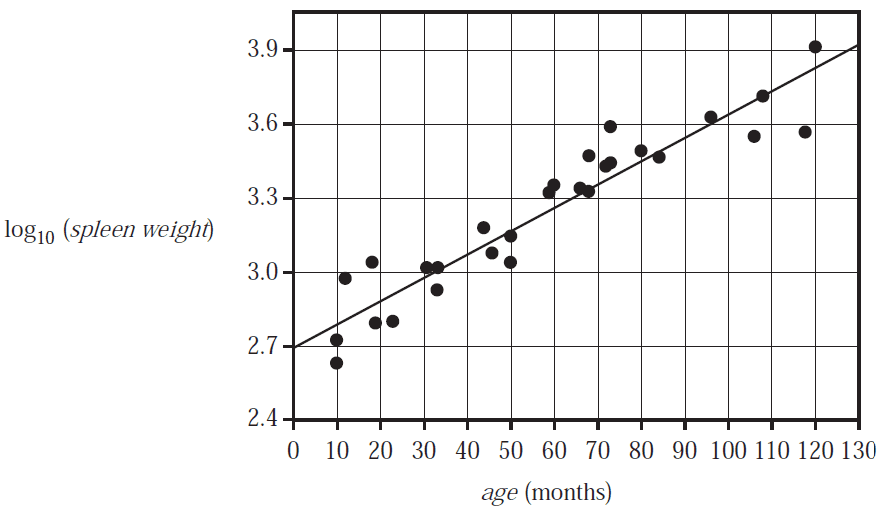
The equation of the least squares line for this scatterplot is
\(\log_{10}(\textit{spleen weight}) = 2.698 + 0.009434 \times \textit{age}\)
Question 7The equation of the least squares line predicts that, on average, for each one-month increase in the age of the seals, the increase in the value of \(\log_{10}(\textit{spleen weight})\) is
- A. 0.009434
- B. 0.01000
- C. 1.020
- D. 2.698
- E. 5.213
Using the equation of the least squares line, the predicted spleen weight of a 30-month-old seal, in grams, is closest to
- A. 3
- B. 511
- C. 772
- D. 957
- E. 1192
Use the following information to answer Questions 9–11.
Table 1 summarises the results of a study that compared the effectiveness of individual and group instruction (instructional method) when training future basketball referees.
Table 1
| Test grade | Instructional method | |
|---|---|---|
| Individual | Group | |
| A (85% or above) | 10 | 18 |
| B (75–84%) | 35 | 30 |
| C (65–74%) | 30 | 24 |
| D (50–64%) | 28 | 48 |
| E (less than 50%) | 12 | 6 |
| Total | 115 | 126 |
In this table, test grade is the response variable and instructional method is the explanatory variable.
Question 9The variables test grade (A, B, C, D, E) and instructional method (individual, group) are
- A. a numerical and a categorical variable respectively.
- B. both nominal variables.
- C. a nominal and an ordinal variable respectively.
- D. both ordinal variables.
- E. an ordinal and a nominal variable respectively.
Of the students who received an A grade, the percentage who were instructed individually is closest to
- A. 9%
- B. 22%
- C. 36%
- D. 56%
- E. 64%
To become a qualified referee, a grade of A or B on the test is required. Those who receive a C, a D or an E
will not qualify.
Using column percentages, a new two-way percentage frequency table is constructed from the data in
Table 1.
In this new table, qualified to be a referee (yes, no) is the response variable and instructional method
(individual, group) is the explanatory variable.
Which one of the following tables correctly displays the data from Table 1?
A.
| Qualified to be a referee | Instructional method (%) | |
|---|---|---|
| Individual | Group | |
| yes (A or B grade) | 35 | 38 |
| no (C, D or E grade) | 65 | 62 |
B.
| Qualified to be a referee | Instructional method (%) | |
|---|---|---|
| Individual | Group | |
| yes (A or B grade) | 39 | 38 |
| no (C, D or E grade) | 61 | 62 |
C.
| Qualified to be a referee | Instructional method (%) | |
|---|---|---|
| Individual | Group | |
| yes (A or B grade) | 39 | 43 |
| no (C, D or E grade) | 61 | 57 |
D.
| Qualified to be a referee | Instructional method (%) | |
|---|---|---|
| Individual | Group | |
| yes (A or B grade) | 61 | 62 |
| no (C, D or E grade) | 39 | 38 |
E.
| Qualified to be a referee | Instructional method (%) | |
|---|---|---|
| Individual | Group | |
| yes (A or B grade) | 65 | 57 |
| no (C, D or E grade) | 35 | 43 |
Use the following information to answer Questions 12–14.
The scatterplot below displays the body length, in centimetres, of 17 crocodiles, plotted against their head length, in centimetres. A least squares line has been fitted to the scatterplot. The explanatory variable is head length.
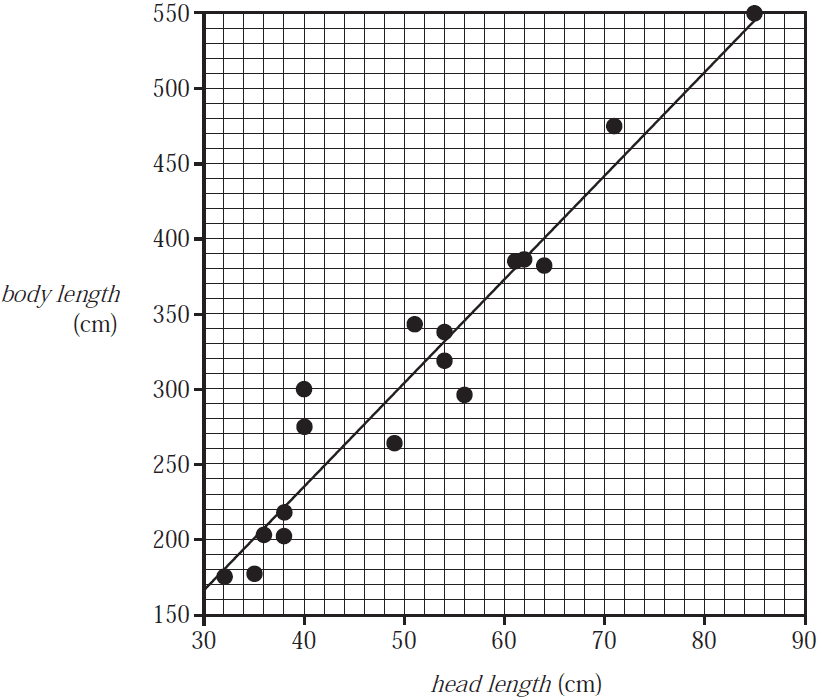
The equation of the least squares line is closest to
- A. \(\textit{head length} = -40 + 7 \times \textit{body length}\)
- B. \(\textit{body length} = -40 + 7 \times \textit{head length}\)
- C. \(\textit{head length} = 168 + 7 \times \textit{body length}\)
- D. \(\textit{body length} = 168 - 40 \times \textit{head length}\)
- E. \(\textit{body length} = 7 + 168 \times \textit{head length}\)
The median head length of the 17 crocodiles, in centimetres, is closest to
- A. 49
- B. 51
- C. 54
- D. 300
- E. 345
The correlation coefficient \(r\) is equal to 0.963
The percentage of variation in body length that is not explained by the variation in head length is closest to
- A. 0.9%
- B. 3.7%
- C. 7.3%
- D. 92.7%
- E. 96.3%
The daily number of cups of coffee sold by a food truck over a three-week period is shown in the table below.
| Week | Monday | Tuesday | Wednesday | Thursday | Friday | Saturday | Sunday |
|---|---|---|---|---|---|---|---|
| 1 | 123 | 91 | 120 | 176 | 145 | 99 | 187 |
| 2 | 98 | 104 | 145 | 163 | 134 | 128 | 206 |
| 3 | 125 | 134 | 128 | 187 | 156 | 102 | 179 |
The six-mean smoothed number of cups of coffee, with centring, sold on Thursday in Week 2 is closest to
- A. 127
- B. 138
- C. 147
- D. 155
- E. 163
The seasonal index for sales of sunscreen in summer is 1.25
To correct for seasonality, the actual sunscreen sales for summer should be
- A. reduced by 20%
- B. reduced by 25%
- C. reduced by 80%
- D. increased by 20%
- E. increased by 25%
Recursion and financial modelling
A sequence of numbers is generated by the recurrence relation shown below.
\[ R_0 = 2, \quad R_{n+1} = 2 - R_n \]
The value of \(R_2\) is
- A. –4
- B. –2
- C. 0
- D. 2
- E. 4
Use the following information to answer Questions 18 and 19.
The balance of a loan, \(V_n\), in dollars, after \(n\) months is modelled by the recurrence relation
\(V_0 = 400\,000, \quad V_{n+1} = 1.003V_n - 2024\)
Question 18The balance of the loan first falls below $398 000 after how many months?
- A. 1
- B. 2
- C. 3
- D. 4
- E. 5
With a small change to the final payment, the loan is expected to be repaid in full in
- A. 25 years.
- B. 26 years.
- C. 28 years.
- D. 29 years.
- E. 30 years.
Nidhi owns equipment that is used for 10 hours per day for all 365 days of the year.
The value of the equipment is depreciated by Nidhi using the unit cost method.
The value of the equipment, \(E_n\), in dollars, after \(n\) years can be modelled by the recurrence relation
\(E_0 = 100\,000, \quad E_{n+1} = E_n - 5475\)
The value of the equipment is depreciated by
- A. $1.50 per hour.
- B. $10 per hour.
- C. $15 per hour.
- D. $1.50 per day.
- E. $10 per day.
Consider the following four statements regarding nominal and effective interest rates as they apply to compound interest investments and loans:
- • An effective interest rate is the same as a nominal interest rate if interest compounds annually.
- • Effective interest rates increase as the number of compounding periods per year increases.
- • A nominal rate of 12% per annum is equivalent to a nominal rate of 1% per month.
- • An effective interest rate can be lower than a nominal interest rate.
How many of these four statements are true?
- A. 0
- B. 1
- C. 2
- D. 3
- E. 4
Tim deposited $6000 into an investment account earning compound interest calculated monthly.
A rule for the balance, \(T_n\), in dollars, after \(n\) years is given by \(T_n = 6000 \times 1.003^{12n}\).
Let \(R_n\) be a new recurrence relation that models the balance of Tim’s account after \(n\) months.
This recurrence relation is
- A. \(R_0 = 6000, R_{n+1} = R_n + 18\)
- B. \(R_0 = 6000, R_{n+1} = R_n + 36\)
- C. \(R_0 = 6000, R_{n+1} = 1.003R_n\)
- D. \(R_0 = 6000, R_{n+1} = 1.0036R_n\)
- E. \(R_0 = 6000, R_{n+1} = 1.036R_n\)
Li invests $4000 for five years at 3.88% per annum, compounding annually.
Joseph invests a sum of money for five years, which earns simple interest paid annually.
Let \(J_n\) be the value, in dollars, of Joseph’s investment after \(n\) years.
The two investments will finish at the same value, rounded to the nearest cent, if Joseph’s investment is
modelled by which one of the following recurrence relations?
- A. \(J_0 = 2000, J_{n+1} = J_n + 467.72\)
- B. \(J_0 = 2500, J_{n+1} = J_n + 367.72\)
- C. \(J_0 = 3000, J_{n+1} = J_n + 317.72\)
- D. \(J_0 = 3500, J_{n+1} = J_n + 267.72\)
- E. \(J_0 = 4000, J_{n+1} = J_n + 67.72\)
On 1 January 2020, Dion invested $10 500 into an investment account paying compound interest of 0.52%
quarterly.
At the end of each quarter, after the interest was credited, Dion added an additional amount of money.
Let \(D_n\) represent the additional amount, in dollars, added at the end of quarter \(n\).
This additional amount per quarter is modelled by the recurrence relation
\(D_1 = C, \quad D_{n+1} = D_n\)
The balance of Dion’s investment account on 1 January 2022 was $12 700.95
The value of \(C\) is
- A. $71.69
- B. $215.55
- C. $260.22
- D. $270.15
- E. $275.12
SECTION B – Modules
Module 1 – Matrices
Use the following information to answer Questions 1 and 2.
A bike rental business rents road bikes (\(R\)) and mountain bikes (\(M\)) in three sizes: child (\(C\)), junior (\(J\)) and adult (\(A\)).
Matrix \(B\) shows the daily rental cost, in dollars, for each type of bike.
\[ \begin{array}{r@{\hskip 1em}c} B = \begin{array}{c} \begin{array}{cc} R & M \end{array} \\[-1.2ex] \left[ \begin{array}{cc} 80 & 95 \\ 110 & 120 \\ 120 & 135 \end{array} \right] \end{array} & \begin{array}{c} \\[-1.2ex] % add vertical space above to match the top label height C \\ J \\ A \end{array} \end{array} \]The element in row \(i\) and column \(j\) in matrix \(B\) is \(b_{ij}\).
Question 1The daily cost of renting an adult mountain bike is shown in element
- A. \(b_{12}\)
- B. \(b_{21}\)
- C. \(b_{23}\)
- D. \(b_{31}\)
- E. \(b_{32}\)
On Sundays, the business increases the daily rental price for each type of bike by 10%.
To determine the rental cost for each type of bike on a Sunday, which one of the following matrix calculations needs to be completed?
- A. \(0.01B\)
- B. \(0.1B\)
- C. \(1.01B\)
- D. \(1.1B\)
- E. \(11B\)
Each day, members of a swim centre can choose to attend a morning session (\(M\)), an afternoon session (\(A\)) or no session (\(N\)).
The transition diagram below shows the transition from day to day.
The transition diagram is incomplete.
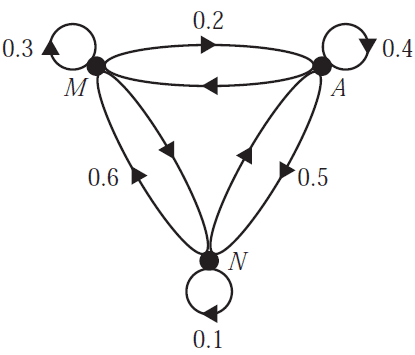
Which one of the following transition matrices represents this transition diagram?
The communication matrix below shows the communication links between five people: Steph (\(S\)), Tran (\(T\)), Ursula (\(U\)), Vinh (\(V\)) and Wanda (\(W\)).
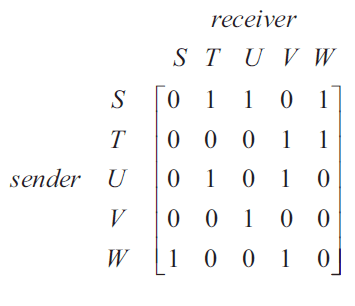
In this matrix:
- the '1' in row \(S\), column \(T\) indicates that Steph can communicate directly with Tran
- the '0' in row \(V\), column \(W\) indicates that Vinh cannot communicate directly with Wanda.
Ursula needs to communicate with Steph.
The sequence of communication links that will successfully allow Ursula to communicate with Steph is
- A. \(U-T-S\)
- B. \(U-W-S\)
- C. \(U-T-W-S\)
- D. \(U-V-T-S\)
- E. \(U-W-T-S\)
Matrix \(E\) is a \(2 \times 2\) matrix.
Matrix \(F\) is a \(2 \times 3\) matrix.
Matrix \(G\) is a \(3 \times 2\) matrix.
Matrix \(H\) is a \(3 \times 3\) matrix.
Which one of the following matrix products could have an inverse?
- A. \(EF\)
- B. \(FH\)
- C. \(GE\)
- D. \(GF\)
- E. \(HG\)
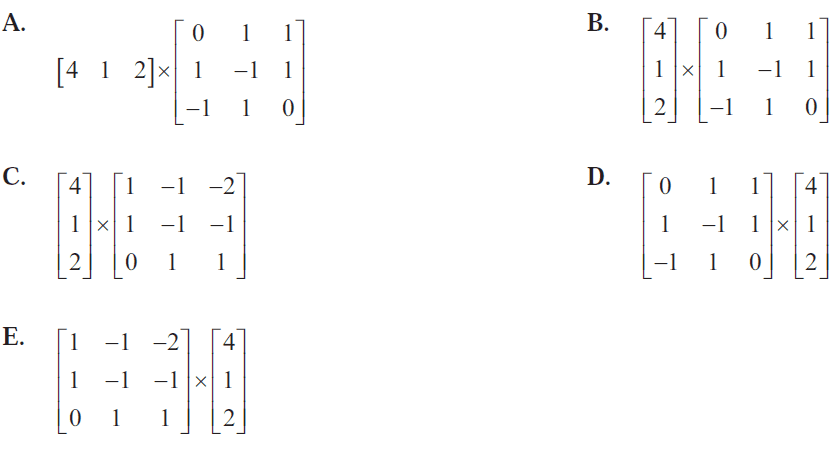
Consider the following system of simultaneous linear equations.
\(y + z = 4\)
\(x - y + z = 1\)
\(-x + y = 2\)
The solution to these simultaneous equations can be found by calculating
- A. \(\begin{bmatrix} 4 & 1 & 2 \end{bmatrix} \times \begin{bmatrix} 0 & 1 & 1 \\ 1 & -1 & 1 \\ -1 & 1 & 0 \end{bmatrix}\)
- B. \(\begin{bmatrix} 4 \\ 1 \\ 2 \end{bmatrix} \times \begin{bmatrix} 0 & 1 & 1 \\ 1 & -1 & 1 \\ -1 & 1 & 0 \end{bmatrix}\)
- C. \(\begin{bmatrix} 4 \\ 1 \\ 2 \end{bmatrix} \times \begin{bmatrix} 1 & -1 & -2 \\ 1 & -1 & -1 \\ 0 & 1 & 1 \end{bmatrix}\)
- D. \(\begin{bmatrix} 0 & 1 & 1 \\ 1 & -1 & 1 \\ -1 & 1 & 0 \end{bmatrix}^{-1} \times \begin{bmatrix} 4 \\ 1 \\ 2 \end{bmatrix}\)
- E. \(\begin{bmatrix} 1 & -1 & -2 \\ 1 & -1 & -1 \\ 0 & 1 & 1 \end{bmatrix} \times \begin{bmatrix} 4 \\ 1 \\ 2 \end{bmatrix}\)
Matrix \(K\) is a permutation matrix.
\[ K = \begin{bmatrix} 0 & 0 & 1 & 0 & 0 \\ 0 & 1 & 0 & 0 & 0 \\ 0 & 0 & 0 & 1 & 0 \\ 0 & 0 & 0 & 0 & 1 \\ 1 & 0 & 0 & 0 & 0 \end{bmatrix} \]
Matrix \(M\) is a column matrix that is multiplied once by matrix \(K\) to obtain matrix \(P\).
When matrix \(M\) is multiplied by matrix \(K\), the element \(m_{31}\) moves to element
- A. \(p_{11}\)
- B. \(p_{21}\)
- C. \(p_{31}\)
- D. \(p_{41}\)
- E. \(p_{51}\)
Two types of computers – laptops (\(L\)) and desktops (\(D\)) – can be serviced by Henry (\(H\)), Irvine (\(I\)) or Jean (\(J\)).
Matrix \(N\) shows the time, in minutes, it takes each person to service a laptop and a desktop.
\[ \begin{array}{r@{\hskip 1em}c} N = & \begin{array}{c} \begin{array}{cc} L & D \end{array} \\[-1.2ex] \left[ \begin{array}{cc} 18 & 8 \\ 10 & 17 \\ 12 & 9 \end{array} \right] \end{array} \begin{array}{c} \\[-1.2ex] H \\ I \\ J \end{array} \end{array} \]Matrix \(Q\) shows the number of laptops and desktops in four different departments: marketing (\(M\)), advertising (\(A\)), publishing (\(P\)) and editing (\(E\)).
\[ \begin{array}{r@{\hskip 1em}c} Q = & \begin{array}{c} \begin{array}{cc} L & D \end{array} \\[-1.2ex] \left[ \begin{array}{cc} 6 & 8 \\ 4 & 7 \\ 5 & 5 \\ 10 & 12 \end{array} \right] \end{array} \begin{array}{c} \\[-1.2ex] M \\ A \\ P \\ E \end{array} \end{array} \]A calculation that determines the total time that it would take each of Henry, Irvine or Jean, working alone, to service all the laptops and desktops in all four departments is
- A. \([1 \quad 1 \quad 1 \quad 1] \times (Q \times N^T)\)
- B. \((Q \times N^T) \times \begin{bmatrix} 1 \\ 1 \end{bmatrix}\)
- C. \((N \times Q^T) \times Q\)
- D. \(\begin{bmatrix} 1 & 0 & 0 \\ 0 & 1 & 0 \\ 0 & 0 & 1 \end{bmatrix} \times N \times Q^T\)
- E. \([1 \quad 1 \quad 1 \quad 1] \times Q \times N^T \times \begin{bmatrix} 1 \\ 1 \\ 1 \end{bmatrix}\)
Module 2 – Networks and decision mathematics
The network below shows the distances, in kilometres, along a series of roads.
The vertices \(A, B, C, D, E, F, G\) and \(H\) represent the intersections of these roads.
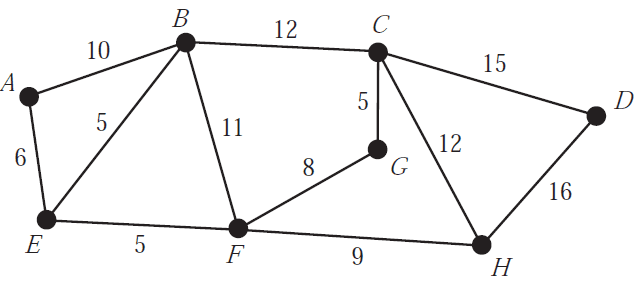
Prim’s algorithm can be used to find the
- A. critical path.
- B. shortest path.
- C. minimum cut.
- D. minimum allocation.
- E. minimum spanning tree.
The map below shows seven countries within Central America.
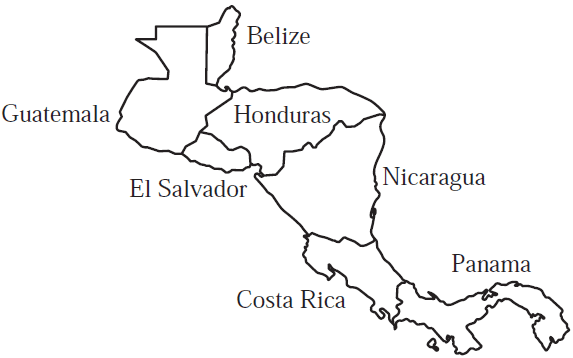
A network diagram was drawn with seven vertices to represent each of the countries on the map of Central America. Edges were drawn to represent a border shared between two countries.
The number of edges that this network has is
- A. 5
- B. 6
- C. 7
- D. 8
- E. 9
An athletics club needs to select one team of four athletes.
The team is required to have one long jump, one high jump, one shot put and one javelin competitor.
The following table shows the best distances, in metres, for each athlete for each event.
| Athlete | Long jump (m) | High jump (m) | Shot put (m) | Javelin (m) |
|---|---|---|---|---|
| Eve | 4.8 | 1.7 | 13.1 | 40.9 |
| Harsha | 4.8 | 1.6 | 13.9 | 39.5 |
| Shona | 5.1 | 1.8 | 14.4 | 41.2 |
| Taylor | 4.8 | 1.7 | 12.8 | 39.8 |
The athletics club will allocate each athlete to one event in order to maximise the total distance that the team jumps and throws.
Which allocation of athlete to event must occur in order to maximise the total distance?
- A.
long jump high jump shot put javelin Shona Harsha Eve Taylor - B.
long jump high jump shot put javelin Shona Taylor Harsha Eve - C.
long jump high jump shot put javelin Eve Harsha Taylor Shona - D.
long jump high jump shot put javelin Harsha Taylor Shona Eve - E.
long jump high jump shot put javelin Harsha Taylor Eve Shona
Consider the graph below.
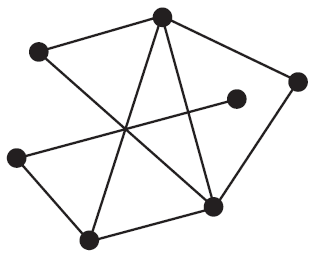
The number of edges that need to be removed for this graph to be planar is
- A. 0
- B. 1
- C. 2
- D. 3
- E. 4
A connected graph consists of five vertices and four edges.
Which one of the following statements is not true?
- A. The graph could be a tree.
- B. The graph could be planar.
- C. The graph could be bipartite.
- D. The graph could contain a path.
- E. The graph could contain a cycle.
A landscaping project has 12 activities. The network below gives the time, in hours, that it takes to complete each activity.
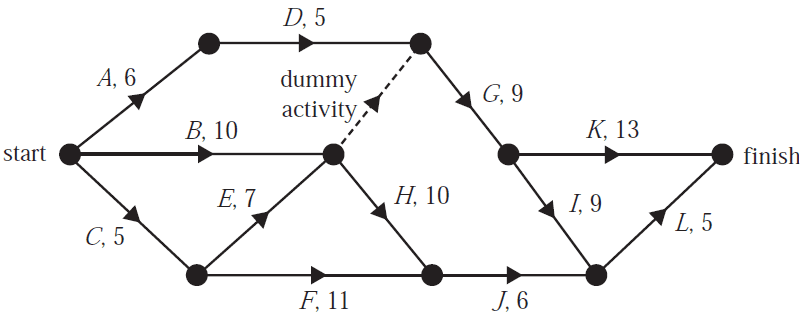
The earliest start time, in hours, for activity \(G\) is
- A. 10
- B. 11
- C. 12
- D. 13
- E. 14
Use the following information to answer Questions 7 and 8.
A project involves 11 activities, \(A\) to \(K\).
The table below shows the earliest start time and duration, in days, for each activity.
The immediate predecessor(s) of each activity is also shown.
| Activity | Earliest start time | Duration | Immediate predecessor(s) |
|---|---|---|---|
| A | 0 | 6 | – |
| B | 0 | 7 | – |
| C | 6 | 10 | A |
| D | 6 | 7 | A |
| E | 7 | 8 | B |
| F | 15 | 2 | D, E |
| G | 15 | 2 | E |
| H | 17 | 3 | G |
| I | 20 | 6 | C, F, H |
| J | 17 | 5 | G |
| K | 26 | 2 | I, J |
A directed network for this project will require a dummy activity.
The dummy activity will be drawn from the end of
- A. activity \(A\) to the start of activity \(D\).
- B. activity \(E\) to the start of activity \(F\).
- C. activity \(F\) to the start of activity \(I\).
- D. activity \(G\) to the start of activity \(H\).
- E. activity \(I\) to the start of activity \(J\).
When this project is completed in the minimum time, the sum of all the float times, in days, will be
- A. 0
- B. 16
- C. 18
- D. 20
- E. 28
Module 3 – Geometry and measurement
A regular octagon is drawn inside a circle, as shown below.
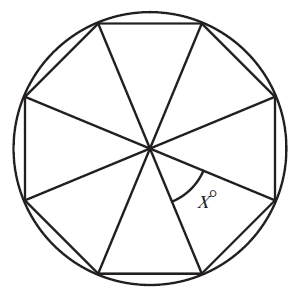
The size of angle \(x\) is
- A. 25°
- B. 30°
- C. 36°
- D. 45°
- E. 60°
Use the following information to answer Questions 2 and 3.
An isosceles triangle is drawn within a circle, as shown in the diagram below.
The base length of the isosceles triangle is 3.0 cm and its vertical height is labelled \(h\).
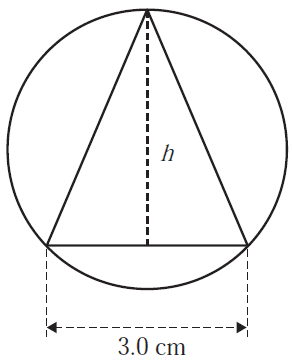
The area of the triangle is 5.25 cm².
Question 2The value of \(h\), in centimetres, is
- A. 1.75
- B. 2.5
- C. 3.0
- D. 3.5
- E. 7.0
The area of the triangle is 38.5% of the area of the circle.
The radius of the circle, in centimetres, is closest to
- A. 1.04
- B. 2.08
- C. 3.12
- D. 4.16
- E. 5.20
Three cities on the same parallel of latitude in the United States of America (USA) are Mountain Grove (37° N, 92° W), Santa Cruz (37° N, 122° W) and Williamsburg (37° N, 77° W).
Assume that a difference of 15° in longitude equates to a one-hour time difference.
Which one of the following statements is true?
- A. When it is 3 pm in Mountain Grove, it is 5 pm in Williamsburg.
- B. When it is 3 pm in Williamsburg, it is 5 pm in Santa Cruz.
- C. When it is 3 pm in Santa Cruz, it is 6 pm in Williamsburg.
- D. When it is 3 pm in Mountain Grove, it is 5 pm in Santa Cruz.
- E. When it is 3 pm in Williamsburg, it is 5 pm in Mountain Grove.
A large storage tank consists of a cylinder with a hemisphere at each end.
The cylinder has a length of 15 m and a diameter of 3 m, as shown in the diagram below.
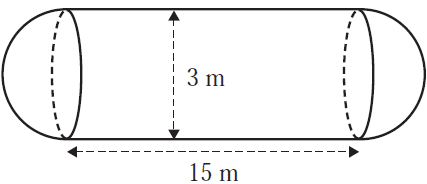
A scale model of this storage tank is constructed.
The total length of the scale model is 300 mm.
The diameter of the scale model, in millimetres, is
- A. 25
- B. 30
- C. 50
- D. 60
- E. 120
An aeroplane completed a flight consisting of three stages.
Starting at Amberley, it flew 45 km directly due north to Beachwood.
From Beachwood, it flew 66 km on a bearing of 303° to Chalton.
From Chalton, it flew 98 km to return to Amberley.
The bearing, rounded to the nearest degree, of the trip from Chalton to Amberley, was closest to
- A. 23°
- B. 54°
- C. 57°
- D. 123°
- E. 146°
Two residential towers, Belleview and Grandview, built on flat, level ground, face each other.
Grandview has a height of 40.3 m.
From Fran's window ledge in Belleview, \(F\), she measured an angle of elevation of 20° to the top of Grandview and an angle of depression of 17° to the ground at Grandview.
This information is shown in the diagram below.
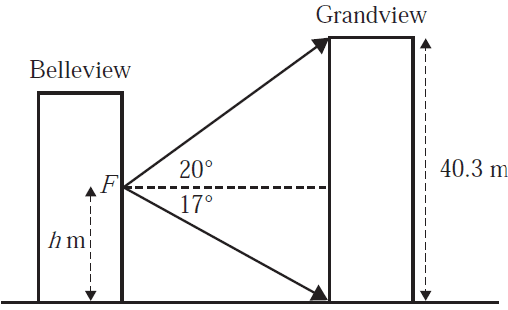
The height, \(h\), from the ground to Fran's window ledge, in metres, is closest to
- A. 8.8
- B. 18.4
- C. 21.9
- D. 32.5
- E. 211.6
A movie camera is placed 20 m above ground level on a vertical tower.
Actors are filmed running away from the tower along a stretch of flat ground and up a ramp.
The end of the ramp is 4 m above ground level.
The angle of depression from the camera to the bottom of the ramp is 35° and the angle of depression from the camera to the top of the ramp is 20°.
This information is shown in the diagram below.
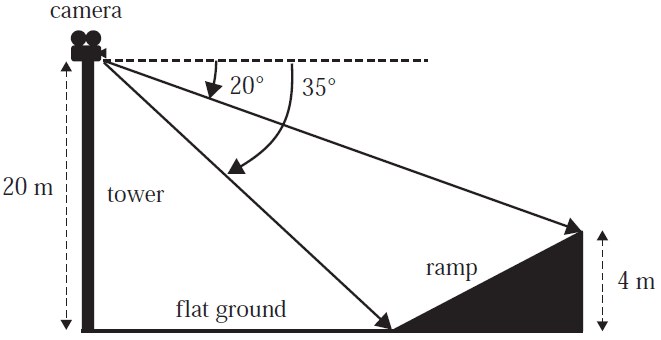
The length of the ramp, in metres, is closest to
- A. 12
- B. 14
- C. 16
- D. 35
- E. 47
Module 4 – Graphs and relations
The expected height of a tree, \(H\), in metres, \(n\) months after it was planted in a garden is modelled by the equation
\(H = 1.5 + 0.12n\)
The expected height of the tree, in metres, eight months after it was planted is
- A. 0.96
- B. 1.44
- C. 1.50
- D. 1.628
- E. 2.46
The graph below shows the temperature inside a room, in degrees Celsius, over a 12-hour period.
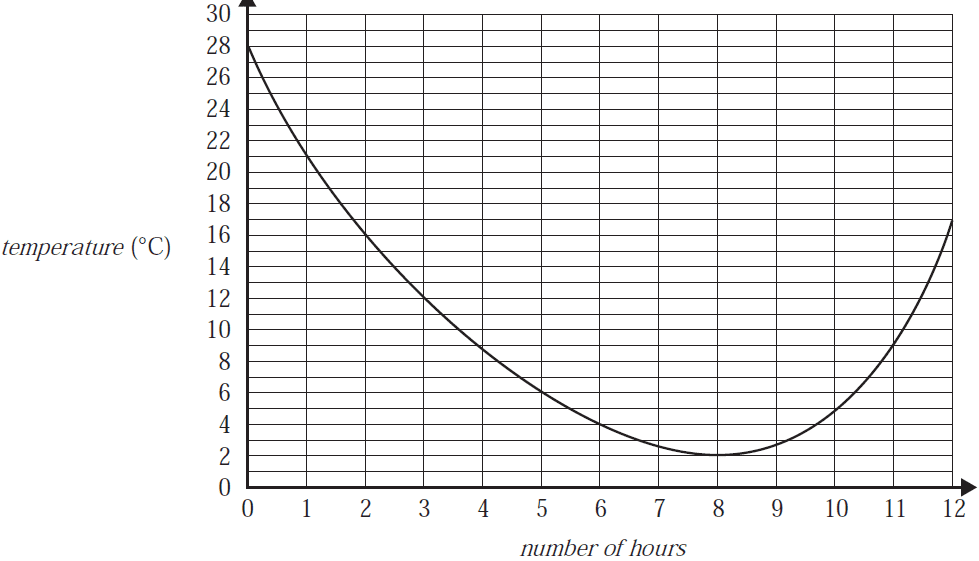
Which one of the following statements is not true?
- A. The minimum temperature during the 12-hour period was 2 °C.
- B. The temperature decreased by 16 °C during the first three hours.
- C. The temperature was 9 °C or lower for a total of seven hours.
- D. The average increase in temperature from four hours to 12 hours was 1 °C per hour.
- E. The average decrease in temperature during the first two hours was 5 °C per hour.
Pedro makes and sells vases.
Each vase costs $40 to produce.
He also has one fixed cost of $1600 each month.
The selling price of each vase is $75.
Last month Pedro made and sold 150 vases.
The profit for this activity is
- A. $3650
- B. $5250
- C. $6850
- D. $7600
- E. $11 250
The shaded area in the graph below shows the feasible region for a linear programming problem.
The objective function is given by
\(Z = 3x - 5y\)
The maximum value of the objective function is
- A. –10
- B. 5
- C. 10
- D. 110
- E. 125
A car dealership purchased 11 sedans and seven station wagons for a total cost of $733 000.
Each sedan costs $7000 less than each station wagon.
The cost of each sedan that the car dealership purchased was
- A. $31 000
- B. $38 000
- C. $41 000
- D. $45 000
- E. $52 000
To make shades of pink paint, a painter mixes at least three drops of white paint with two drops of red paint.
Let \(x\) be the number of drops of white paint used.
Let \(y\) be the number of drops of red paint used.
An inequality representing this situation is
- A. \(x \geq \frac{2}{3}y\)
- B. \(x \geq \frac{3}{2}y\)
- C. \(y \geq \frac{2}{3}x\)
- D. \(y \geq \frac{3}{2}x\)
- E. \(y \leq \frac{3}{2}x\)
A water tank with 1200 litres of water is being emptied.
The graph below shows the volume of water, \(V\), in litres, in the tank at time \(t\), in minutes.
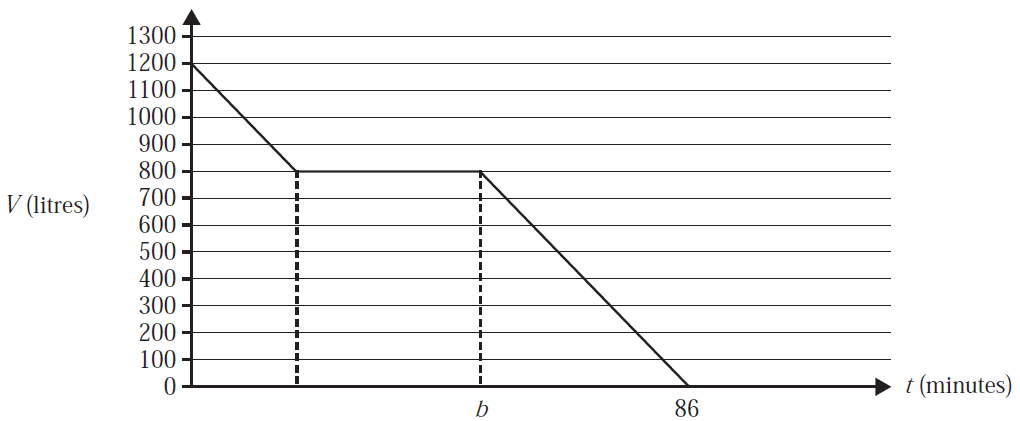
The volume of water in the tank initially decreased by 400 litres at a rate of 25 litres per minute.
The volume of water did not change for the next 30 minutes.
Finally, the volume of water in the tank decreased to zero.
This whole process took 86 minutes.
The equation of the line between \(t = b\) and \(t = 86\) is
- A. \(V = -20t + 1720\)
- B. \(V = -20t + 2150\)
- C. \(V = -25t + 1720\)
- D. \(V = -25t + 2150\)
- E. \(V = -40t + 3440\)
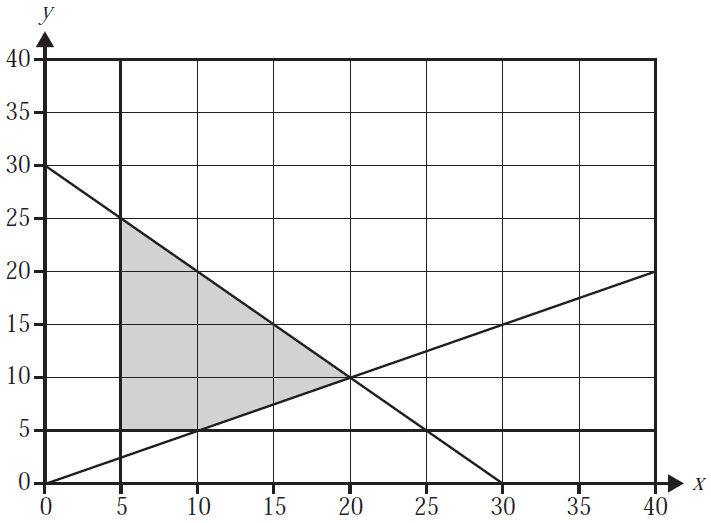
The feasible region for a linear programming problem is shown shaded in the graph below.
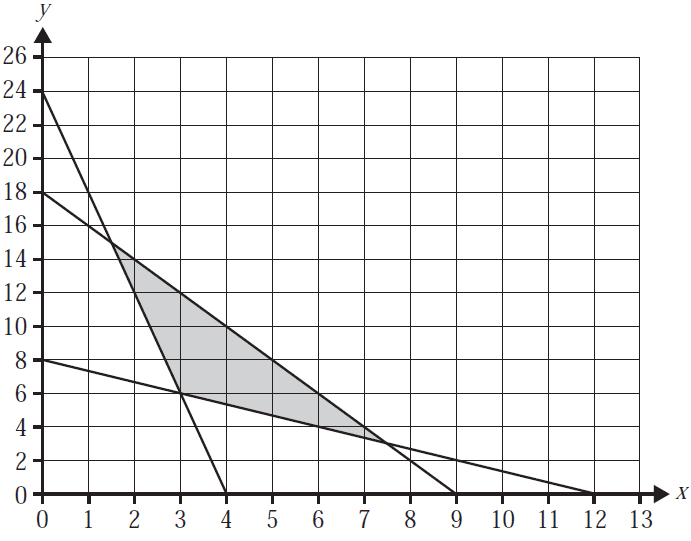
The objective function for this problem is of the form
\(Z = ax + by\) where \(a > 0\) and \(b > 0\)
\(x\) and \(y\) can only have integer values.
Which one of the following statements is true?
- A. If \(\frac{a}{b} = 2\), there are eight points that will maximise the value of \(Z\).
- B. There is a value for \(\frac{a}{b}\) where the maximum value of \(Z\) will occur only at the point (3, 10).
- C. If \(\frac{a}{b} > 2\), then the maximum value of \(Z\) will occur at the point (2, 14).
- D. If \(\frac{a}{b} > 6\), then the minimum value of \(Z\) will occur at the point (2, 12).
- E. For all values of \(\frac{a}{b}\), the minimum value of \(Z\) will always occur at the point (3, 6).
End of Multiple-Choice Question Book
VCE is a registered trademark of the VCAA. The VCAA does not endorse or make any warranties regarding this study resource. Past VCE exams and related content can be accessed directly at www.vcaa.vic.edu.au
