2021 VCE Further Maths Exam 1
This is the full VCE Further Maths Exam with worked solutions. You can also try Mini-Tests, which are official VCAA exams split into short tests you can do anytime.
Number of marks: 40
Reading time: 15 minutes
Writing time: 1.5 hours
Instructions
• Answer all questions in pencil on your Multiple-Choice Answer Sheet.
• Choose the response that is correct for the question.
• A correct answer scores 1; an incorrect answer scores 0.
• Marks will not be deducted for incorrect answers.
• No marks will be given if more than one answer is completed for any question.
• Unless otherwise indicated, the diagrams in this book are not drawn to scale.
SECTION A – Core
Data analysis
Use the following information to answer Questions 1–3.
The percentaged segmented bar chart below shows the age (under 55 years, 55 years and over) of visitors at a travel convention, segmented by preferred travel destination (domestic, international).
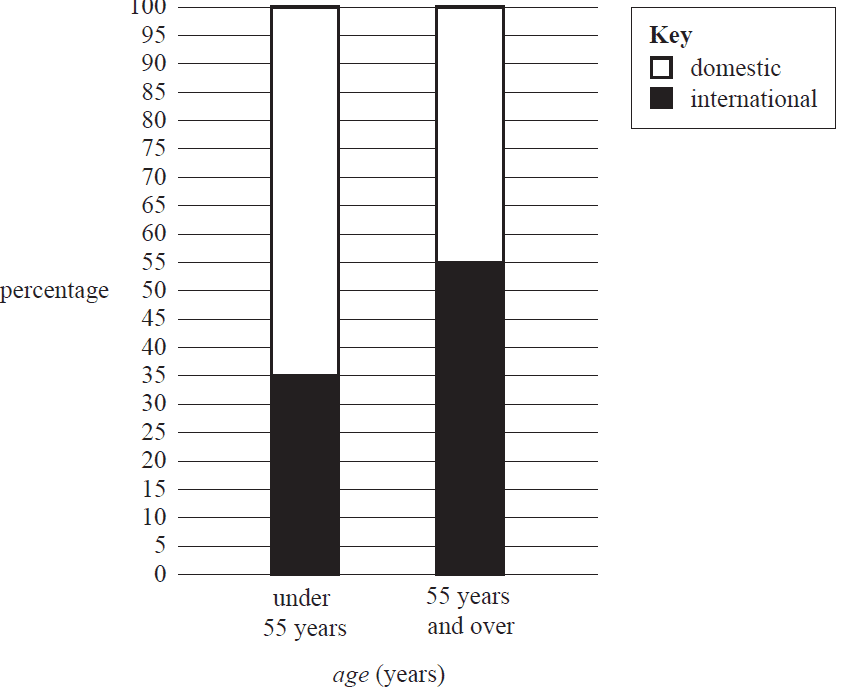
The variables age (under 55 years, 55 years and over) and preferred travel destination (domestic, international) are
- A. both categorical variables.
- B. both numerical variables.
- C. a numerical variable and a categorical variable respectively.
- D. a categorical variable and a numerical variable respectively.
- E. a discrete variable and a continuous variable respectively.
The data displayed in the percentaged segmented bar chart supports the contention that there is an association between preferred travel destination and age because
- A. more visitors favour international travel.
- B. 35% of visitors under 55 years favour international travel.
- C. 45% of visitors 55 years and over favour domestic travel.
- D. 65% of visitors under 55 years favour domestic travel while 45% of visitors 55 years and over favour domestic travel.
- E. the percentage of visitors who prefer domestic travel is greater than the percentage of visitors who prefer international travel.
The results could also be summarised in a two-way frequency table. Which one of the following frequency tables could match the percentaged segmented bar chart?
- A.
Age Preferred travel destination Under 55 years 55 years and over domestic 91 90 international 49 110 Total 140 200 - B.
Age Preferred travel destination Under 55 years 55 years and over domestic 65 35 international 45 55 Total 110 90 - C.
Age Preferred travel destination Under 55 years 55 years and over domestic 35 55 international 65 45 Total 100 100 - D.
Age Preferred travel destination Under 55 years 55 years and over domestic 50 70 international 100 50 Total 150 120 - E.
Age Preferred travel destination Under 55 years 55 years and over domestic 71 39 international 29 61 Total 100 100
The boxplots below show the distribution of the length of fish caught in two different ponds, Pond A and Pond B.
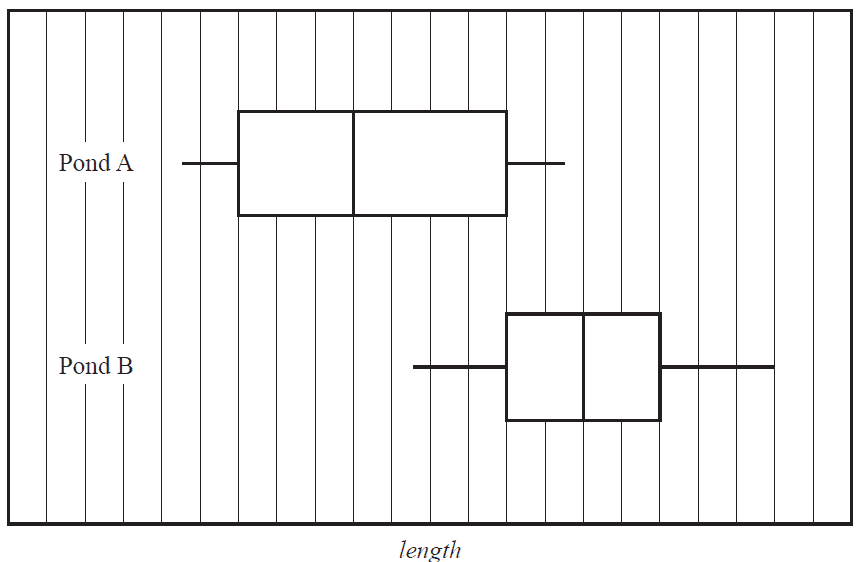
Based on the boxplots above, it can be said that
- A. 50% of the fish caught in Pond A are the same length as the fish caught in Pond B.
- B. 50% of the fish caught in Pond B are longer than all of the fish caught in Pond A.
- C. 50% of the fish caught in Pond B are shorter than all of the fish caught in Pond A.
- D. 75% of the fish caught in Pond A are shorter than all of the fish caught in Pond B.
- E. 75% of the fish caught in Pond B are longer than all of the fish caught in Pond A.
The stem plot below shows the height, in centimetres, of 20 players in a junior football team.
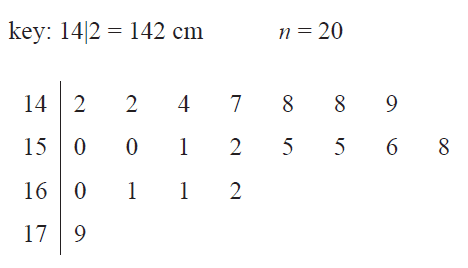
A player with a height of 179 cm is considered an outlier because 179 cm is greater than
- A. 162 cm
- B. 169 cm
- C. 172.5 cm
- D. 173 cm
- E. 175.5 cm
The relationship between resting pulse rate, in beats per minute, and age group (15–20 years, 21–30 years, 31–50 years, over 50 years) is best displayed using
- A. a histogram.
- B. a scatterplot.
- C. parallel boxplots.
- D. a time series plot.
- E. a back-to-back stem plot.
Use the following information to answer Questions 7 and 8.
800 participants auditioned for a stage musical. Each participant was required to complete a series of ability tests for which they received an overall score.
The overall scores were approximately normally distributed with a mean score of 69.5 points and a standard deviation of 6.5 points.
Only the participants who scored at least 76.0 points in the audition were considered successful.
Using the 68–95–99.7% rule, how many of the participants were considered unsuccessful?
- A. 127
- B. 128
- C. 272
- D. 672
- E. 673
To be offered a leading role in the stage musical, a participant must achieve a standardised score of at least 1.80.
Three participants’ names and their overall scores are given in the table below.
| Participant | Overall score |
|---|---|
| Amy | 81.5 |
| Brian | 80.5 |
| Cherie | 82.0 |
Which one of the following statements is true?
- A. Only Amy was offered a leading role.
- B. Only Cherie was offered a leading role.
- C. Only Brian was not offered a leading role.
- D. Both Brian and Cherie were offered leading roles.
- E. All three participants were offered leading roles.
The heights of females living in a small country town are normally distributed:
- 16% of the females are more than 160 cm tall.
- 2.5% of the females are less than 115 cm tall.
The mean and the standard deviation of this female population, in centimetres, are closest to
- A. mean = 135, standard deviation = 15
- B. mean = 135, standard deviation = 25
- C. mean = 145, standard deviation = 15
- D. mean = 145, standard deviation = 20
- E. mean = 150, standard deviation = 10
Oscar walked for nine consecutive days. The time, in minutes, that Oscar spent walking on each day is shown in the table below.
| Day | 1 | 2 | 3 | 4 | 5 | 6 | 7 | 8 | 9 |
|---|---|---|---|---|---|---|---|---|---|
| Time | 46 | 40 | 45 | 34 | 36 | 38 | 39 | 40 | 33 |
A least squares line is fitted to the data. The equation of this line predicts that on day 10 the time Oscar spends walking will be the same as the time he spent walking on
- A. day 3
- B. day 4
- C. day 6
- D. day 8
- E. day 9
The table below shows the weight, in kilograms, and the height, in centimetres, of 10 adults.
| Weight (kg) | Height (cm) |
|---|---|
| 59 | 173 |
| 67 | 180 |
| 69 | 184 |
| 84 | 195 |
| 64 | 173 |
| 74 | 180 |
| 76 | 192 |
| 56 | 169 |
| 58 | 164 |
| 66 | 180 |
A least squares line is fitted to the data.
The least squares line enables an adult’s weight to be predicted from their height.
The number of times that the predicted value of an adult’s weight is greater than the actual value of their weight is
- A. 3
- B. 4
- C. 5
- D. 6
- E. 7
The time series plot below shows the quarterly sales, in thousands of dollars, of a small business for the years 2010 to 2020.
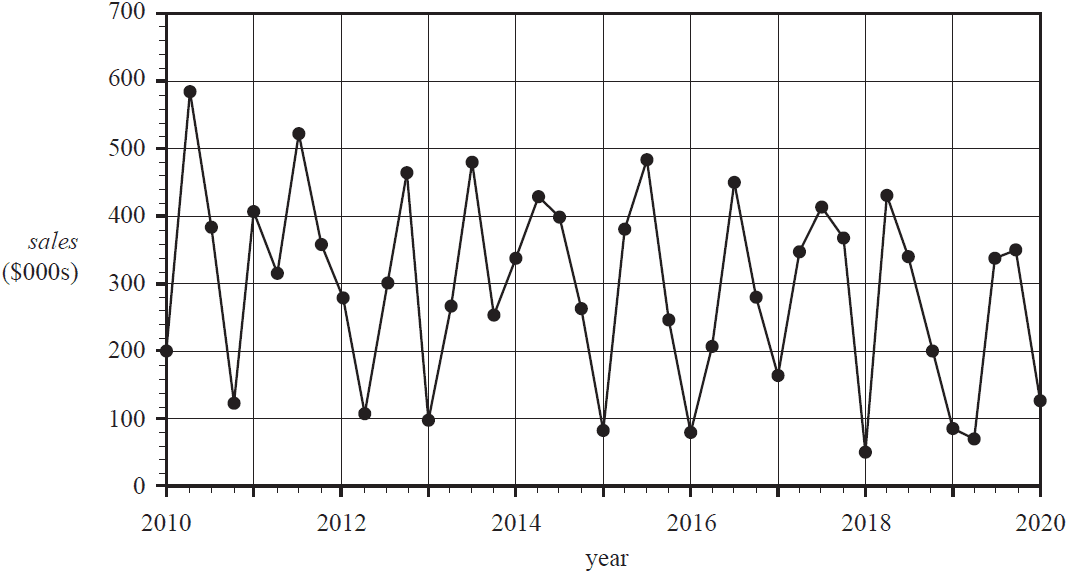
The time series plot is best described as having
- A. seasonality only.
- B. irregular fluctuations only.
- C. seasonality with irregular fluctuations.
- D. a decreasing trend with irregular fluctuations.
- E. a decreasing trend with seasonality and irregular fluctuations.
The time series plot below shows the points scored by a basketball team over 40 games.
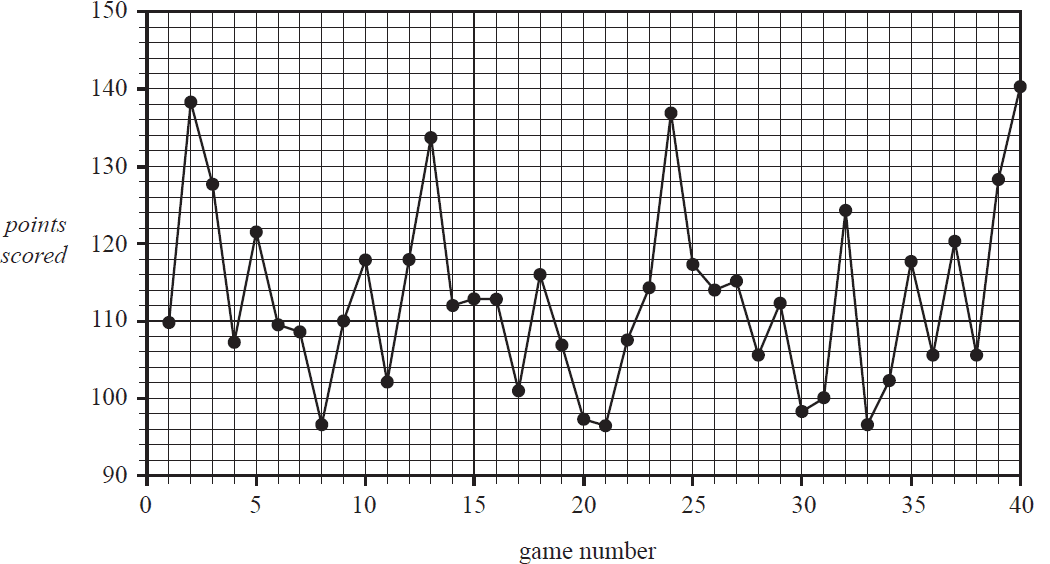
The nine-median smoothed points scored for game number 10 is closest to
- A. 102
- B. 108
- C. 110
- D. 112
- E. 117
A garden centre sells garden soil. The table below shows the daily quantity of garden soil sold, in cubic metres, over a one-week period.
| Day | Monday | Tuesday | Wednesday | Thursday | Friday | Saturday | Sunday |
|---|---|---|---|---|---|---|---|
| Quantity (m³) | 234 | 186 | 346 | 346 |
The quantity of garden soil sold on Wednesday, Thursday and Friday is not shown.
The five-mean smoothed quantity of garden soil sold on Thursday is 206 m³.
The three-mean smoothed quantity of garden soil sold on Thursday, in cubic metres, is
- A. 143
- B. 166
- C. 206
- D. 239
- E. 403
The table below shows the number of visitors to an art gallery during the summer, autumn, winter and spring quarters for the years 2017 to 2019. The quarterly average is also shown for each of these years.
| Season | 2017 | 2018 | 2019 |
|---|---|---|---|
| summer quarter | 29 685 | 25 420 | 31 496 |
| autumn quarter | 27 462 | 23 320 | 29 874 |
| winter quarter | 25 564 | 21 097 | 27 453 |
| spring quarter | 26 065 | 22 897 | 28 149 |
| Quarterly average | 27 194.0 | 23 183.5 | 29 243.0 |
The seasonal index for summer is closest to
- A. 1.077
- B. 1.081
- C. 1.088
- D. 1.092
- E. 1.096
The number of visitors to a regional animal park is seasonal. Data is collected and deseasonalised before a least squares line is fitted. The equation of the least squares line is
deseasonalised number of visitors = 2349 – 198.5 × month number
where month number 1 is January 2020. The seasonal indices for the 12 months of 2020 are shown in the table below.
| Month number | 1 | 2 | 3 | 4 | 5 | 6 | 7 | 8 | 9 | 10 | 11 | 12 |
|---|---|---|---|---|---|---|---|---|---|---|---|---|
| Seasonal index | 1.10 | 1.25 | 1.15 | 0.95 | 0.85 | 0.75 | 0.80 | 0.85 | 0.95 | 1.10 | 1.15 | 1.10 |
The actual number of visitors predicted for February 2020 was closest to
- A. 1562
- B. 1697
- C. 1952
- D. 2245
- E. 2440
Recursion and financial modelling
Question 17The following recurrence relation can generate a sequence of numbers.
\(L_0 = 37, L_{n+1} = L_n + C\)
The value of \(L_2\) is 25.
The value of \(C\) is
- A. –6
- B. –4
- C. 4
- D. 6
- E. 37
Use the following information to answer Questions 18 and 19.
Deepa invests $500 000 in an annuity that provides an annual payment of $44 970.55. Interest is calculated annually. The first five lines of the amortisation table are shown below.
| Payment number | Payment ($) | Interest ($) | Principal reduction ($) | Balance ($) |
|---|---|---|---|---|
| 0 | 0.00 | 0.00 | 0.00 | 500 000.00 |
| 1 | 44 970.55 | 20 000.00 | 24 970.55 | 475 029.45 |
| 2 | 44 970.55 | 19 001.18 | 25 969.37 | 449 060.08 |
| 3 | 44 970.55 | 17 962.40 | 422 051.93 | |
| 4 | 44 970.55 | 16 882.08 | 28 088.47 | 393 963.46 |
The principal reduction associated with payment number 3 is
- A. $17 962.40
- B. $25 969.37
- C. $27 008.15
- D. $28 088.47
- E. $44 970.55
The number of years, in total, for which Deepa will receive the regular payment of $44 970.55 is closest to
- A. 12
- B. 15
- C. 16
- D. 18
- E. 20
Sammy purchased a boat for $72 000. The value of the boat is depreciated each year by 10% using the reducing balance method. In the third year, the boat will depreciate in value by 10% of
- A. $47 239.20
- B. $52 488.00
- C. $58 320.00
- D. $64 800.00
- E. $72 000.00
Enrico invests $3000 in an account that pays interest compounding monthly. After four years, the balance of the account is $3728.92. The effective annual interest rate for this investment, rounded to two decimal places, is
- A. 5.45%
- B. 5.52%
- C. 5.56%
- D. 5.59%
- E. 5.60%
Joanna deposited $12 000 in an investment account earning interest at the rate of 2.8% per annum, compounding monthly. She would like this account to reach a balance of $25 000 after five years. To achieve this balance, she will make an extra payment into the account each month, immediately after the interest is calculated. The minimum value of this payment is closest to
- A. $113.85
- B. $174.11
- C. $580.16
- D. $603.22
- E. $615.47
Bimal has a reducing balance loan. The balance, in dollars, of the loan from month to month, \(B_n\), is modelled by the recurrence relation below.
\(B_0 = 450 000, B_{n+1} = R B_n - 2633\)
Given that the loan will be fully repaid in 20 years, the value of \(R\) is closest to
- A. 1.003
- B. 1.0036
- C. 1.03
- D. 1.036
- E. 1.36
Bob borrowed $400 000 to buy an apartment. The interest rate for this loan was 3.14% per annum, compounding monthly. A scheduled monthly repayment that allowed Bob to fully repay the loan in 20 years was determined. Bob decided, however, to make interest-only repayments for the first two years. After these two years the interest rate changed. Bob was still able to pay off the loan in the 20 years by repaying the scheduled amount each month. The interest rate, per annum, for the final 18 years of the loan was closest to
- A. 1.85%
- B. 2.21%
- C. 2.79%
- D. 3.14%
- E. 4.07%
SECTION B – Modules
Module 1 – Matrices
Question 1If matrix \( M = \begin{bmatrix} 3 & 2 \\ 8 & 9 \\ 13 & 7 \end{bmatrix} \), then its transpose, \(M^T\), is
- A. \( \begin{bmatrix} 2 & 3 \\ 9 & 8 \\ 7 & 13 \end{bmatrix} \)
- B. \( \begin{bmatrix} 2 & 9 & 7 \\ 3 & 8 & 13 \end{bmatrix} \)
- C. \( \begin{bmatrix} 7 & 9 & 2 \\ 13 & 8 & 3 \end{bmatrix} \)
- D. \( \begin{bmatrix} 3 & 8 & 13 \\ 2 & 9 & 7 \end{bmatrix} \)
- E. \( \begin{bmatrix} 13 & 8 & 3 \\ 7 & 9 & 2 \end{bmatrix} \)
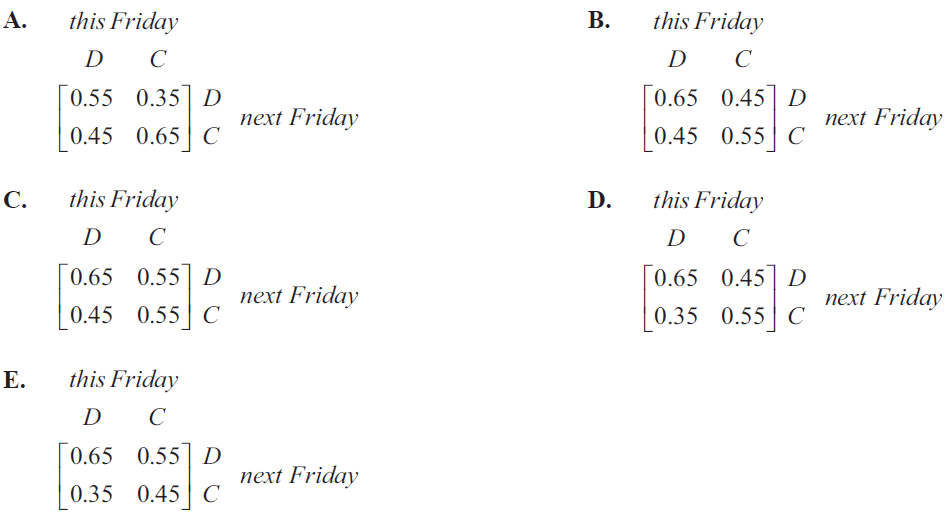
Every Friday, the same number of workers from a large office building regularly purchase their lunch from one of two locations: the deli, \(D\), or the cafe, \(C\).
It has been found that:
- of the workers who purchase lunch from the deli on one Friday, 65% will return to purchase from the deli on the next Friday
- of the workers who purchase lunch from the cafe on one Friday, 55% will return to purchase from the cafe on the next Friday.
A transition matrix that can be used to describe this situation is
\(ax + 4y = 10\)
\(18x + by = 6\)
The set of simultaneous linear equations above does not have a unique solution when
- A. \(a = 2, b = 36\)
- B. \(a = 3, b = 22\)
- C. \(a = 4, b = 20\)
- D. \(a = 5, b = 12\)
- E. \(a = 6, b = 14\)
Ramon and Norma are names that contain the same letters but in a different order.
The permutation matrix that can change \( \begin{bmatrix} R \\ A \\ M \\ O \\ N \end{bmatrix} \) into \( \begin{bmatrix} N \\ O \\ R \\ M \\ A \end{bmatrix} \) is
- A. \( \begin{bmatrix} 0 & 0 & 0 & 0 & 1 \\ 1 & 0 & 0 & 0 & 0 \\ 0 & 0 & 1 & 0 & 0 \\ 0 & 1 & 0 & 0 & 0 \\ 0 & 0 & 0 & 1 & 0 \end{bmatrix} \)
- B. \( \begin{bmatrix} 0 & 0 & 0 & 0 & 1 \\ 0 & 0 & 0 & 1 & 0 \\ 0 & 0 & 1 & 0 & 0 \\ 1 & 0 & 0 & 0 & 0 \\ 0 & 1 & 0 & 0 & 0 \end{bmatrix} \)
- C. \( \begin{bmatrix} 1 & 0 & 0 & 0 & 0 \\ 0 & 0 & 0 & 1 & 0 \\ 0 & 0 & 0 & 0 & 1 \\ 0 & 0 & 1 & 0 & 0 \\ 0 & 1 & 0 & 0 & 0 \end{bmatrix} \)
- D. \( \begin{bmatrix} 0 & 0 & 0 & 0 & 1 \\ 0 & 0 & 0 & 1 & 0 \\ 1 & 0 & 0 & 0 & 0 \\ 0 & 1 & 0 & 0 & 0 \\ 0 & 0 & 1 & 0 & 0 \end{bmatrix} \)
- E. \( \begin{bmatrix} 0 & 0 & 0 & 0 & 1 \\ 0 & 0 & 0 & 1 & 0 \\ 1 & 0 & 0 & 0 & 0 \\ 0 & 0 & 1 & 0 & 0 \\ 0 & 1 & 0 & 0 & 0 \end{bmatrix} \)
\(A\) is a \(7 \times 7\) matrix.
\(B\) is a \(10 \times 7\) matrix.
Which one of the following matrix expressions is defined?
- A. \(AB - 2B\)
- B. \(A(BA)^{-1}\)
- C. \(AB^2\)
- D. \(A^2 - BA\)
- E. \(A(B^T)\)
A fitness centre offers four different exercise classes: aerobics (\(A\)), boxfit (\(B\)), cardio (\(C\)) and dance (\(D\)). A customer’s choice of fitness class is expected to change from week to week according to the transition matrix \(P\), shown below.
\[ \begin{array}{r@{\hskip 1em}c} P = \begin{array}{c} \begin{array}{cccc} \textit{this week} \\ A & B & C & D \end{array} \\[-1.2ex] \left[ \begin{array}{cccc} 0.65 & 0 & 0.20 & 0.10 \\ 0 & 0.65 & 0.10 & 0.30 \\ 0.20 & 0.10 & 0.70 & 0 \\ 0.15 & 0.25 & 0 & 0.60 \end{array} \right] \end{array} & \begin{array}{c} \\[-1.2ex] \begin{matrix} A \\ B \\ C \\ D \end{matrix} & \textit{next week} \end{array} \end{array} \]An equivalent transition diagram has been constructed below, but the labelling is not complete.
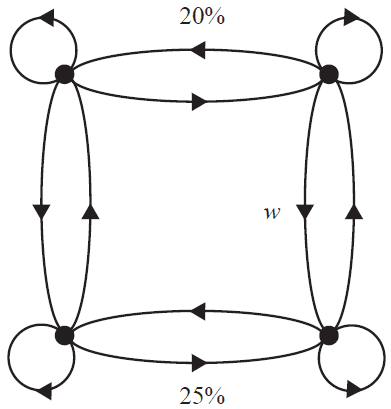
The proportion for one of the transitions is labelled \(w\). The value of \(w\) is
- A. 10%
- B. 15%
- C. 20%
- D. 25%
- E. 30%
The matrix \(S_{n+1}\) is determined from the matrix \(S_n\) using the recurrence relation \(S_{n+1} = T \times S_n - C\), where
\( T = \begin{bmatrix} 0.6 & 0.1 & 0.3 \\ 0.3 & 0.8 & 0.2 \\ 0.1 & 0.1 & 0.5 \end{bmatrix}, S_0 = \begin{bmatrix} 21 \\ 51 \\ 31 \end{bmatrix}, S_1 = \begin{bmatrix} 24.0 \\ 54.3 \\ 20.7 \end{bmatrix} \)
and \(C\) is a column matrix.
Matrix \(S_2\) is equal to
- A. \( \begin{bmatrix} 23.04 \\ 55.78 \\ 16.18 \end{bmatrix} \)
- B. \( \begin{bmatrix} 25.34 \\ 56.28 \\ 17.38 \end{bmatrix} \)
- C. \( \begin{bmatrix} 26.04 \\ 54.78 \\ 18.18 \end{bmatrix} \)
- D. \( \begin{bmatrix} 28.34 \\ 55.28 \\ 19.38 \end{bmatrix} \)
- E. \( \begin{bmatrix} 29.04 \\ 53.78 \\ 20.18 \end{bmatrix} \)
A new colony of endangered marsupials is established on a remote island. For one week, the marsupials can feed from only one of three feeding stations: \(A\), \(B\) or \(C\). On Monday, 50% of the marsupials were observed feeding at station \(A\) and 50% were observed feeding at station \(B\). No marsupials were observed feeding at station \(C\). The marsupials are expected to change their feeding stations each day this week according to the transition matrix \(T\).
\[ \begin{array}{r@{\hskip 1em}c} T = \begin{array}{c} \begin{array}{ccc} \textit{this day} \\ A & B & C \end{array} \\[-1.2ex] \left[ \begin{array}{ccc} 0.4 & 0.1 & 0.2 \\ 0.2 & 0.5 & 0.2 \\ 0.4 & 0.4 & 0.6 \end{array} \right] \end{array} & \begin{array}{c} \\[-1.2ex] \begin{matrix} A \\ B \\ C \end{matrix} & \textit{next day} \end{array} \end{array} \]Let \(S_n\) represent the state matrix showing the percentage of marsupials observed feeding at each feeding station \(n\) days after Monday of this week.
The matrix recurrence rule \(S_{n+1} = TS_n\) is used to model this situation.
From Tuesday to Wednesday, the percentage of marsupials who are not expected to change their feeding location is
- A. 44.5%
- B. 45%
- C. 50%
- D. 51.5%
- E. 52%
Module 2 – Networks and decision mathematics
Question 1Consider the graph below.
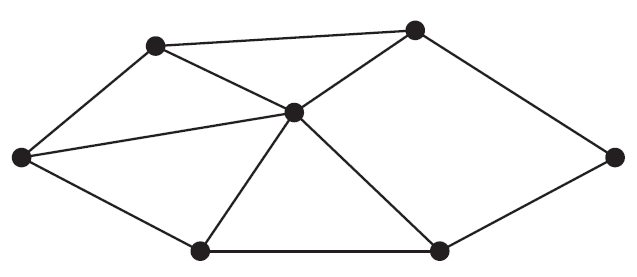
The number of vertices with a degree of 3 is
- A. 1
- B. 2
- C. 3
- D. 4
- E. 5
Five friends ate fruit for morning tea. The bipartite graph below shows which types of fruit each friend ate.
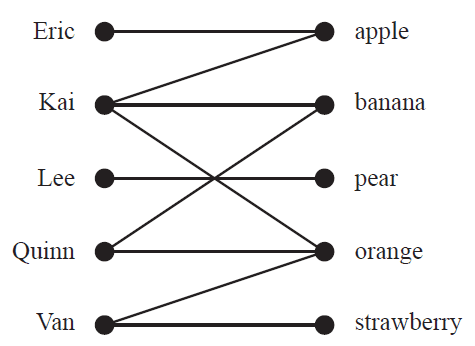
Which one of the following statements is not true?
- A. Only Lee ate pear.
- B. Eric and Kai each ate apple.
- C. Van ate only strawberry.
- D. Quinn and Kai each ate banana.
- E. Orange was the most eaten type of fruit.
Consider the graph below.
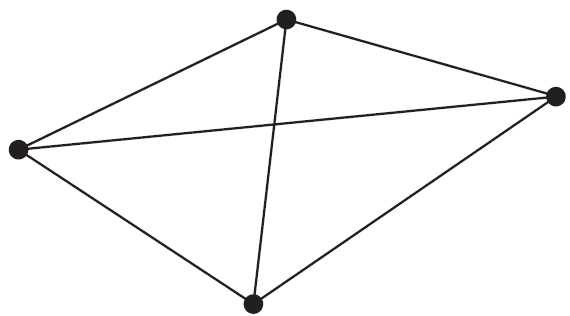
The number of faces is
- A. 2
- B. 3
- C. 4
- D. 5
- E. 6
Consider the directed network below.
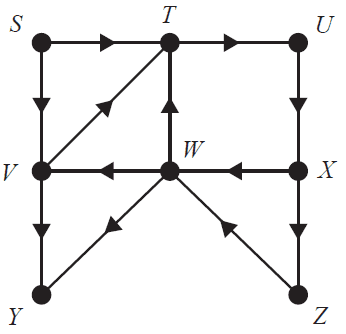
The number of vertices that cannot be reached from \(X\) is
- A. 1
- B. 2
- C. 3
- D. 4
- E. 5
Consider the following five statements about the graph above:
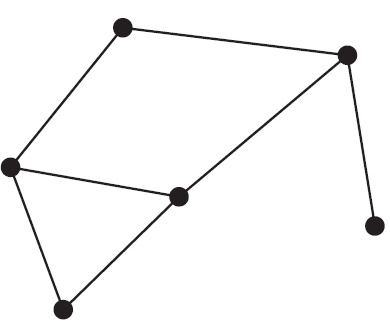
- The graph is planar.
- The graph contains a cycle.
- The graph contains a bridge.
- The graph contains an Eulerian trail.
- The graph contains a Hamiltonian path.
How many of these statements are true?
- A. 1
- B. 2
- C. 3
- D. 4
- E. 5
The directed graph below shows the sequence of activities required to complete a project. The time taken to complete each activity, in hours, is also shown.
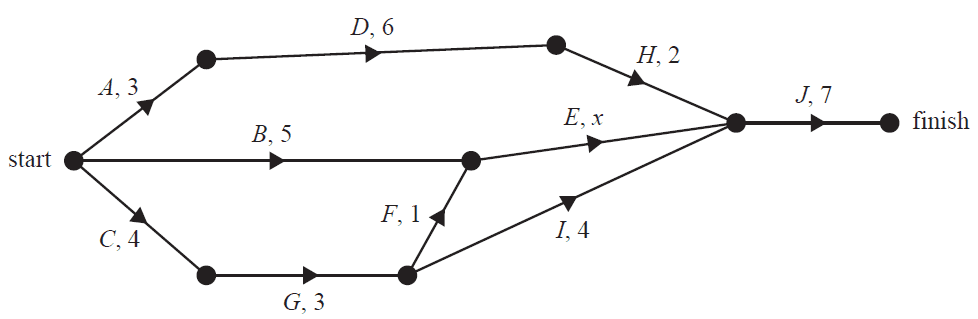
The minimum completion time for this project is 18 hours. The time taken to complete activity \(E\) is labelled \(x\). The maximum value of \(x\) is
- A. 2
- B. 3
- C. 4
- D. 5
- E. 6
The network below shows the pathways between five buildings: \(J, K, L, M\) and \(N\).
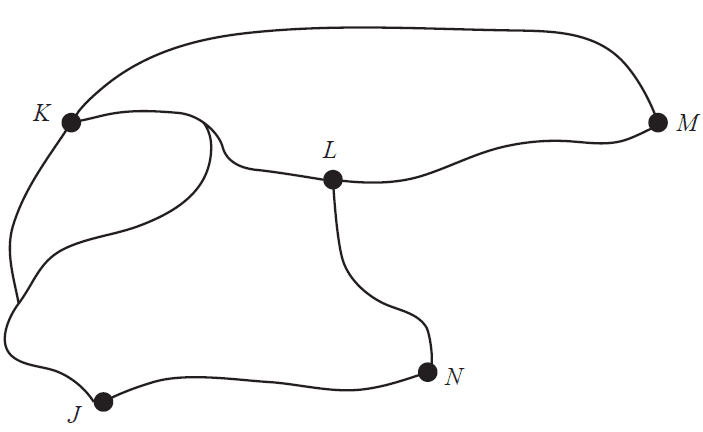
An adjacency matrix for this network is formed. The number of zeros in this matrix is
- A. 8
- B. 9
- C. 10
- D. 11
- E. 12
A network of roads connecting towns in an alpine region is shown below. The distances between neighbouring towns, represented by the vertices, are given in kilometres.
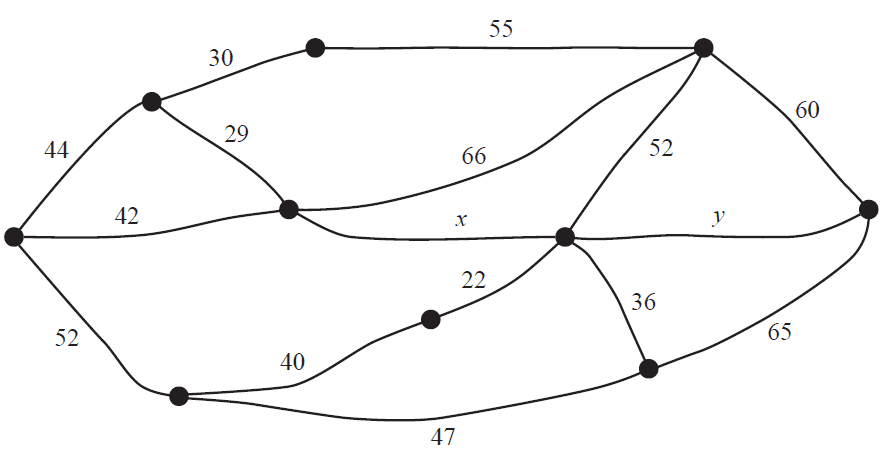
The region receives a large snowfall, leaving all roads between the towns closed to traffic. To ensure each town is accessible by car from every other town, some roads will be cleared. The minimum total length of road, in kilometres, that needs to be cleared is
- A. 361 if \(x = 50\) and \(y = 55\)
- B. 361 if \(x = 50\) and \(y = 60\)
- C. 366 if \(x = 55\) and \(y = 55\)
- D. 366 if \(x = 55\) and \(y = 60\)
- E. 371 if \(x = 55\) and \(y = 65\)
Module 3 – Geometry and measurement
Question 1Which one of the following cities is closest to the Greenwich meridian?
- A. Barcelona (41° N, 2° E)
- B. Berlin (53° N, 13° E)
- C. Edinburgh (56° N, 3° W)
- D. Lomé (6° N, 1° E)
- E. Nairobi (1° S, 37° E)
A clock displayed the time one o’clock, as shown on the diagram below.
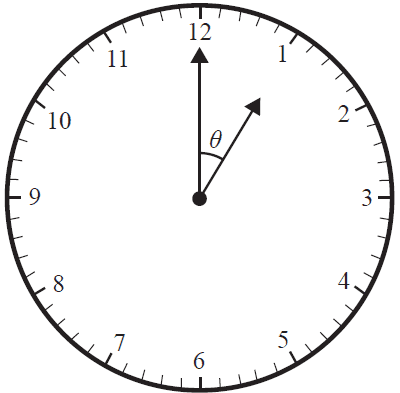
The angle, \(\theta\), between the small hand and the large hand is
- A. 5°
- B. 12°
- C. 30°
- D. 36°
- E. 60°
A photograph was enlarged by an area scale factor of 9. The length of the original photograph was 12 cm. The original photograph and the enlarged photograph are similar in shape. The length of the enlarged photograph, in centimetres, is
- A. 4
- B. 9
- C. 27
- D. 36
- E. 108
The side length of an equilateral triangle is 4 cm, as shown in the diagram below.
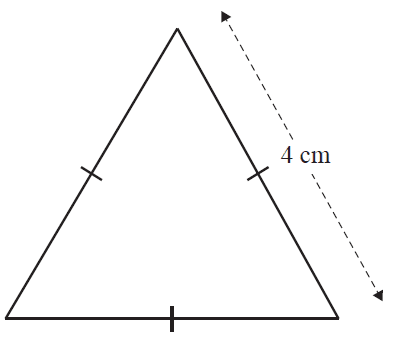
Which one of the following is not a correct calculation for the area of this triangle?
- A. \(\frac{\sqrt{3} \times 4^2}{4}\)
- B. \(2 \times \sqrt{12}\)
- C. \(\frac{1}{2} \times 4 \times 4\)
- D. \(\frac{4^2 \times \sin(60^{\circ})}{2}\)
- E. \(\sqrt{6(6-4)^3}\)
A cone and a cylinder both have a radius of \(r\) centimetres. The height of the cone is 12 cm. If the cylinder and the cone have the same volume, then the height of the cylinder, in centimetres, is
- A. 4
- B. 6
- C. 8
- D. 12
- E. 36
A child’s toy has the following design.
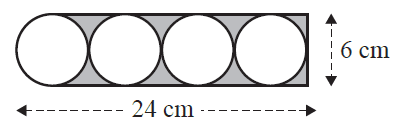
The area of the shaded region, in square centimetres, is closest to
- A. 13
- B. 27
- C. 31
- D. 45
- E. 113
A composite shape is made up of two triangles, as shown in the diagram below. Two angles, \(a^\circ\) and \(b^\circ\), are shown on the diagram.
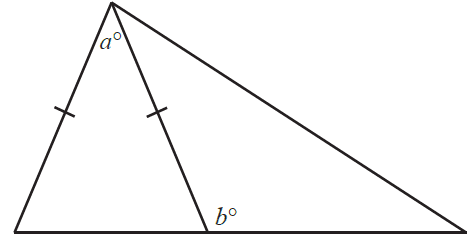
Which one of the following statements is always true?
- A. \(2a^\circ = b^\circ\)
- B. \(a^\circ = 180^\circ - b^\circ\)
- C. \(a^\circ = 180^\circ - 2b^\circ\)
- D. \(a^\circ = 2b^\circ - 180^\circ\)
- E. \(2a^\circ = 180^\circ - b^\circ\)
Rod and Lucia went on a bushwalk. They walked 1400 m from the car park to reach a lookout that was directly east of the car park. From the lookout, Rod returned to the car park via a cafe and Lucia returned to the car park via a swimming hole.
- The bearing of the swimming hole from the lookout is 290°.
- The bearing of the cafe from the lookout is 240°.
- The swimming hole is 950 m from the car park.
- The cafe is 700 m from the car park.
- The swimming hole is closer to the lookout than it is to the car park.
In relation to the total distance each of them individually walked from the lookout back to the car park, which one of the following statements is true?
- A. Rod and Lucia walked the same distance.
- B. Rod walked 467 m further than Lucia, to the nearest metre.
- C. Rod walked 717 m further than Lucia, to the nearest metre.
- D. Lucia walked 924 m further than Rod, to the nearest metre.
- E. Lucia walked 1174 m further than Rod, to the nearest metre.
Module 4 – Graphs and relations
Question 1The graph below shows the average number of sunlight hours per day for each month of a particular year.
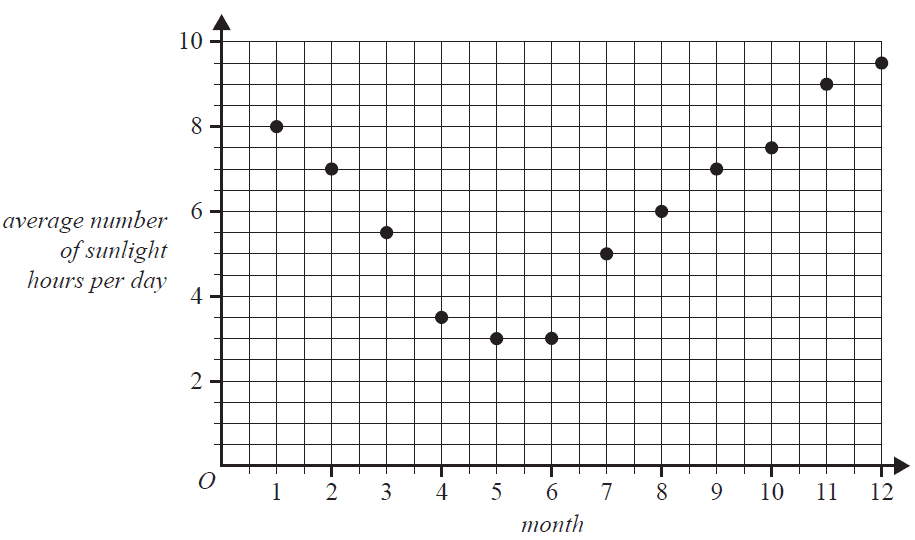
The number of months for which the average number of sunlight hours per day was recorded as being below four hours is
- A. 2
- B. 3
- C. 4
- D. 5
- E. 6
Which one of the following represents a line with the same slope as \(y = 2x + 3\)?
- A. \(y - 2x = 0\)
- B. \(y + 2x = 0\)
- C. \(y = 3x + 2\)
- D. \(y + 2x = 3\)
- E. \(2y + 3 = x\)
A line passes through the points (8, 0), (0, 6) and (5, \(m\)).
The value of \(m\) is
- A. 1.25
- B. 1.33
- C. 2.15
- D. 2.25
- E. 2.45
A railway station in the city has two car parks, Eastpark and Northpark.
At Eastpark, cars can be parked for up to 10 hours per day.
The fees for Eastpark are as follows.
\[ \text{fee} = \begin{cases} \$6, & 0 < \text{hours} \le 3 \\ \$10, & 3 < \text{hours} \le 6 \\ \$14, & 6 < \text{hours} \le 10 \end{cases} \]
Northpark charges fees according to the formula
fee = $2.30 × hours
Lani wants to park her car for seven hours on Wednesday and four hours on Thursday.
She may choose either car park on each day.
The minimum total fee that Lani will pay for parking for the two days is
- A. $16.00
- B. $20.00
- C. $23.20
- D. $24.00
- E. $25.30
A manufacturer makes and sells heaters.
The fixed cost to manufacture the heaters is $16 000 per month.
Each heater costs $52 to produce.
The selling price of each heater is $280.
The minimum number of heaters needed to be sold per month in order to make a profit is
- A. 48
- B. 49
- C. 57
- D. 70
- E. 71
The graph below shows a relationship between \(\frac{1}{x}\) and \(y\).
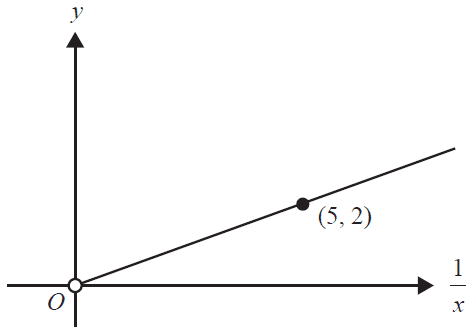
The rule that represents this relationship between \(x\) and \(y\) is
- A. \(y = \frac{1}{10x}\)
- B. \(y = \frac{5}{2x}\)
- C. \(y = \frac{10}{x}\)
- D. \(y = \frac{2}{5x}\)
- E. \(y = \frac{x}{10}\)
The feasible region for a linear programming problem is shaded in the diagram below.
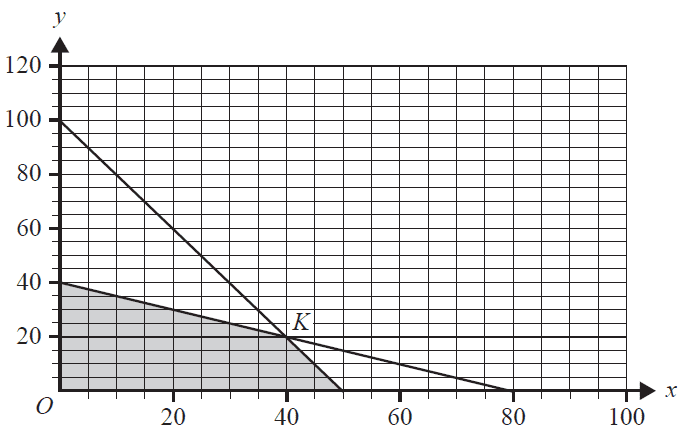
Which objective function, \(Z\), will not have a maximum value at the point \(K\)?
- A. \(Z = x + y\)
- B. \(Z = x + 3y\)
- C. \(Z = 2x + 3y\)
- D. \(Z = 3x + 2y\)
- E. \(Z = 5x + 3y\)
A company produces two types of tennis racquets: the Smash and the Volley. Let \(x\) be the number of Smash tennis racquets that are produced each week. Let \(y\) be the number of Volley tennis racquets that are produced each week. The constraints on the production of these tennis racquets are given by the following set of inequalities.
\(x \ge 0\)
\(y \ge 0\)
\(x + 2y \le 100\)
\(x + y \ge 20\)
\(x \le 60\)
The graph below shows the lines that represent the boundaries of these inequalities.
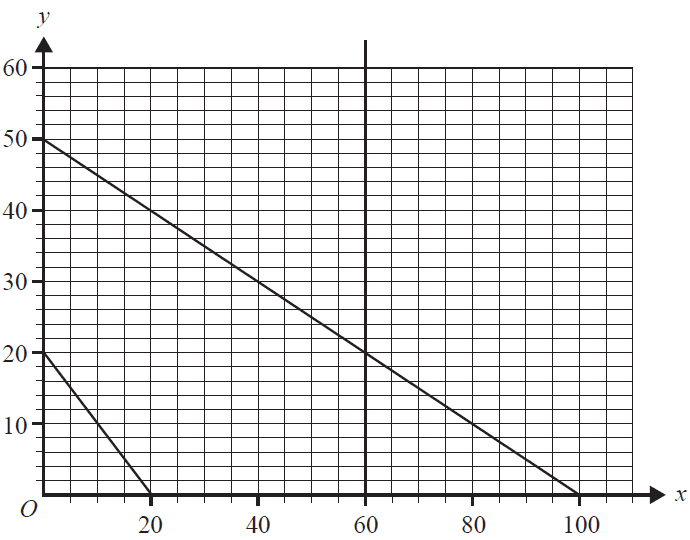
The profit, \(P\), that the company can make each week from the sale of these tennis racquets is in the form \(P = ax + by\). The maximum profit will occur when 20 Smash tennis racquets and 40 Volley tennis racquets are sold each week. If \(a = 15\), the maximum profit is
- A. 600
- B. 900
- C. 1000
- D. 1200
- E. 1500
End of Multiple-Choice Question Book
VCE is a registered trademark of the VCAA. The VCAA does not endorse or make any warranties regarding this study resource. Past VCE exams and related content can be accessed directly at www.vcaa.vic.edu.au
