2020 VCE Further Maths Exam 1
This is the full VCE Further Maths Exam with worked solutions. You can also try Mini-Tests, which are official VCAA exams split into short tests you can do anytime.
Number of marks: 40
Reading time: 15 minutes
Writing time: 1.5 hours
Instructions
• Answer all questions in pencil on your Multiple-Choice Answer Sheet.
• Choose the response that is correct for the question.
• A correct answer scores 1; an incorrect answer scores 0.
• Marks will not be deducted for incorrect answers.
• No marks will be given if more than one answer is completed for any question.
• Unless otherwise indicated, the diagrams in this book are not drawn to scale.
Data analysis
Use the following information to answer Questions 1–3.
The times between successive nerve impulses (time), in milliseconds, were recorded. Table 1 shows the mean and the five-number summary calculated using 800 recorded data values.
| Table 1 | |
|---|---|
| Time (milliseconds) | |
| Mean | 220 |
| Minimum value | 10 |
| First quartile (\(Q_1\)) | 70 |
| Median | 150 |
| Third quartile (\(Q_3\)) | 300 |
| Maximum value | 1380 |
The difference, in milliseconds, between the mean time and the median time is
- A. 10
- B. 70
- C. 150
- D. 220
- E. 230
Of these 800 times, the number of times that are longer than 300 milliseconds is closest to
- A. 20
- B. 25
- C. 75
- D. 200
- E. 400
The shape of the distribution of these 800 times is best described as
- A. approximately symmetric.
- B. positively skewed.
- C. positively skewed with one or more outliers.
- D. negatively skewed.
- E. negatively skewed with one or more outliers.
The histogram below shows the distribution of the forearm circumference, in centimetres, of 252 men. Assume that the forearm circumference values were all rounded to one decimal place.
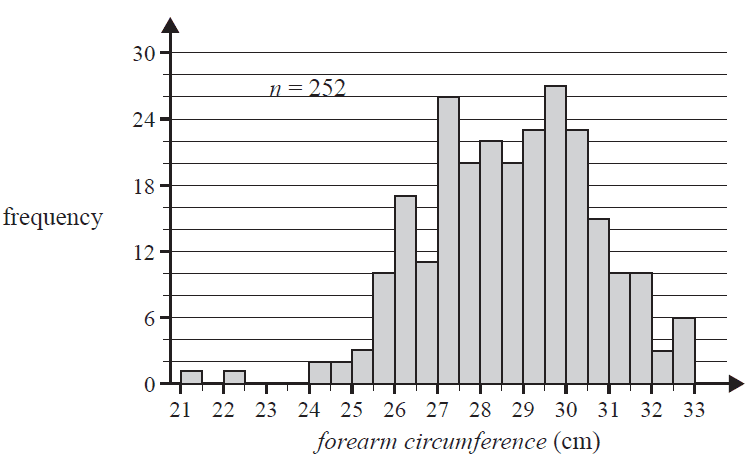
The third quartile (\(Q_3\)) for this distribution could be
- A. 29.3
- B. 29.8
- C. 30.3
- D. 30.8
- E. 31.3
The histogram below shows the distribution of weight, in grams, for a sample of 20 animal species. The histogram has been plotted on a \(\log_{10}\) scale.
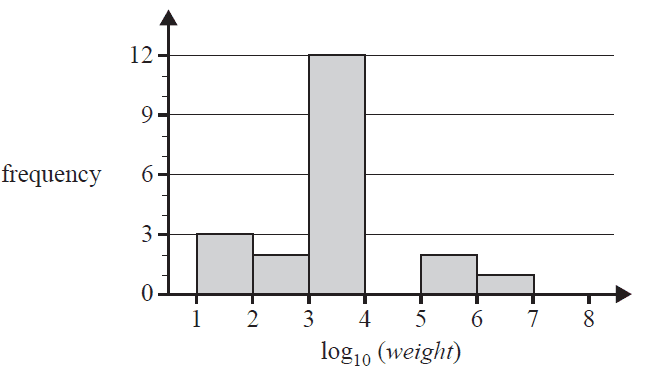
The percentage of these animal species with a weight of less than 10 000 g is
- A. 17%
- B. 70%
- C. 75%
- D. 80%
- E. 85%
A percentaged segmented bar chart would be an appropriate graphical tool to display the association between month of the year (January, February, March, etc.) and the
- A. monthly average rainfall (in millimetres).
- B. monthly mean temperature (in degrees Celsius).
- C. annual median wind speed (in kilometres per hour).
- D. monthly average rainfall (below average, average, above average).
- E. annual average temperature (in degrees Celsius).
Data relating to the following five variables was collected from insects that were caught overnight in a trap:
- colour
- name of species
- number of wings
- body length (in millimetres)
- body weight (in milligrams)
The number of these variables that are discrete numerical variables is
- A. 1
- B. 2
- C. 3
- D. 4
- E. 5
The wing length of a species of bird is approximately normally distributed with a mean of 61 mm and a standard deviation of 2 mm.
Using the 68–95–99.7% rule, for a random sample of 10 000 of these birds, the number of these birds with a wing length of less than 57 mm is closest to
- A. 50
- B. 160
- C. 230
- D. 250
- E. 500
The lifetime of a certain brand of light globe, in hours, is approximately normally distributed.
It is known that 16% of the light globes have a lifetime of less than 655 hours and 50% of the light globes have a lifetime that is greater than 670 hours.
The mean and the standard deviation of this normal distribution are closest to
- A. mean = 655 hours, standard deviation = 10 hours
- B. mean = 655 hours, standard deviation = 15 hours
- C. mean = 670 hours, standard deviation = 10 hours
- D. mean = 670 hours, standard deviation = 15 hours
- E. mean = 670 hours, standard deviation = 20 hours
Use the following information to answer Questions 10–12.
The data in Table 2 was collected in a study of the association between the variables frequency of nightmares (low, high) and snores (no, yes).
| Frequency of nightmares | Snores | Total | |
|---|---|---|---|
| No | Yes | ||
| low | 80 | 58 | 138 |
| high | 11 | 12 | 23 |
| Total | 91 | 70 | 161 |
The variables in this study, frequency of nightmares (low, high) and snores (no, yes), are
- A. ordinal and nominal respectively.
- B. nominal and ordinal respectively.
- C. both numerical.
- D. both ordinal.
- E. both nominal.
The percentage of participants in the study who did not snore is closest to
- A. 42.0%
- B. 43.5%
- C. 49.7%
- D. 52.2%
- E. 56.5%
Of those people in the study who did snore, the percentage who have a high frequency of nightmares is closest to
- A. 7.5%
- B. 17.1%
- C. 47.8%
- D. 52.2%
- E. 58.0%
A least squares line of the form \(y = a + bx\) is fitted to a scatterplot.
Which one of the following is always true?
- A. As many of the data points in the scatterplot as possible will lie on the line.
- B. The data points in the scatterplot will be divided so that there are as many data points above the line as there are below the line.
- C. The sum of the squares of the shortest distances from the line to each data point will be a minimum.
- D. The sum of the squares of the horizontal distances from the line to each data point will be a minimum.
- E. The sum of the squares of the vertical distances from the line to each data point will be a minimum.
In a study, the association between the number of tasks completed on a test and the time allowed for the test, in hours, was found to be non-linear.
The data can be linearised using a \(\log_{10}\) transformation applied to the variable number of tasks.
The equation of the least squares line for the transformed data is
\(\log_{10}(\text{number of tasks}) = 1.160 + 0.03617 \times \text{time}\)
This equation predicts that the number of tasks completed when the time allowed for the test is three hours is closest to
- A. 13
- B. 16
- C. 19
- D. 25
- E. 26
Use the following information to answer Questions 15 and 16.
Table 3 below shows the long-term mean rainfall, in millimetres, recorded at a weather station, and the associated long-term seasonal indices for each month of the year.
The long-term mean rainfall for December is missing.
| Jan. | Feb. | Mar. | Apr. | May | June | July | Aug. | Sep. | Oct. | Nov. | Dec. | |
|---|---|---|---|---|---|---|---|---|---|---|---|---|
| Mean rainfall (mm) | 51.9 | 52.3 | 52.8 | 66.6 | 87.1 | 69.4 | 73.0 | 79.9 | 82.6 | 82.4 | 81.1 | |
| Seasonal index | 0.728 | 0.734 | 0.741 | 0.934 | 1.222 | 0.973 | 1.024 | 1.121 | 1.159 | 1.156 | 1.138 | 1.072 |
To correct the rainfall in March for seasonality, the actual rainfall should be, to the nearest per cent
- A. decreased by 26%
- B. increased by 26%
- C. decreased by 35%
- D. increased by 35%
- E. increased by 74%
The long-term mean rainfall for December is closest to
- A. 64.7 mm
- B. 65.1 mm
- C. 71.3 mm
- D. 76.4 mm
- E. 82.0 mm
Use the following information to answer Questions 17 and 18.
Table 4 below shows the monthly rainfall for 2019, in millimetres, recorded at a weather station, and the associated long-term seasonal indices for each month of the year.
| Jan. | Feb. | Mar. | Apr. | May | June | July | Aug. | Sep. | Oct. | Nov. | Dec. | |
|---|---|---|---|---|---|---|---|---|---|---|---|---|
| Monthly rainfall (mm) | 18.4 | 17.6 | 46.8 | 23.6 | 92.6 | 77.2 | 80.0 | 86.8 | 93.8 | 55.2 | 97.3 | 69.4 |
| Seasonal index | 0.728 | 0.734 | 0.741 | 0.934 | 1.222 | 0.973 | 1.024 | 1.121 | 1.159 | 1.156 | 1.138 | 1.072 |
The deseasonalised rainfall for May 2019 is closest to
- A. 71.3 mm
- B. 75.8 mm
- C. 86.1 mm
- D. 88.1 mm
- E. 113.0 mm
The six-mean smoothed monthly rainfall with centring for August 2019 is closest to
- A. 67.8 mm
- B. 75.9 mm
- C. 81.3 mm
- D. 83.4 mm
- E. 86.4 mm
Use the following information to answer Questions 19 and 20.
The time series plot below displays the number of airline passengers, in thousands, each month during the period January to December 1960.
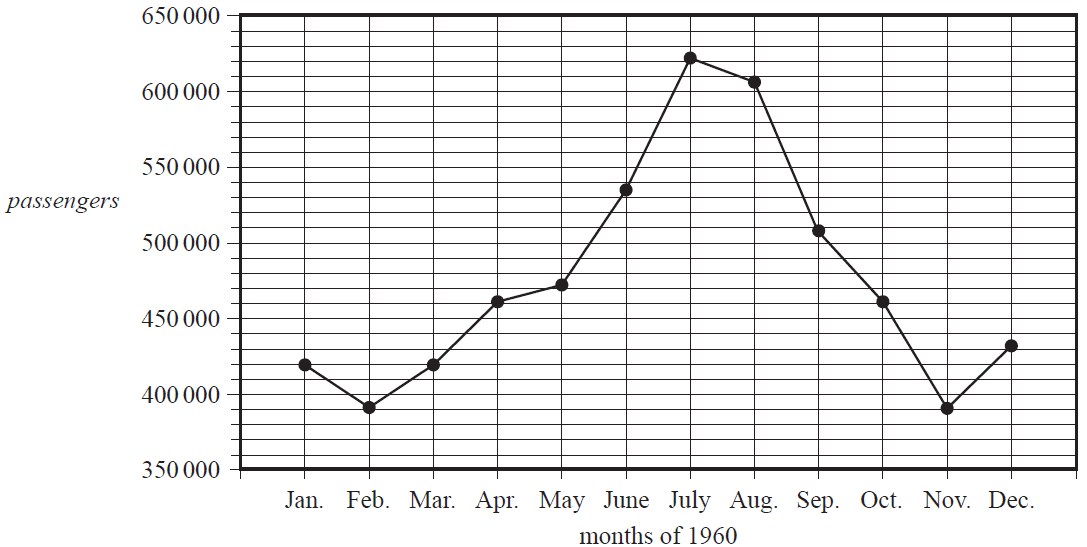
During 1960, the median number of monthly airline passengers was closest to
- A. 461 000
- B. 465 000
- C. 471 000
- D. 573 000
- E. 621 000
During the period January to May 1960, the total number of airline passengers was 2 160 000.
The five-mean smoothed number of passengers for March 1960 is
- A. 419 000
- B. 424 000
- C. 430 000
- D. 432 000
- E. 434 000
Recursion and financial modelling
The following recurrence relation can generate a sequence of numbers.
\(T_0 = 10, \quad T_{n+1} = T_n + 3\)
The number 13 appears in this sequence as
- A. \(T_1\)
- B. \(T_2\)
- C. \(T_3\)
- D. \(T_{10}\)
- E. \(T_{13}\)
An asset is purchased for $2480.
The value of this asset after \(n\) time periods, \(V_n\), can be determined using the rule
\(V_n = 2480 + 45n\)
A recurrence relation that also models the value of this asset after \(n\) time periods is
- A. \(V_0 = 2480, \quad V_{n+1} = V_n + 45n\)
- B. \(V_1 = 2480, \quad V_{n+1} = V_n + 45n\)
- C. \(V_0 = 2480, \quad V_{n+1} = V_n + 45\)
- D. \(V_1 = 2480, \quad V_{n+1} = V_n + 45\)
- E. \(V_n = 2480, \quad V_{n+1} = V_n + 45\)
Consider the following four recurrence relations representing the value of an asset after \(n\) years, \(V_n\).
- \(V_0 = 20000, \quad V_{n+1} = V_n + 2500\)
- \(V_0 = 20000, \quad V_{n+1} = V_n - 2500\)
- \(V_0 = 20000, \quad V_{n+1} = 0.875V_n\)
- \(V_0 = 20000, \quad V_{n+1} = 1.125V_n - 2500\)
How many of these recurrence relations indicate that the value of an asset is depreciating?
- A. 0
- B. 1
- C. 2
- D. 3
- E. 4
Manu invests $3000 in an account that pays interest compounding monthly. The balance of his investment after \(n\) months, \(B_n\), can be determined using the recurrence relation
\(B_0 = 3000, \quad B_{n+1} = 1.0048 \times B_n\)
The total interest earned by Manu's investment after the first five months is closest to
- A. $57.60
- B. $58.02
- C. $72.00
- D. $72.69
- E. $87.44
The graph below represents the value of an annuity investment, \(A_n\), in dollars, after \(n\) time periods.
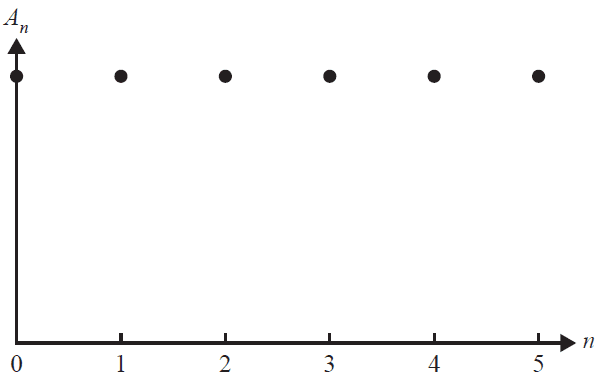
A recurrence relation that could match this graphical representation is
- A. \(A_0 = 200\,000, \quad A_{n+1} = 1.015A_n - 2500\)
- B. \(A_0 = 200\,000, \quad A_{n+1} = 1.025A_n - 5000\)
- C. \(A_0 = 200\,000, \quad A_{n+1} = 1.03A_n - 5500\)
- D. \(A_0 = 200\,000, \quad A_{n+1} = 1.04A_n - 6000\)
- E. \(A_0 = 200\,000, \quad A_{n+1} = 1.05A_n - 8000\)
Ray deposited $5000 in an investment account earning interest at the rate of 3% per annum, compounding quarterly.
A rule for the balance, \(R_n\), in dollars, after \(n\) years is given by
- A. \(R_n = 5000 \times 0.03^n\)
- B. \(R_n = 5000 \times 1.03^n\)
- C. \(R_n = 5000 \times 0.03^{4n}\)
- D. \(R_n = 5000 \times 1.0075^n\)
- E. \(R_n = 5000 \times 1.0075^{4n}\)
Gen invests $10 000 at an interest rate of 5.5% per annum, compounding annually.
After how many years will her investment first be more than double its original value?
- A. 12
- B. 13
- C. 14
- D. 15
- E. 16
The nominal interest rate for a loan is 8% per annum.
When rounded to two decimal places, the effective interest rate for this loan is not
- A. 8.33% per annum when interest is charged daily.
- B. 8.32% per annum when interest is charged weekly.
- C. 8.31% per annum when interest is charged fortnightly.
- D. 8.30% per annum when interest is charged monthly.
- E. 8.24% per annum when interest is charged quarterly.
The value of a van purchased for $45 000 is depreciated by \(k\)\% per annum using the reducing balance method.
After three years of this depreciation, it is then depreciated in the fourth year under the unit cost method at the rate of 15 cents per kilometre.
The value of the van after it travels 30 000 km in this fourth year is $26 166.24
The value of \(k\) is
- A. 9
- B. 12
- C. 14
- D. 16
- E. 18
Twenty years ago, Hector invested a sum of money in an account earning interest at the rate of 3.2% per annum, compounding monthly.
After 10 years, he made a one-off extra payment of $10 000 to the account.
For the next 10 years, the account earned interest at the rate of 2.8% per annum, compounding monthly.
The balance of his account today is $686 904.09
The sum of money Hector originally invested is closest to
- A. $355 000
- B. $370 000
- C. $377 000
- D. $384 000
- E. $385 000
Module 1 – Matrices
The matrix \(\begin{bmatrix} 1 & 0 & 0 \\ 0 & 1 & 1 \\ 1 & 0 & 1 \end{bmatrix}\) is an example of
- A. a binary matrix.
- B. an identity matrix.
- C. a triangular matrix.
- D. a symmetric matrix.
- E. a permutation matrix.
Matrix \(A = \begin{bmatrix} 1 & 2 \\ 0 & 3 \\ 1 & 0 \\ 4 & 5 \end{bmatrix}\) and matrix \(B = \begin{bmatrix} 2 & 0 & 3 & 1 \\ 4 & 5 & 2 & 0 \end{bmatrix}\)
Matrix \(Q = A \times B\).
The element in row \(i\) and column \(j\) of matrix \(Q\) is \(q_{ij}\).
Element \(q_{41}\) is determined by the calculation
- A. \(0 \times 0 + 3 \times 5\)
- B. \(1 \times 1 + 2 \times 0\)
- C. \(1 \times 2 + 2 \times 4\)
- D. \(4 \times 1 + 5 \times 0\)
- E. \(4 \times 2 + 5 \times 4\)
Matrices \(P\) and \(W\) are defined below.
\[ P = \begin{bmatrix} 0 & 0 & 1 & 0 & 0 \\ 0 & 0 & 0 & 0 & 1 \\ 0 & 1 & 0 & 0 & 0 \\ 0 & 0 & 0 & 1 & 0 \\ 1 & 0 & 0 & 0 & 0 \end{bmatrix} \quad W = \begin{bmatrix} A \\ S \\ T \\ O \\ R \end{bmatrix} \]
If \(P^n \times W = \begin{bmatrix} A \\ S \\ T \\ O \\ R \end{bmatrix}\), the value of \(n\) could be
- A. 1
- B. 2
- C. 3
- D. 4
- E. 5
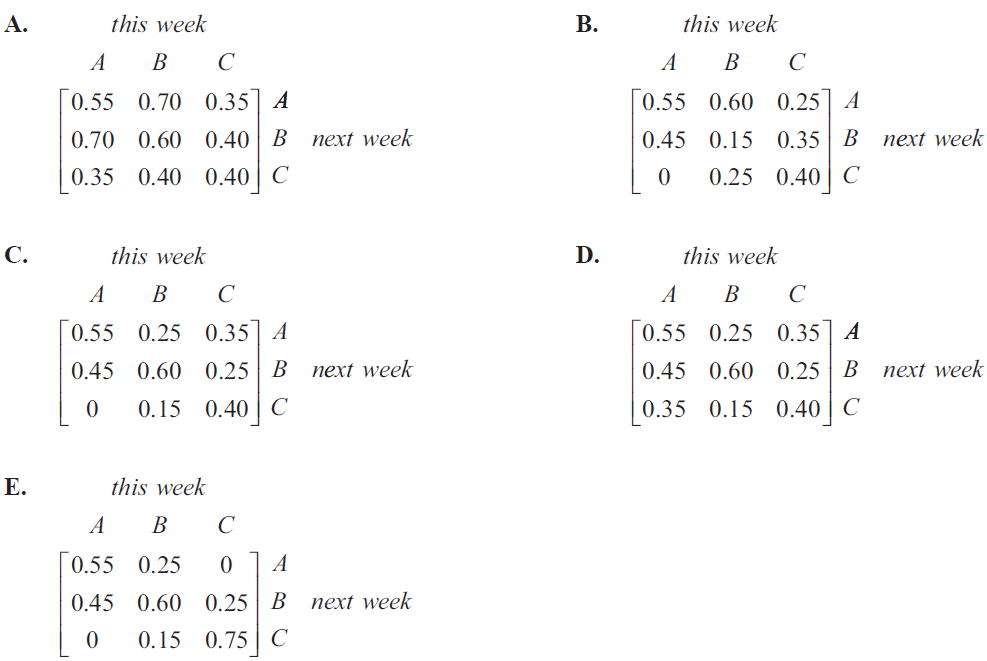
In a particular supermarket, the three top-selling magazines are Angel (\(A\)), Bella (\(B\)) and Crystal (\(C\)). The transition diagram below shows the way shoppers at this supermarket change their magazine choice from week to week.
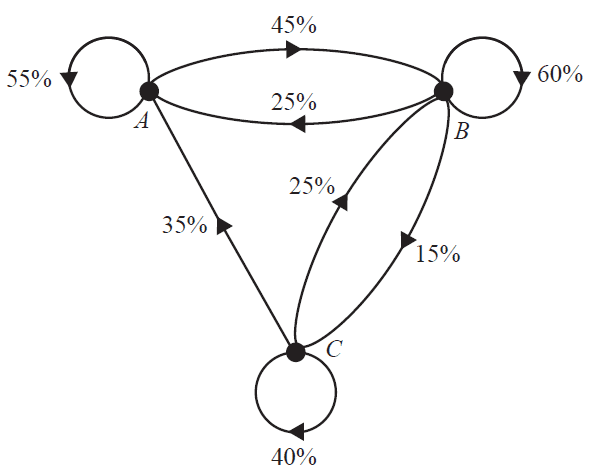
A transition matrix that provides the same information as the transition diagram is
The diagram below shows the direct communication links that exist between Sam (\(S\)), Tai (\(T\)), Umi (\(U\)) and Vera (\(V\)). For example, the arrow from Umi to Vera indicates that Umi can communicate directly with Vera.
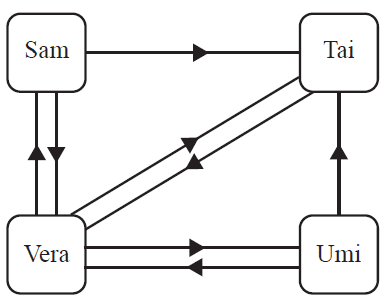
A communication matrix can be used to convey the same information.
In this matrix:
- a '1' indicates that a direct communication link exists between a sender and a receiver
- a '0' indicates that a direct communication link does not exist between a sender and a receiver.
The communication matrix could be
- A. \( \begin{array}{c@{\hskip 1em}c} \begin{array}{c} \\ \textit{sender} \\ \\ \end{array} & \begin{array}{c} \textit{receiver} \\ \begin{array}{cccc} S & T & U & V \end{array} \\ \left[ \begin{array}{cccc} 0 & 1 & 0 & 1 \\ 0 & 0 & 0 & 1 \\ 0 & 1 & 0 & 1 \\ 1 & 0 & 1 & 0 \end{array} \right] \end{array} \end{array} \begin{array}{c} \\ S \\ T \\ U \\ V \end{array} \)
- B. \( \begin{array}{c@{\hskip 1em}c} \begin{array}{c} \\ \textit{sender} \\ \\ \end{array} & \begin{array}{c} \textit{receiver} \\ \begin{array}{cccc} S & T & U & V \end{array} \\ \left[ \begin{array}{cccc} 0 & 1 & 0 & 1 \\ 1 & 0 & 0 & 1 \\ 0 & 1 & 0 & 1 \\ 1 & 1 & 1 & 0 \end{array} \right] \end{array} \end{array} \begin{array}{c} \\ S \\ T \\ U \\ V \end{array} \)
- C. \( \begin{array}{c@{\hskip 1em}c} \begin{array}{c} \\ \textit{sender} \\ \\ \end{array} & \begin{array}{c} \textit{receiver} \\ \begin{array}{cccc} S & T & U & V \end{array} \\ \left[ \begin{array}{cccc} 0 & 1 & 0 & 1 \\ 0 & 0 & 0 & 1 \\ 0 & 1 & 0 & 0 \\ 1 & 1 & 1 & 0 \end{array} \right] \end{array} \end{array} \begin{array}{c} \\ S \\ T \\ U \\ V \end{array} \)
- D. \( \begin{array}{c@{\hskip 1em}c} \begin{array}{c} \\ \textit{sender} \\ \\ \end{array} & \begin{array}{c} \textit{receiver} \\ \begin{array}{cccc} S & T & U & V \end{array} \\ \left[ \begin{array}{cccc} 0 & 1 & 0 & 1 \\ 0 & 0 & 0 & 1 \\ 0 & 1 & 0 & 1 \\ 1 & 1 & 1 & 0 \end{array} \right] \end{array} \end{array} \begin{array}{c} \\ S \\ T \\ U \\ V \end{array} \)
- E. \( \begin{array}{c@{\hskip 1em}c} \begin{array}{c} \\ \textit{sender} \\ \\ \end{array} & \begin{array}{c} \textit{receiver} \\ \begin{array}{cccc} S & T & U & V \end{array} \\ \left[ \begin{array}{cccc} 0 & 1 & 0 & 2 \\ 0 & 0 & 0 & 2 \\ 0 & 1 & 0 & 2 \\ 2 & 2 & 2 & 0 \end{array} \right] \end{array} \end{array} \begin{array}{c} \\ S \\ T \\ U \\ V \end{array} \)
The element in row \(i\) and column \(j\) of matrix \(M\) is \(m_{ij}\).
\(M\) is a \(3 \times 3\) matrix. It is constructed using the rule \(m_{ij} = 3i + 2j\).
\(M\) is
- A. \(\begin{bmatrix} 5 & 7 & 9 \\ 7 & 9 & 11 \\ 11 & 13 & 15 \end{bmatrix}\)
- B. \(\begin{bmatrix} 5 & 7 & 9 \\ 8 & 10 & 12 \\ 11 & 13 & 15 \end{bmatrix}\)
- C. \(\begin{bmatrix} 5 & 7 & 10 \\ 8 & 10 & 13 \\ 11 & 13 & 16 \end{bmatrix}\)
- D. \(\begin{bmatrix} 5 & 8 & 11 \\ 7 & 10 & 13 \\ 9 & 12 & 15 \end{bmatrix}\)
- E. \(\begin{bmatrix} 5 & 8 & 11 \\ 8 & 11 & 14 \\ 11 & 14 & 17 \end{bmatrix}\)
A small shopping centre has two coffee shops: Fatima's (\(F\)) and Giorgio's (\(G\)). The percentage of coffee-buyers at each shop changes from day to day, as shown in the transition matrix \(T\).
\[ T = \begin{array}{c} \begin{array}{cc} F & G \end{array} \\ \begin{bmatrix} 0.85 & 0.35 \\ 0.15 & 0.65 \end{bmatrix} \end{array} \begin{matrix} F \\ G \end{matrix} \quad \text{tomorrow} \]
On a particular Monday, 40% of coffee-buyers bought their coffees at Fatima's.
The matrix recursion relation \(S_{n+1} = T S_n\) is used to model this situation.
The percentage of coffee-buyers who are expected to buy their coffee at Giorgio's on Friday of the same week is closest to
- A. 31%
- B. 32%
- C. 34%
- D. 45%
- E. 68%
The table below shows information about three matrices: \(A\), \(B\) and \(C\).
| Matrix | Order |
|---|---|
| \(A\) | \(2 \times 4\) |
| \(B\) | \(2 \times 3\) |
| \(C\) | \(3 \times 4\) |
The transpose of matrix \(A\), for example, is written as \(A^T\).
What is the order of the product \(C^T \times (A^T \times B)^T\)?
- A. \(2 \times 3\)
- B. \(3 \times 4\)
- C. \(4 \times 2\)
- D. \(4 \times 3\)
- E. \(4 \times 4\)
Five competitors, Andy (\(A\)), Brie (\(B\)), Cleo (\(C\)), Della (\(D\)) and Eddie (\(E\)), participate in a darts tournament. Each competitor plays each of the other competitors once only, and each match results in a winner and a loser.
The matrix below shows the results of this darts tournament. There are still two matches that need to be played.
\[ \begin{array}{cc} & \textit{loser} \\ \textit{winner} & \begin{array}{c@{}c} & \begin{array}{@{}ccccc@{}} A & B & C & D & E \end{array} \\ \begin{matrix} A \\ B \\ C \\ D \\ E \end{matrix} & \left[ \begin{array}{@{}ccccc@{}} 0 & \dots & 0 & 1 & 0 \\ \dots & 0 & 1 & 0 & 1 \\ 1 & 0 & 0 & \dots & 1 \\ 0 & 1 & \dots & 0 & 0 \\ 1 & 0 & 0 & 1 & 0 \end{array} \right] \end{array} \end{array} \]
A '1' in the matrix shows that the competitor named in that row defeated the competitor named in that column. For example, the '1' in row 2, column 3 shows that Brie defeated Cleo. A '...' in the matrix shows that the competitor named in that row has not yet played the competitor named in that column.
The winner of this darts tournament is the competitor with the highest sum of their one-step and two-step dominances.
Which player, by winning their remaining match, will ensure that they are ranked first by the sum of their one-step and two-step dominances?
- A. Andy
- B. Brie
- C. Cleo
- D. Della
- E. Eddie
Consider the matrix recurrence relation below.
\[ S_0 = \begin{bmatrix} 30 \\ 20 \\ 40 \end{bmatrix}, \quad S_{n+1} = T S_n \quad \text{where} \quad T = \begin{bmatrix} j & 0.3 & l \\ 0.2 & m & 0.3 \\ 0.4 & 0.2 & n \end{bmatrix} \]
Matrix \(T\) is a regular transition matrix.
Given the information above and that \(S_1 = \begin{bmatrix} 42 \\ 28 \\ 20 \end{bmatrix}\), which one of the following is true?
- A. \(m > l\)
- B. \(j + l = 0.7\)
- C. \(j = n\)
- D. \(j > m\)
- E. \(l = m + n\)
Module 2 – Networks and decision mathematics
A connected planar graph has seven vertices and nine edges.
The number of faces that this graph will have is
- A. 1
- B. 2
- C. 3
- D. 4
- E. 5
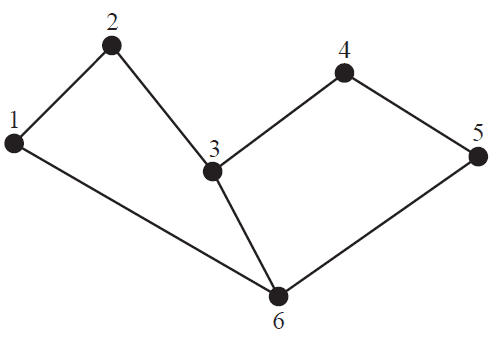
Consider the graph below.
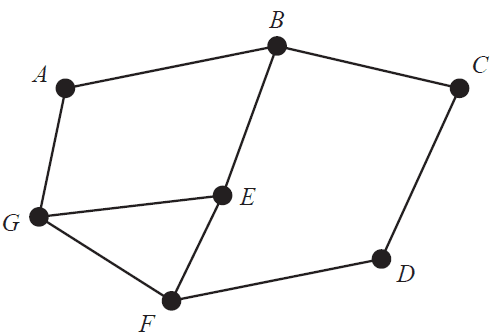
Which one of the following is not a Hamiltonian cycle for this graph?
- A. ABCDFEGA
- B. BAGEFDCB
- C. CDFEGABC
- D. DCBAGFED
- E. EGABCDFE
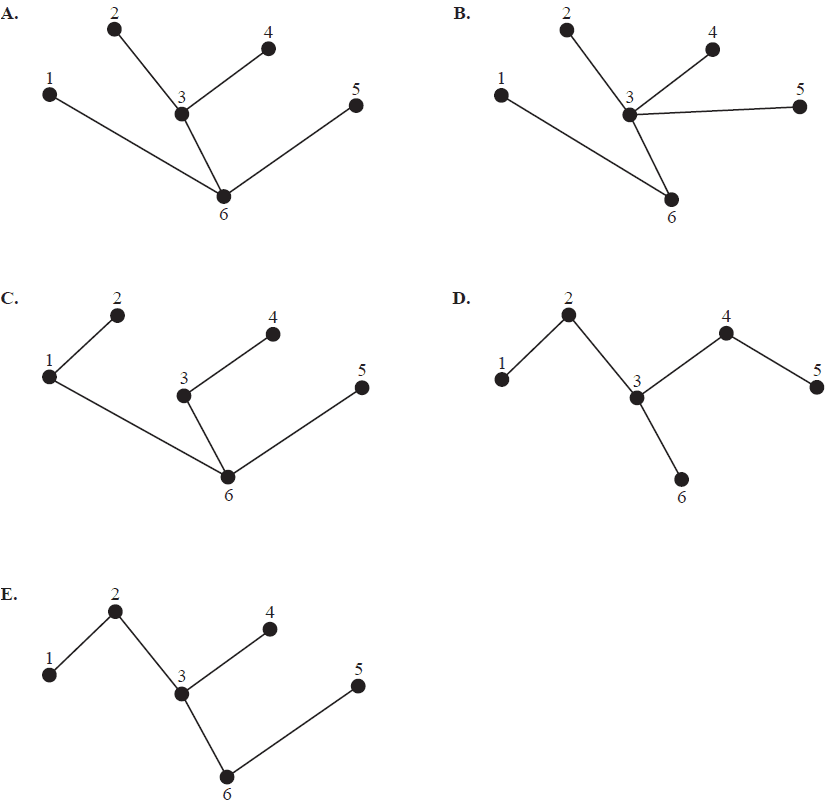
Which one of the following is not a spanning tree for the network above?
The directed graph below represents a series of one-way streets. The vertices represent the intersections of these streets.
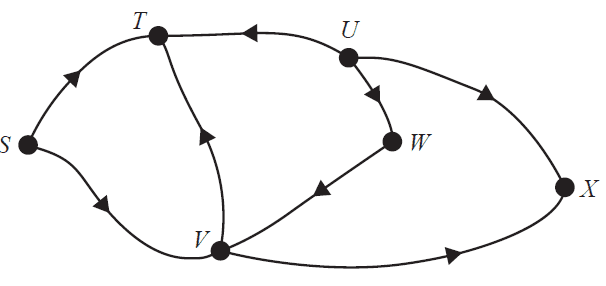
The number of vertices that can be reached from \(S\) is
- A. 1
- B. 2
- C. 3
- D. 4
- E. 5
The network below shows the distances, in metres, between camp sites at a camping ground that has electricity. The vertices \(A\) to \(I\) represent the camp sites.
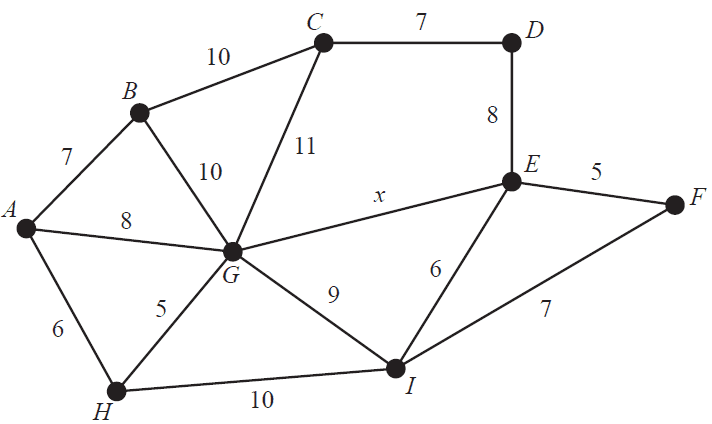
The minimum length of cable required to connect all the camp sites is 53 m.
The value of \(x\), in metres, is at least
- A. 5
- B. 6
- C. 8
- D. 9
- E. 11
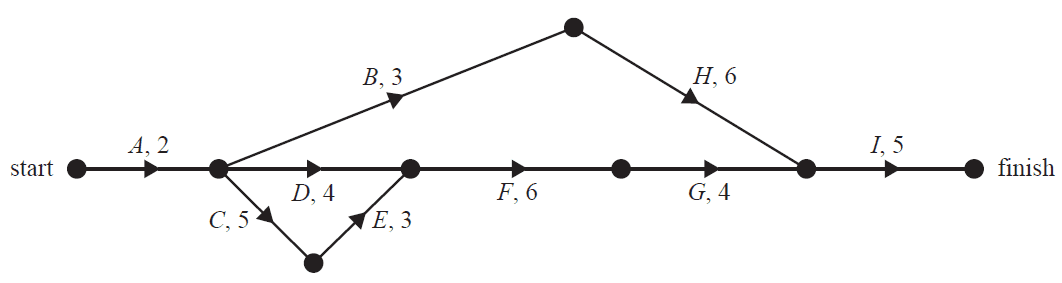
The activity network below shows the sequence of activities required to complete a project. The number next to each activity in the network is the time it takes to complete that activity, in days.
The minimum completion time for this project, in days, is
- A. 18
- B. 19
- C. 20
- D. 21
- E. 22
Four friends go to an ice-cream shop.
Akiro chooses chocolate and strawberry ice cream.
Doris chooses chocolate and vanilla ice cream.
Gohar chooses vanilla ice cream.
Imani chooses vanilla and lemon ice cream.
This information could be presented as a graph.
Consider the following four statements:
- The graph would be connected.
- The graph would be bipartite.
- The graph would be planar.
- The graph would be a tree.
How many of these four statements are true?
- A. 0
- B. 1
- C. 2
- D. 3
- E. 4
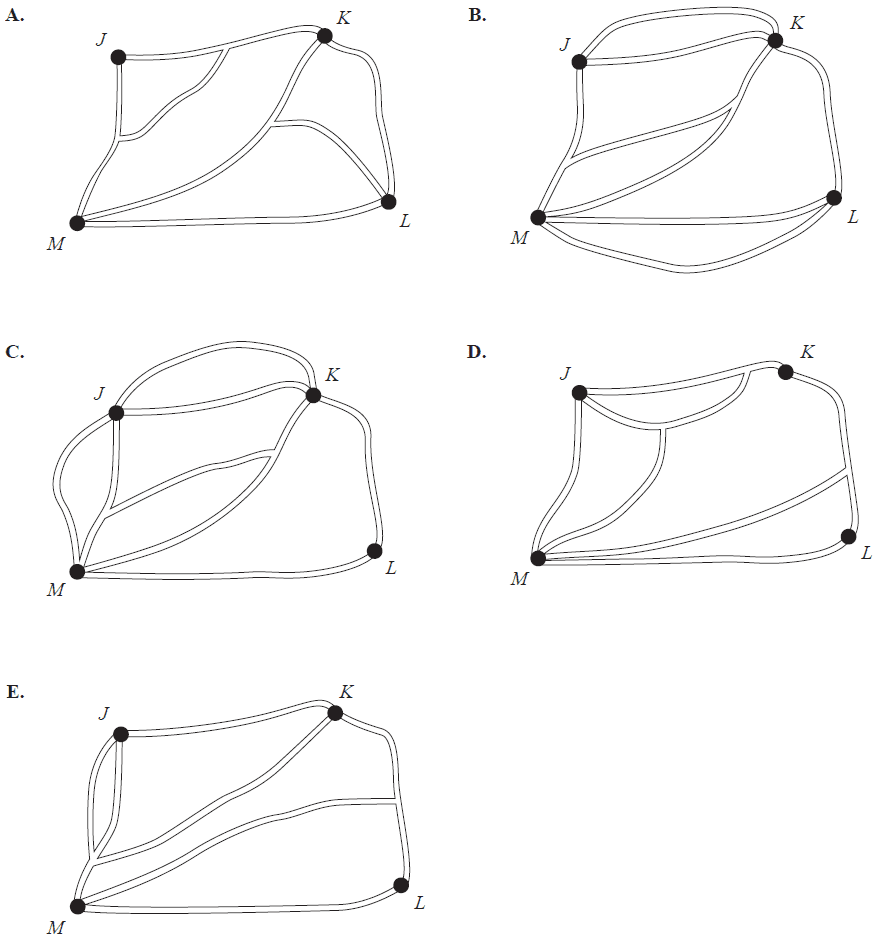
The adjacency matrix below shows the number of pathway connections between four landmarks: \(J, K, L\) and \(M\).
\[ \begin{array}{c} \begin{array}{cccc} J & K & L & M \end{array} \\ \begin{bmatrix} 1 & 3 & 0 & 2 \\ 3 & 0 & 1 & 2 \\ 0 & 1 & 0 & 2 \\ 2 & 2 & 2 & 0 \end{bmatrix} \end{array} \begin{matrix} J \\ K \\ L \\ M \end{matrix} \]
A network of pathways that could be represented by the adjacency matrix is
The flow of liquid through a series of pipelines, in litres per minute, is shown in the directed network below.
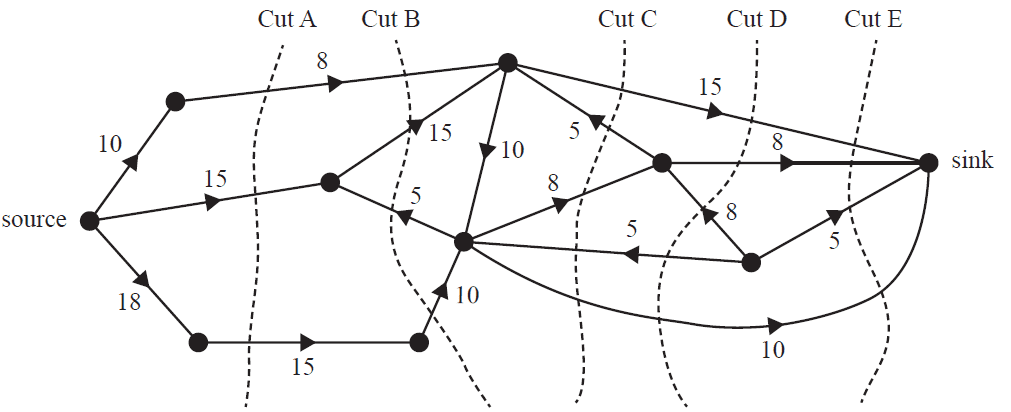
Five cuts labelled A to E are shown on the network.
The number of these cuts with a capacity equal to the maximum flow of liquid from the source to the sink, in litres per minute, is
- A. 1
- B. 2
- C. 3
- D. 4
- E. 5
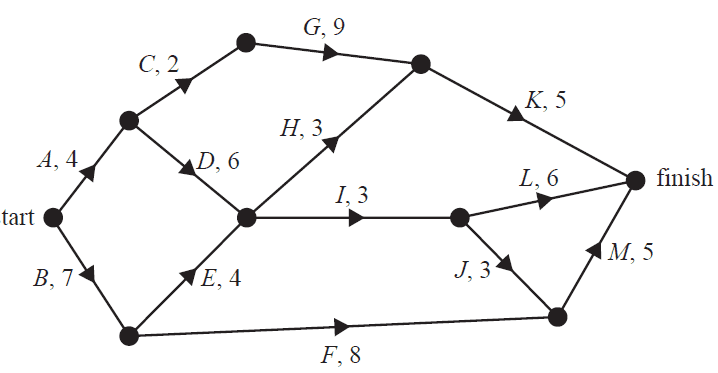
The directed network below shows the sequence of activities, \(A\) to \(I\), that is required to complete an office renovation. The time taken to complete each activity, in weeks, is also shown.
The project manager would like to complete the office renovation in less time. The project manager asks all the workers assigned to activity \(H\) to also work on activity \(F\). This will reduce the completion time of activity \(F\) to three weeks. The workers assigned to activity \(H\) cannot work on both activity \(H\) and activity \(F\) at the same time. No other activity times will be changed.
This change to the network will result in a change to the completion time of the office renovation. Which one of the following is correct?
- A. The completion time will be reduced by one week if activity \(F\) is completed before activity \(H\) is started.
- B. The completion time will be reduced by three weeks if activity \(F\) is completed before activity \(H\) is started.
- C. The completion time will be reduced by one week if activity \(H\) is completed before activity \(F\) is started.
- D. The completion time will be reduced by three weeks if activity \(H\) is completed before activity \(F\) is started.
- E. The completion time will be increased by three weeks if activity \(H\) is completed before activity \(F\) is started.
Module 3 – Geometry and measurement
Each year begins on 1 January.
The location that begins each year first is
- A. Kathmandu (28° N, 85° E).
- B. Cairo (30° N, 31° E).
- C. Kabul (34° N, 69° E).
- D. Nairobi (1° S, 37° E).
- E. Port Moresby (9° S, 147° E).
A flag consists of three different coloured sections: red, white and blue. The flag is 3 m long and 2 m wide, as shown in the diagram below.
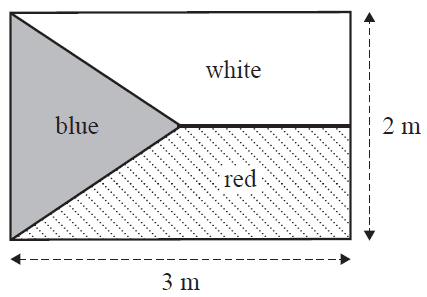
The blue section is an isosceles triangle that extends to half the length of the flag.
The area of the blue section, in square metres, is
- A. 0.75
- B. 1.5
- C. 2
- D. 3
- E. 6
Two trees stand on horizontal ground. A 25 m cable connects the two trees at point A and point B, as shown in the diagram below.
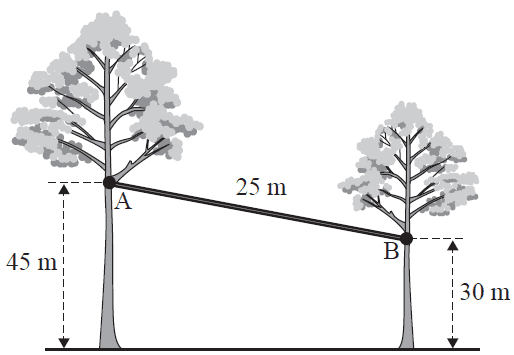
Point A is 45 m above the ground and point B is 30 m above the ground.
The horizontal distance, in metres, between point A and point B is
- A. 10
- B. 15
- C. 20
- D. 30
- E. 35
A regular hexagon is divided into three equal parts, as shown in the diagram below.
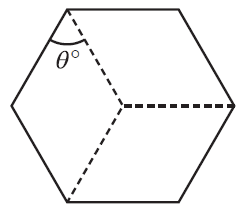
The size of the angle \(\theta\) is
- A. 45°
- B. 60°
- C. 100°
- D. 120°
- E. 180°
The pie chart below displays the results of a survey.
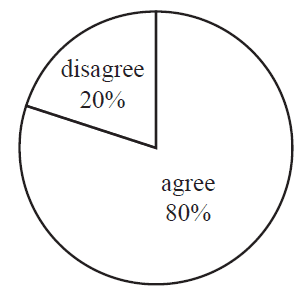
Eighty per cent of the people surveyed selected 'agree'. Twenty per cent of the people surveyed selected 'disagree'. The radius of the pie chart is 16 mm.
The area of the sector representing 'agree', in square millimetres, is closest to
- A. 80
- B. 161
- C. 483
- D. 643
- E. 804
The cities of Lhasa (30° N, 91° E), Chengdu (31° N, 104° E) and Shanghai (31° N, 121° E) are all in the same time zone.
Assume that 15° of longitude equates to a one-hour time difference.
Which one of the following statements is true?
- A. The sun rises at the same time in all three cities.
- B. The sun rises in Lhasa approximately one hour before it rises in Chengdu.
- C. The sun rises in Lhasa approximately two hours after it rises in Shanghai.
- D. Sunrise in each of the three cities is approximately 15 minutes apart.
- E. The sun rises in Shanghai and Chengdu at the same time but it rises earlier in Lhasa.
Cape Town has latitude 34° S and longitude 18° E.
Stockholm has latitude 59° N and longitude 18° E.
Assume that the radius of Earth is 6400 km.
The shortest distance along the meridian between Cape Town and Stockholm, in kilometres, is closest to
- A. 2011
- B. 3798
- C. 4021
- D. 6590
- E. 10388
A cake is in the shape of a rectangular prism, as shown in the diagram below.
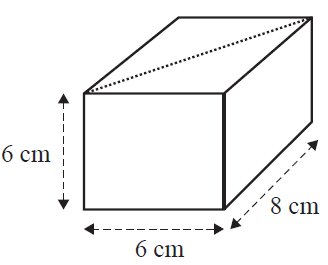
The cake is cut in half to create two equal portions. The cut is made along the diagonal, as represented by the dotted line.
The total surface area, in square centimetres, of one portion of the cake is
- A. 132
- B. 180
- C. 192
- D. 212
- E. 264
Shot-put is an athletics field event in which competitors throw a heavy spherical ball (a shot) as far as they can.
The size of the shot for men and the shot for women is different.
The diameter of the shot for men is 1.25 times larger than the diameter of the shot for women.
The ratio of the total surface area of the women's shot to the total surface area of the men's shot is
- A. 1:4
- B. 1:25
- C. 4:5
- D. 5:4
- E. 16:25
An 80 m high lookout tower stands in the centre of town. Two landmarks, on the same horizontal plane, are visible from the top of the lookout tower. The direct distance from the top of the lookout tower to the base of Landmark A is 170 m. The direct distance from the top of the lookout tower to the base of Landmark B is 234 m.
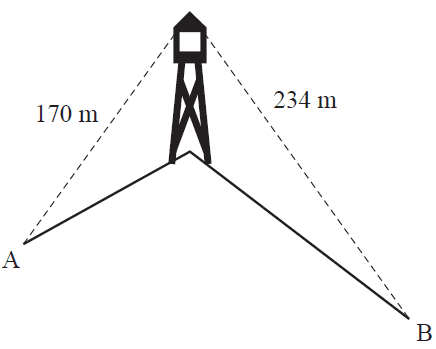
The bearing of Landmark B from Landmark A is 105°. The bearing of Landmark B from the lookout tower is 142°.
The direct distance along the ground, in metres, between Landmark A and Landmark B is closest to
- A. 127
- B. 135
- C. 246
- D. 297
- E. 320
Module 4 – Graphs and relations
The graph below shows the number of people who attended a market over a seven-hour time period.
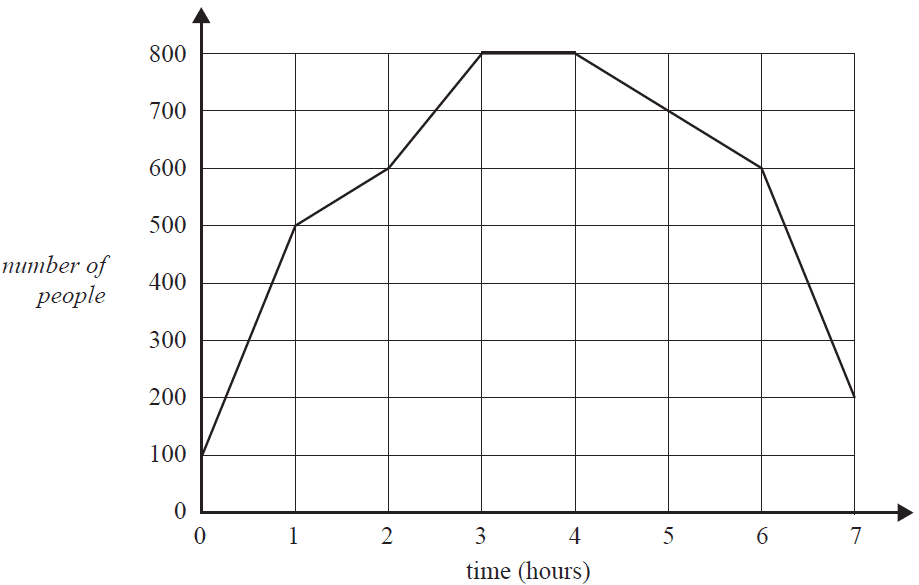
For how many hours were there at least 600 people at the market?
- A. 2
- B. 3
- C. 4
- D. 6
- E. 7
At a school concert, the entry fee for adults was different from the entry fee for children.
The entry fee for three adults and four children was $67.00
The entry fee for two adults and five children was $57.50
Let \(x\) be the entry fee for an adult.
Let \(y\) be the entry fee for a child.
A pair of simultaneous equations that could be used to represent the situation above is
- A. \(3x + 2y = 57.5\)
\(4x + 5y = 67\) - B. \(3x + 2y = 67\)
\(4x + 5y = 57.5\) - C. \(3x + 4y = 57.5\)
\(2x + 5y = 67\) - D. \(3x + 4y = 67\)
\(2x + 5y = 57.5\) - E. \(4x + 3y = 67\)
\(5x + 2y = 57.5\)
The delivery fee for a parcel, in dollars, charged by a courier company is based on the weight of the parcel, in kilograms.
This relationship is shown in the step graph below for parcels that weigh up to 20 kg.
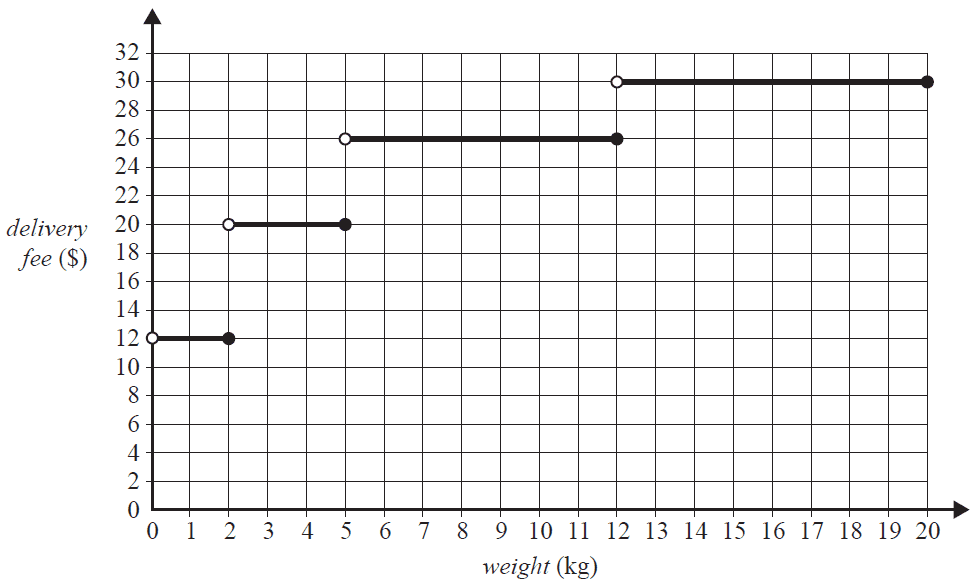
Which one of the following statements is not true?
- A. The delivery fee for a 4 kg parcel is $20.
- B. The delivery fee for a 12 kg parcel is $26.
- C. The delivery fee for a 13 kg parcel is the same as the delivery fee for a 20 kg parcel.
- D. The delivery fee for a 10 kg parcel is $14 more than the delivery fee for a 2 kg parcel.
- E. The delivery fee for a 12 kg parcel is $18 more than the delivery fee for a 2 kg parcel.
A straight line is graphed below.
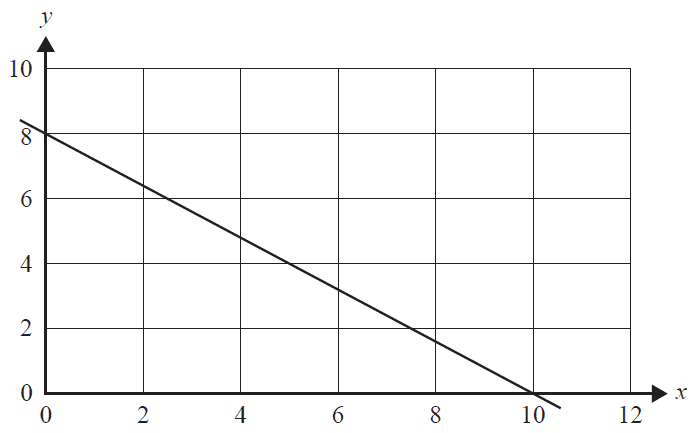
An equation for this straight line is
- A. \(10x + 8y = 40\)
- B. \(4x + 5y = 40\)
- C. \(4x - 5y = 40\)
- D. \(5x + 4y = 40\)
- E. \(8x + 10y = 40\)
The graphs shown below represent the same relationship, \(y = kx^n\).
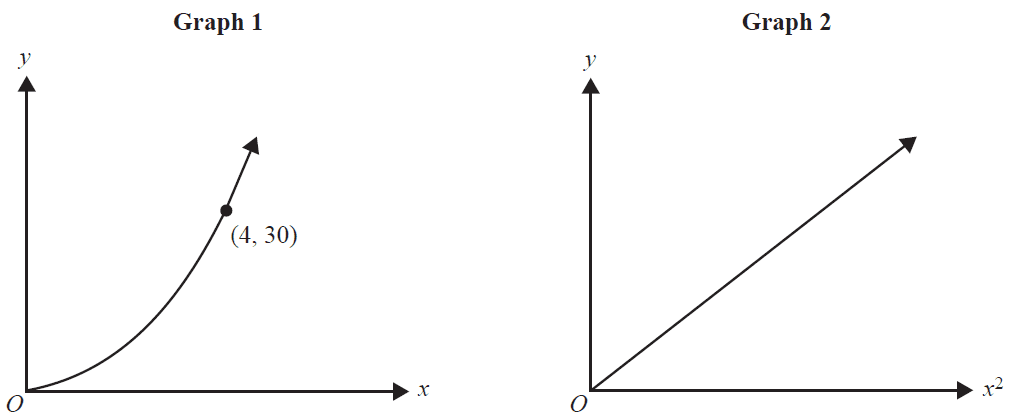
The gradient of the straight line in Graph 2 is
- A. \(\frac{15}{2}\)
- B. \(\frac{15}{8}\)
- C. \(\frac{450}{8}\)
- D. \(\frac{2}{15}\)
- E. \(\frac{8}{15}\)
Justin makes and sells electrical circuit boards.
He has one fixed cost of $420 each week.
Each circuit board costs $15 to make.
The selling price of each circuit board is $27.
The weekly profit if Justin makes and sells 200 circuit boards per week is
- A. $1980
- B. $2400
- C. $2820
- D. $4980
- E. $5400
An energy company charges a monthly service fee of $38.70 plus a supply charge of 2.5 cents per megajoule of energy used.
Caitlin's energy bill for the 30 days of the month of June was $169.90
On average, the number of megajoules of energy that Caitlin used per day in June is closest to
- A. 6
- B. 52
- C. 175
- D. 227
- E. 5248
A vet recommends that dogs eat no more than two units of meat for every five units of dry food.
Let \(x\) be the number of units of meat eaten.
Let \(y\) be the number of units of dry food eaten.
An inequality representing this situation is
- A. \(y \ge \frac{5}{2}x\)
- B. \(y \le \frac{2}{5}x\)
- C. \(y \le \frac{5}{2}x\)
- D. \(y \le 5x + 2\)
- E. \(y \le 2x + 5\)
The graph below shows the volume of water, \(V\) litres, in a tank at time \(t\) minutes.
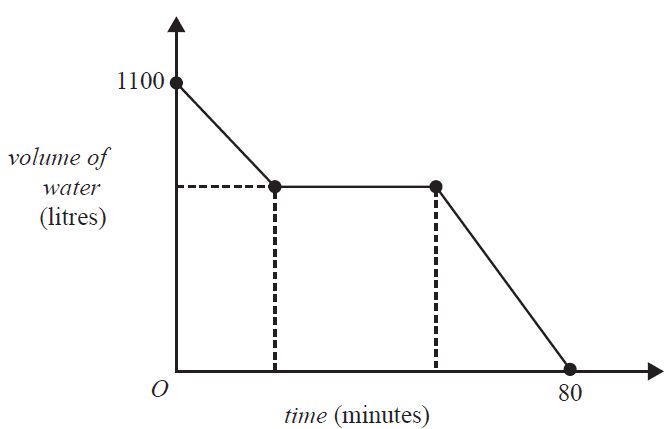
The 1100 litre tank took 80 minutes to empty.
The volume of water in the tank initially decreased by 300 litres in 20 minutes.
It then did not change for a period of time.
Finally, the volume of water in the tank decreased at the rate of 32 litres per minute.
The period of time, in minutes, for which the volume of water in the tank did not change is
- A. 20
- B. 25
- C. 35
- D. 55
- E. 65
The feasible region for a linear programming problem is shaded in the diagram below.
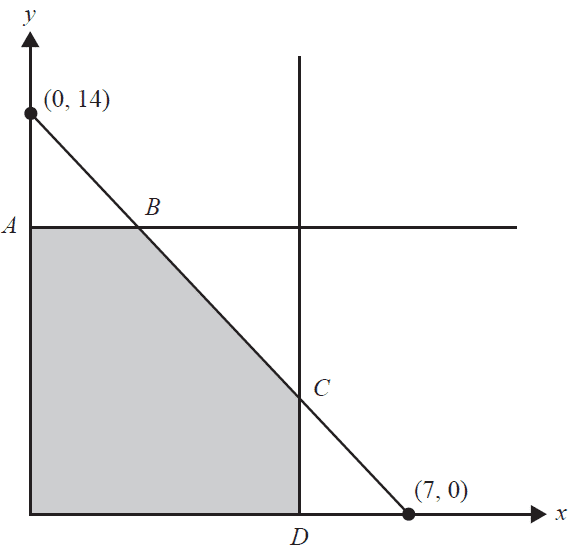
The line through points \(A\) and \(B\) is horizontal and the line through points \(C\) and \(D\) is vertical.
The equation for the objective function for this problem is of the form
\(Z = bx + 4.5y\) where \(b > 0\)
The value(s) of \(b\) such that the objective function is maximised only at point \(C\) is
- A. \(0 < b < 4.5\)
- B. \(b > 4.5\)
- C. \(b = 9\)
- D. \(0 < b < 9\)
- E. \(b > 9\)
End of Multiple-Choice Question Book
VCE is a registered trademark of the VCAA. The VCAA does not endorse or make any warranties regarding this study resource. Past VCE exams and related content can be accessed directly at www.vcaa.vic.edu.au
