2019 VCE Further Maths Exam 2
This is the full VCE Further Maths Exam with worked solutions. You can also try Mini-Tests, which are official VCAA exams split into short tests you can do anytime.
Number of marks: 60
Reading time: 15 minutes
Writing time: 1.5 hours
Instructions
• Answer all questions in pencil on your Multiple-Choice Answer Sheet.
• Choose the response that is correct for the question.
• A correct answer scores 1; an incorrect answer scores 0.
• Marks will not be deducted for incorrect answers.
• No marks will be given if more than one answer is completed for any question.
• Unless otherwise indicated, the diagrams in this book are not drawn to scale.
SECTION A – Core
Data analysis
Question 1 (4 marks)Table 1 shows the day number and the minimum temperature, in degrees Celsius, for 15 consecutive days in May 2017.
| Day number | Minimum temperature (°C) |
|---|---|
| 1 | 12.7 |
| 2 | 11.8 |
| 3 | 10.7 |
| 4 | 9.0 |
| 5 | 6.0 |
| 6 | 7.0 |
| 7 | 4.1 |
| 8 | 4.8 |
| 9 | 9.2 |
| 10 | 6.7 |
| 11 | 7.5 |
| 12 | 8.0 |
| 13 | 8.6 |
| 14 | 9.8 |
| 15 | 7.7 |
a. Which of the two variables in this data set is an ordinal variable? 1 mark
The incomplete ordered stem plot below has been constructed using the data values for days 1 to 10.
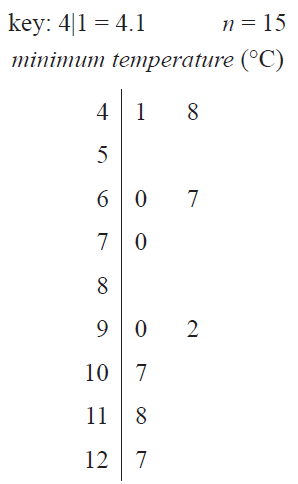
b. Complete the stem plot above by adding the data values for days 11 to 15. 1 mark
c. The ordered stem plot below shows the maximum temperature, in degrees Celsius, for the same 15 days.
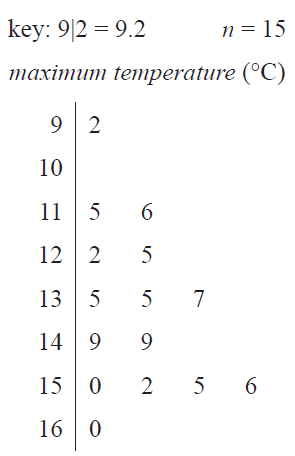
Use this stem plot to determine
i. the value of the first quartile (\(Q_1\)) 1 mark
ii. the percentage of days with a maximum temperature higher than 15.3 °C. 1 mark
The parallel boxplots below show the maximum daily temperature and minimum daily temperature, in degrees Celsius, for 30 days in November 2017.
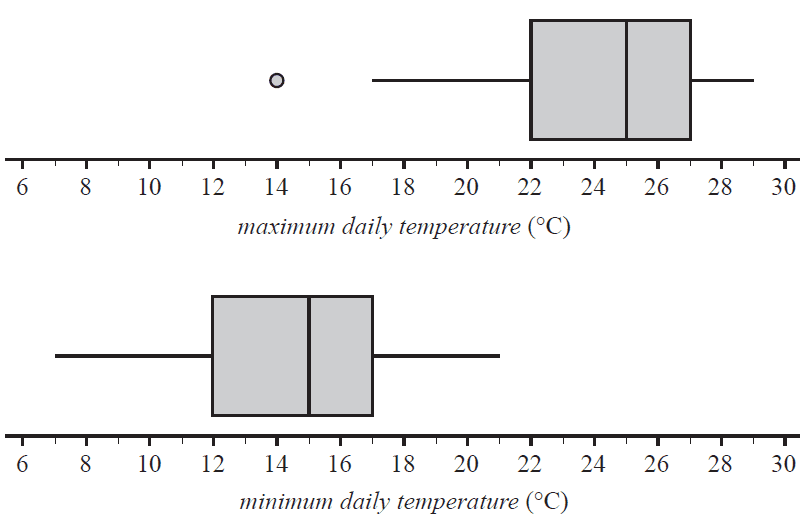
a. Use the information in the boxplots to complete the following sentences.
For November 2017
i. the interquartile range for the minimum daily temperature was °C 1 mark
ii. the median value for maximum daily temperature was °C higher than the median value for minimum daily temperature 1 mark
iii. the number of days on which the maximum daily temperature was less than the median value for minimum daily temperature was 1 mark
b. The temperature difference between the minimum daily temperature and the maximum daily temperature in November 2017 at this location is approximately normally distributed with a mean of 9.4 °C and a standard deviation of 3.2 °C.
Determine the number of days in November 2017 for which this temperature difference is expected to be greater than 9.4 °C. 1 mark
The five-number summary for the distribution of minimum daily temperature for the months of February, May and July in 2017 is shown in Table 2.
The associated boxplots are shown below the table.
| Month | Minimum | \(Q_1\) | Median | \(Q_3\) | Maximum |
|---|---|---|---|---|---|
| February | 5.9 | 9.5 | 10.9 | 13.9 | 22.2 |
| May | 3.3 | 6.0 | 7.5 | 9.8 | 12.7 |
| July | 1.6 | 3.7 | 5.0 | 5.9 | 7.7 |
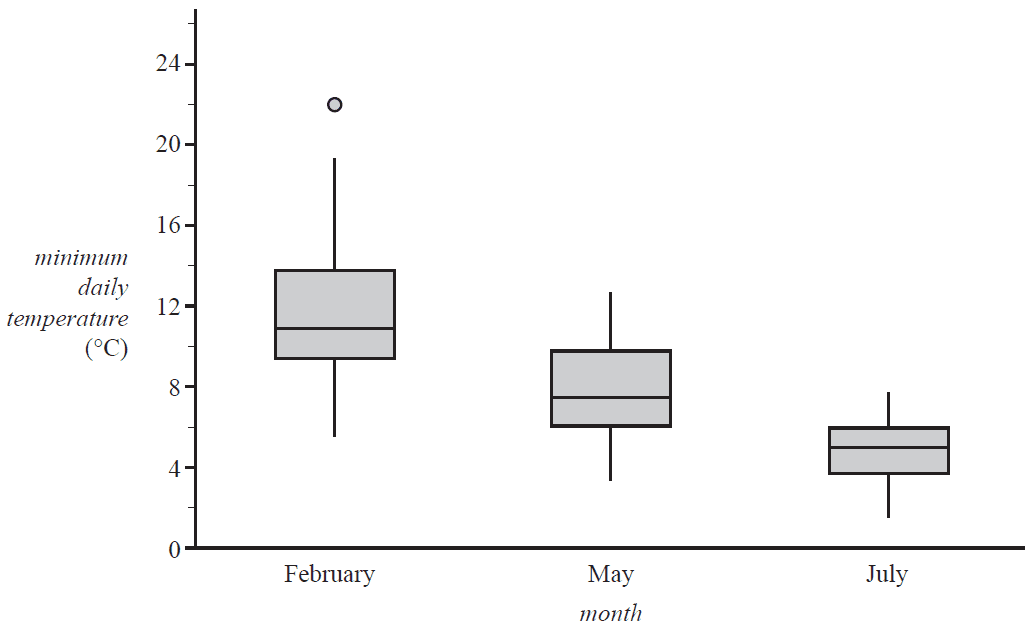
Explain why the information given above supports the contention that minimum daily temperature is associated with the month. Refer to the values of an appropriate statistic in your response. 2 marks
The relative humidity (%) at 9 am and 3 pm on 14 days in November 2017 is shown in Table 3 below.
| Relative humidity (%) | |
|---|---|
| 9 am | 3 pm |
| 100 | 87 |
| 99 | 75 |
| 95 | 67 |
| 63 | 57 |
| 81 | 57 |
| 94 | 74 |
| 96 | 71 |
| 81 | 62 |
| 73 | 53 |
| 53 | 54 |
| 57 | 36 |
| 77 | 39 |
| 51 | 30 |
| 41 | 32 |
A least squares line is to be fitted to the data with the aim of predicting the relative humidity at 3 pm (humidity 3 pm) from the relative humidity at 9 am (humidity 9 am).
a. Name the explanatory variable. 1 mark
b. Determine the values of the intercept and the slope of this least squares line.
Round both values to three significant figures and write them in the appropriate boxes provided. 1 mark
humidity 3 pm = + × humidity 9 am
c. Determine the value of the correlation coefficient for this data set.
Round your answer to three decimal places. 1 mark
The scatterplot below shows the atmospheric pressure, in hectopascals (hPa), at 3 pm (pressure 3 pm) plotted against the atmospheric pressure, in hectopascals, at 9 am (pressure 9 am) for 23 days in November 2017 at a particular weather station.
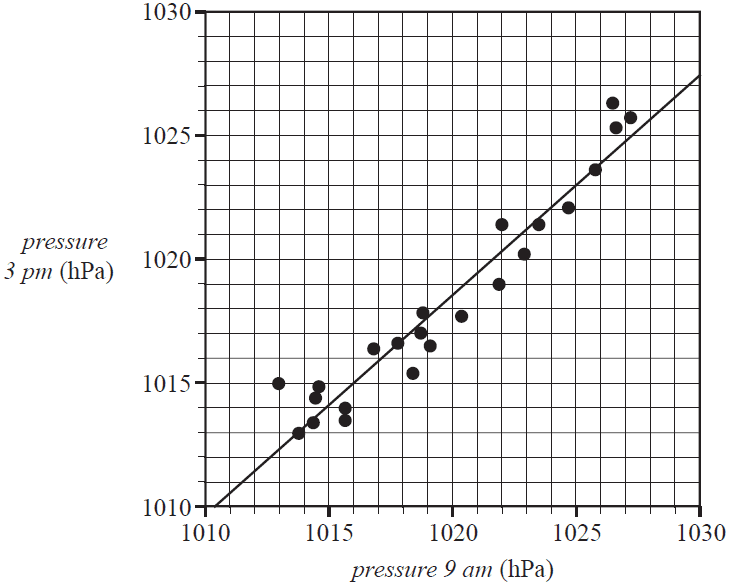
A least squares line has been fitted to the scatterplot as shown.
The equation of this line is
pressure 3 pm = 111.4 + 0.8894 × pressure 9 am
a. Interpret the slope of this least squares line in terms of the atmospheric pressure at this weather station at 9 am and at 3 pm. 1 mark
b. Use the equation of the least squares line to predict the atmospheric pressure at 3 pm when the atmospheric pressure at 9 am is 1025 hPa.
Round your answer to the nearest whole number. 1 mark
c. Is the prediction made in part b. an example of extrapolation or interpolation? 1 mark
d. Determine the residual when the atmospheric pressure at 9 am is 1013 hPa.
Round your answer to the nearest whole number. 1 mark
e. The mean and the standard deviation of pressure 9 am and pressure 3 pm for these 23 days are shown in Table 4 below.
| Pressure 9 am | Pressure 3 pm | |
|---|---|---|
| Mean | 1019.7 | 1018.3 |
| Standard deviation | 4.5477 | 4.1884 |
i. Use the equation of the least squares line and the information in Table 4 to show that the correlation coefficient for this data, rounded to three decimal places, is \(r = 0.966\) 1 mark
ii. What percentage of the variation in pressure 3 pm is explained by the variation in pressure 9 am?
Round your answer to one decimal place. 1 mark
f. The residual plot associated with the least squares line is shown below.
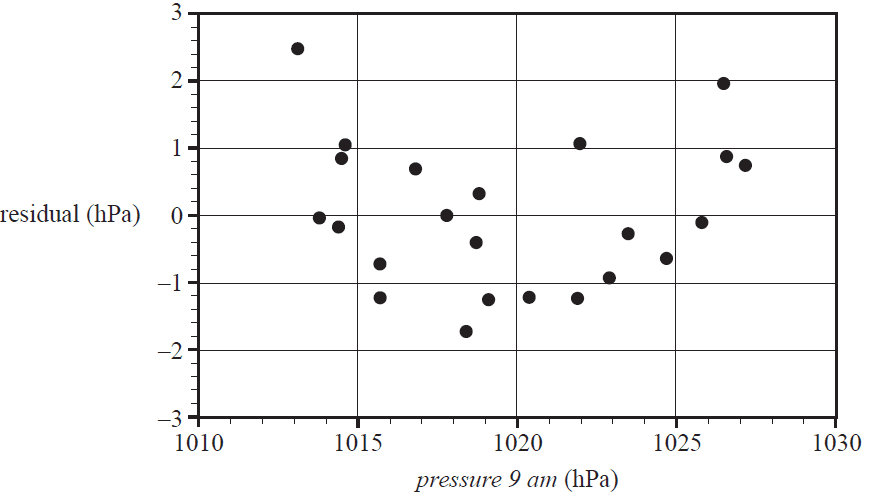
i. The residual plot above can be used to test one of the assumptions about the nature of the association between the atmospheric pressure at 3 pm and the atmospheric pressure at 9 am.
What is this assumption? 1 mark
ii. The residual plot above does not support this assumption.
Explain why. 1 mark
The total rainfall, in millimetres, for each of the four seasons in 2015 and 2016 is shown in Table 5 below.
| Year | Total rainfall (mm) | |||
|---|---|---|---|---|
| Summer | Autumn | Winter | Spring | |
| 2015 | 142 | 156 | 222 | 120 |
| 2016 | 135 | 153 | 216 | 96 |
a. The seasonal index for winter is shown in Table 6 below.
Use the values in Table 5 to find the seasonal indices for summer, autumn and spring.
Write your answers in Table 6, rounded to two decimal places. 2 marks
| Summer | Autumn | Winter | Spring | |
|---|---|---|---|---|
| Seasonal index | 1.41 |
b. The total rainfall for each of the four seasons in 2017 is shown in Table 7 below.
| Year | Total rainfall (mm) | |||
|---|---|---|---|---|
| Summer | Autumn | Winter | Spring | |
| 2017 | 141 | 156 | 262 | 120 |
Use the appropriate seasonal index from Table 6 to deseasonalise the total rainfall for winter in 2017.
Round your answer to the nearest whole number. 1 mark
Recursion and financial modelling
Question 7 (4 marks)Phil is a builder who has purchased a large set of tools.
The value of Phil’s tools is depreciated using the reducing balance method.
The value of the tools, in dollars, after \(n\) years, \(V_n\), can be modelled by the recurrence relation shown below.
\(V_0 = 60\,000, \quad V_{n+1} = 0.9 V_n\)
a. Use recursion to show that the value of the tools after two years, \(V_2\), is $48 600. 1 mark
b. What is the annual percentage rate of depreciation used by Phil? 1 mark
c. Phil plans to replace these tools when their value first falls below $20 000.
After how many years will Phil replace these tools? 1 mark
d. Phil has another option for depreciation. He depreciates the value of the tools by a flat rate of 8% of the purchase price per annum.
Let \(V_n\) be the value of the tools after \(n\) years, in dollars.
Write down a recurrence relation, in terms of \(V_0\), \(V_{n+1}\) and \(V_n\), that could be used to model the value of the tools using this flat rate depreciation. 1 mark
Phil invests $200 000 in an annuity from which he receives a regular monthly payment.
The balance of the annuity, in dollars, after \(n\) months, \(A_n\), can be modelled by the recurrence relation
\(A_0 = 200\,000, \quad A_{n+1} = 1.0035 A_n - 3700\)
a. What monthly payment does Phil receive? 1 mark
b. Show that the annual percentage compound interest rate for this annuity is 4.2%. 1 mark
At some point in the future, the annuity will have a balance that is lower than the monthly payment amount.
c. What is the balance of the annuity when it first falls below the monthly payment amount?
Round your answer to the nearest cent. 1 mark
d. If the payment received each month by Phil had been a different amount, the investment would act as a simple perpetuity.
What monthly payment could Phil have received from this perpetuity? 1 mark
Phil would like to purchase a block of land.
He will borrow $350 000 to make this purchase.
Interest on this loan will be charged at the rate of 4.9% per annum, compounding fortnightly.
After three years of equal fortnightly repayments, the balance of Phil’s loan will be $262 332.33
a. What is the value of each fortnightly repayment Phil will make?
Round your answer to the nearest cent. 1 mark
b. What is the total interest Phil will have paid after three years?
Round your answer to the nearest cent. 1 mark
c. Over the next four years of his loan, Phil will make monthly repayments of $3517.28 and will be charged interest at the rate of 4.8% per annum, compounding monthly.
Let \(B_n\) be the balance of the loan \(n\) months after these changes apply.
Write down a recurrence relation, in terms of \(B_0\), \(B_{n+1}\) and \(B_n\), that could be used to model the balance of the loan over these four years. 2 marks
SECTION B – Modules
Module 1 – Matrices
Question 1 (5 marks)The car park at a theme park has three areas, \(A\), \(B\) and \(C\).
The number of empty (\(E\)) and full (\(F\)) parking spaces in each of the three areas at 1 pm on Friday are shown in matrix \(Q\) below.
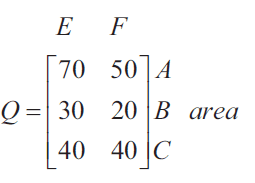
a. What is the order of matrix \(Q\)? 1 mark
b. Write down a calculation to show that 110 parking spaces are full at 1 pm. 1 mark
Drivers must pay a parking fee for each hour of parking.
Matrix \(P\), below, shows the hourly fee, in dollars, for a car parked in each of the three areas.
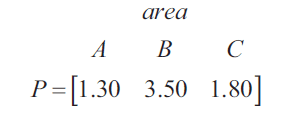
c. The total parking fee, in dollars, collected from these 110 parked cars if they were parked for one hour is calculated as follows.
\(P \times L = [207.00]\)
where matrix \(L\) is a \(3 \times 1\) matrix.
Write down matrix \(L\). 1 mark
\(L = \)
The number of whole hours that each of the 110 cars had been parked was recorded at 1 pm. Matrix \(R\), below, shows the number of cars parked for one, two, three or four hours in each of the areas \(A\), \(B\) and \(C\).
d. Matrix \(R^T\) is the transpose of matrix \(R\).
Complete the matrix \(R^T\) below. 1 mark
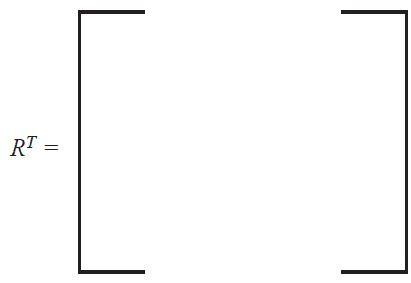
e. Explain what the element in row 3, column 2 of matrix \(R^T\) represents. 1 mark
The theme park has four locations, Air World (\(A\)), Food World (\(F\)), Ground World (\(G\)) and Water World (\(W\)).
The number of visitors at each of the four locations is counted every hour.
By 10 am on Saturday the park had reached its capacity of 2000 visitors and could take no more visitors.
The park stayed at capacity until the end of the day.
The state matrix, \(S_0\), below, shows the number of visitors at each location at 10 am on Saturday.
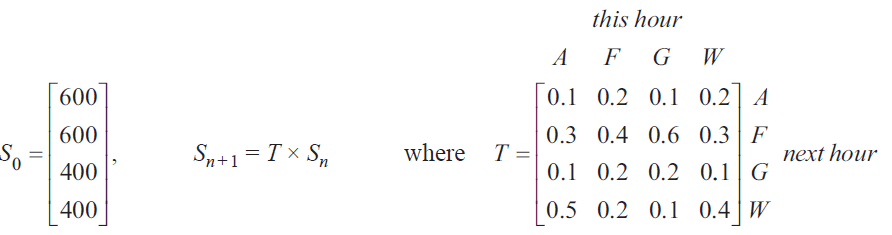
a. What percentage of the park’s visitors were at Water World (\(W\)) at 10 am on Saturday? 1 mark
Let \(S_n\) be the state matrix that shows the number of visitors expected at each location \(n\) hours after 10 am on Saturday.
The number of visitors expected at each location \(n\) hours after 10 am on Saturday can be determined by the matrix recurrence relation below.
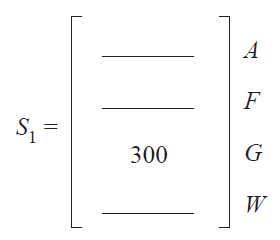
b. Complete the state matrix, \(S_1\), below to show the number of visitors expected at each location at 11 am on Saturday. 1 mark
\(S_1 = \)
c. Of the 300 visitors expected at Ground World (\(G\)) at 11 am, what percentage was at either Air World (\(A\)) or Food World (\(F\)) at 10 am? 1 mark
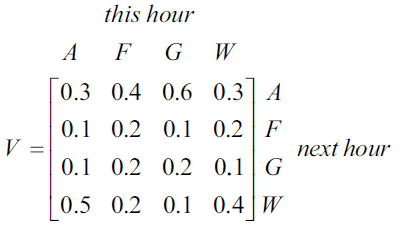
d. The proportion of visitors moving from one location to another each hour on Sunday is different from Saturday.
Matrix \(V\), below, shows the proportion of visitors moving from one location to another each hour after 10 am on Sunday.

Matrix \(V\) is similar to matrix \(T\) but has the first two rows of matrix \(T\) interchanged.
The matrix product that will generate matrix \(V\) from matrix \(T\) is
\(V = M \times T\)
where matrix \(M\) is a binary matrix.
Write down matrix \(M\). 1 mark
\(M = \)
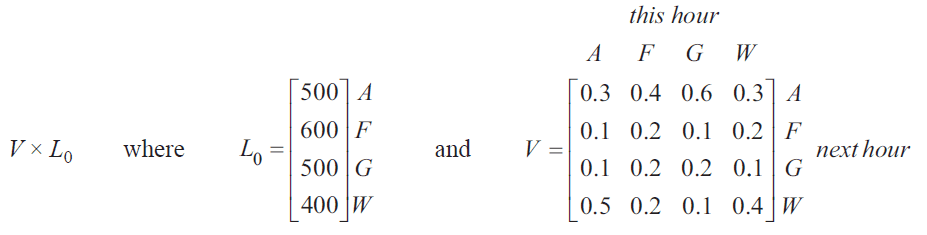
On Sunday, matrix \(V\) is used when calculating the expected number of visitors at each location every hour after 10 am. It is assumed that the park will be at its capacity of 2000 visitors for all of Sunday.
Let \(L_0\) be the state matrix that shows the number of visitors at each location at 10 am on Sunday.
The number of visitors expected at each location at 11 am on Sunday can be determined by the matrix product
a. Safety restrictions require that all four locations have a maximum of 600 visitors.
Which location is expected to have more than 600 visitors at 11 am on Sunday? 1 mark
b. Whenever more than 600 visitors are expected to be at a location on Sunday, the first 600 visitors can stay at that location and all others will be moved directly to Ground World (\(G\)).
State matrix \(R_n\) contains the number of visitors at each location \(n\) hours after 10 am on Sunday, after the safety restrictions have been enforced.
Matrix \(R_1\) can be determined from the matrix recurrence relation
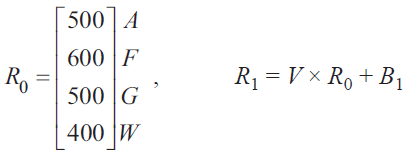
where matrix \(B_1\) shows the required movement of visitors at 11 am.
i. Determine the matrix \(B_1\). 1 mark
\(B_1 = \)
ii. State matrix \(R_2\) can be determined from the new matrix rule
\(R_2 = V R_1 + B_2\)
where matrix \(B_2\) shows the required movement of visitors at 12 noon.
Determine the state matrix \(R_2\). 1 mark
\(R_2 = \)
Module 2 – Networks and decision mathematics
Question 1 (3 marks)Fencedale High School has six buildings. The network below shows these buildings represented by vertices. The edges of the network represent the paths between the buildings.
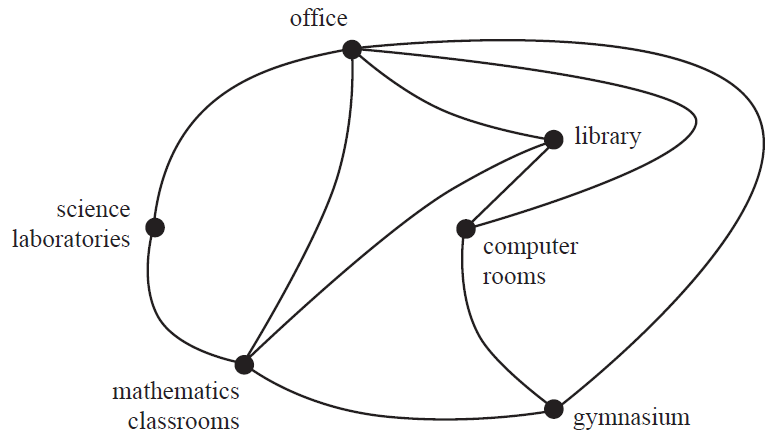
a. Which building in the school can be reached directly from all other buildings? 1 mark
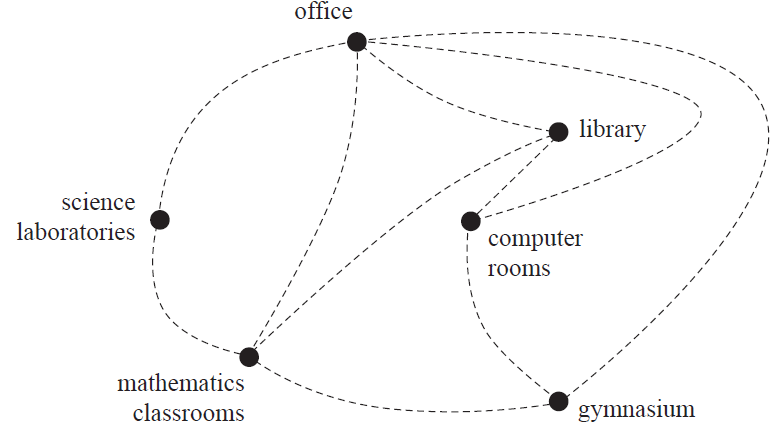
b. A school tour is to start and finish at the office, visiting each building only once.
i. What is the mathematical term for this route? 1 mark
ii. Draw in a possible route for this school tour on the diagram below. 1 mark
Fencedale High School offers students a choice of four sports, football, tennis, athletics and basketball.
The bipartite graph below illustrates the sports that each student can play.
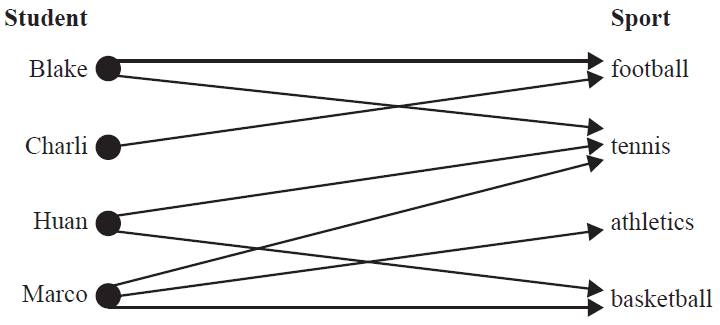
Each student will be allocated to only one sport.
a. Complete the table below by allocating the appropriate sport to each student. 1 mark
| Student | Sport |
|---|---|
| Blake | |
| Charli | |
| Huan | |
| Marco |
b. The school medley relay team consists of four students, Anita, Imani, Jordan and Lola.
The medley relay race is a combination of four different sprinting distances: 100 m, 200 m, 300 m and 400 m, run in that order.
The following table shows the best time, in seconds, for each student for each sprinting distance.
| Student | Best time for each sprinting distance (seconds) | |||
|---|---|---|---|---|
| 100 m | 200 m | 300 m | 400 m | |
| Anita | 13.3 | 29.6 | 61.8 | 87.1 |
| Imani | 14.5 | 29.6 | 63.5 | 88.9 |
| Jordan | 13.3 | 29.3 | 63.6 | 89.1 |
| Lola | 15.2 | 29.2 | 61.6 | 87.9 |
The school will allocate each student to one sprinting distance in order to minimise the total time taken to complete the race.
To which distance should each student be allocated?
Write your answers in the table below. 2 marks
| Student | Sprinting distance (m) |
|---|---|
| Anita | |
| Imani | |
| Jordan | |
| Lola |
Fencedale High School is planning to renovate its gymnasium.
This project involves 12 activities, \(A\) to \(L\).
The directed network below shows these activities and their completion times, in weeks.
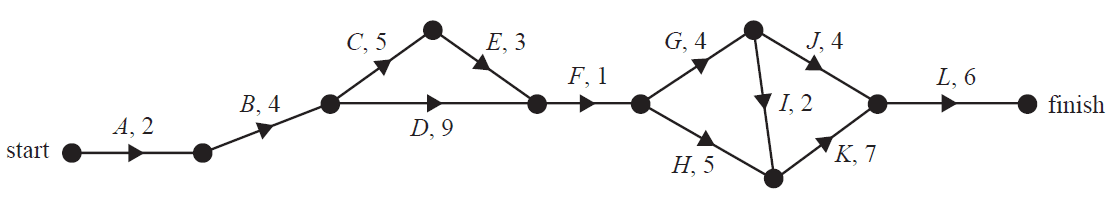
The minimum completion time for the project is 35 weeks.
a. How many activities are on the critical path? 1 mark
b. Determine the latest start time of activity \(E\). 1 mark
c. Which activity has the longest float time? 1 mark
It is possible to reduce the completion time for activities \(C\), \(D\), \(G\), \(H\) and \(K\) by employing more workers.
d. The completion time for each of these five activities can be reduced by a maximum of two weeks.
What is the minimum time, in weeks, that the renovation project could take? 1 mark
e. The reduction in completion time for each of these five activities will incur an additional cost to the school.
The table below shows the five activities that can have their completion times reduced and the associated weekly cost, in dollars.
| Activity | Weekly cost ($) |
|---|---|
| \(C\) | 3000 |
| \(D\) | 2000 |
| \(G\) | 2500 |
| \(H\) | 1000 |
| \(K\) | 4000 |
The completion time for each of these five activities can be reduced by a maximum of two weeks.
Fencedale High School requires the overall completion time for the renovation project to be reduced by four weeks at minimum cost.
Complete the table below, showing the reductions in individual activity completion times that would achieve this. 2 marks
| Activity | Reduction in completion time (0, 1 or 2 weeks) |
|---|---|
| \(C\) | |
| \(D\) | |
| \(G\) | |
| \(H\) | |
| \(K\) |
Module 3 – Geometry and measurement
Question 1 (4 marks)The following diagram shows a cargo ship viewed from above.
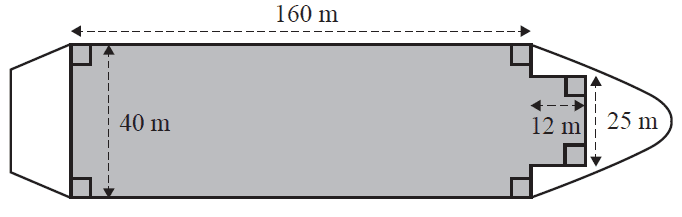
The shaded region illustrates the part of the deck on which shipping containers are stored.
a. What is the area, in square metres, of the shaded region? 1 mark
Each shipping container is in the shape of a rectangular prism.
Each shipping container has a height of 2.6 m, a width of 2.4 m and a length of 6 m, as shown in the diagram below.
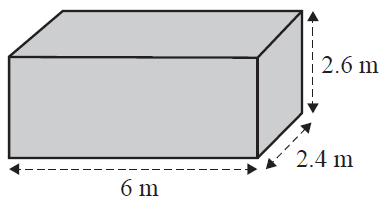
b. What is the volume, in cubic metres, of one shipping container? 1 mark
c. What is the total surface area, in square metres, of the outside of one shipping container? 1 mark
d. One shipping container is used to carry barrels. Each barrel is in the shape of a cylinder.
Each barrel is 1.25 m high and has a diameter of 0.73 m, as shown in the diagram below.
Each barrel must remain upright in the shipping container.
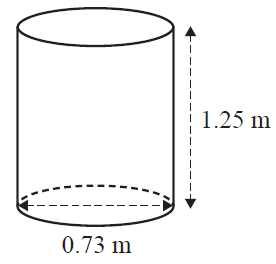
What is the maximum number of barrels that can fit in one shipping container? 1 mark
A cargo ship travels from Magadan (60° N, 151° E) to Sydney (34° S, 151° E).
a. Explain, with reference to the information provided, how we know that Sydney is closer to the equator than Magadan. 1 mark
b. Assume that the radius of Earth is 6400 km.
Find the shortest great circle distance between Magadan and Sydney.
Round your answer to the nearest kilometre. 1 mark
c. The cargo ship left Sydney (34° S, 151° E) at 6 am on 1 June and arrived in Perth (32° S, 116° E) at 10 am on 11 June.
There is a two-hour time difference between Sydney and Perth at that time of year.
How many hours did it take the cargo ship to travel from Sydney to Perth? 1 mark
The following diagram shows a crane that is used to transfer shipping containers between the port and the cargo ship.
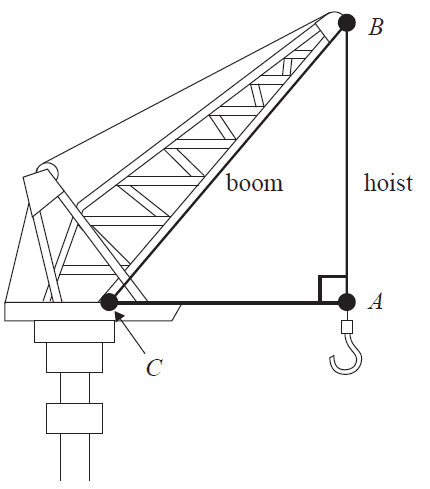
The length of the boom, \(BC\), is 25 m. The length of the hoist, \(AB\), is 15 m.
a. i. Write a calculation to show that the distance \(AC\) is 20 m. 1 mark
ii. Find the angle \(ACB\).
Round your answer to the nearest degree. 1 mark
b. The diagram below shows a cargo ship next to a port. The base of a crane is shown at point \(Q\).
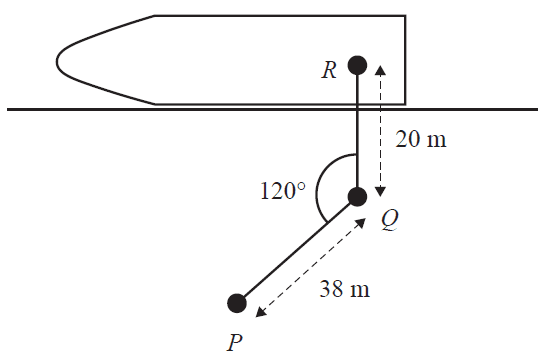
The base of the crane (\(Q\)) is 20 m from a shipping container at point \(R\). The shipping container will be moved to point \(P\), 38 m from \(Q\). The crane rotates 120° as it moves the shipping container anticlockwise from \(R\) to \(P\).
What is the distance \(RP\), in metres?
Round your answer to the nearest metre. 1 mark
c. A shipping container is a rectangular prism.
Four chains connect the shipping container to a hoist at point \(M\), as shown in the diagram below.
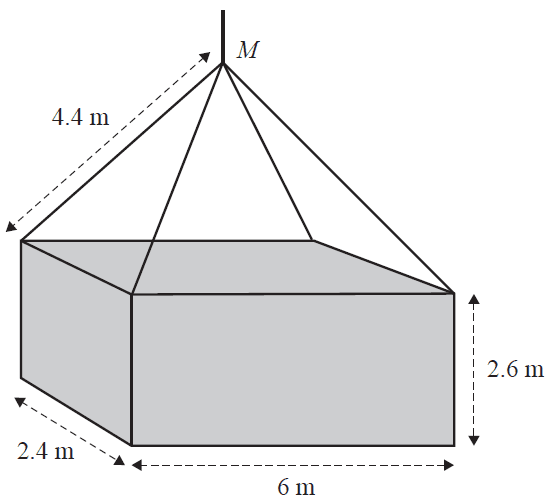
The shipping container has a height of 2.6 m, a width of 2.4 m and a length of 6 m.
Each chain on the hoist is 4.4 m in length.
What is the vertical distance, in metres, between point \(M\) and the top of the shipping container?
Round your answer to the nearest metre. 2 marks
Module 4 – Graphs and relations
Question 1 (3 marks)The graph below shows the membership numbers of the Wombatong Rural Women’s Association each year for the years 2008–2018.
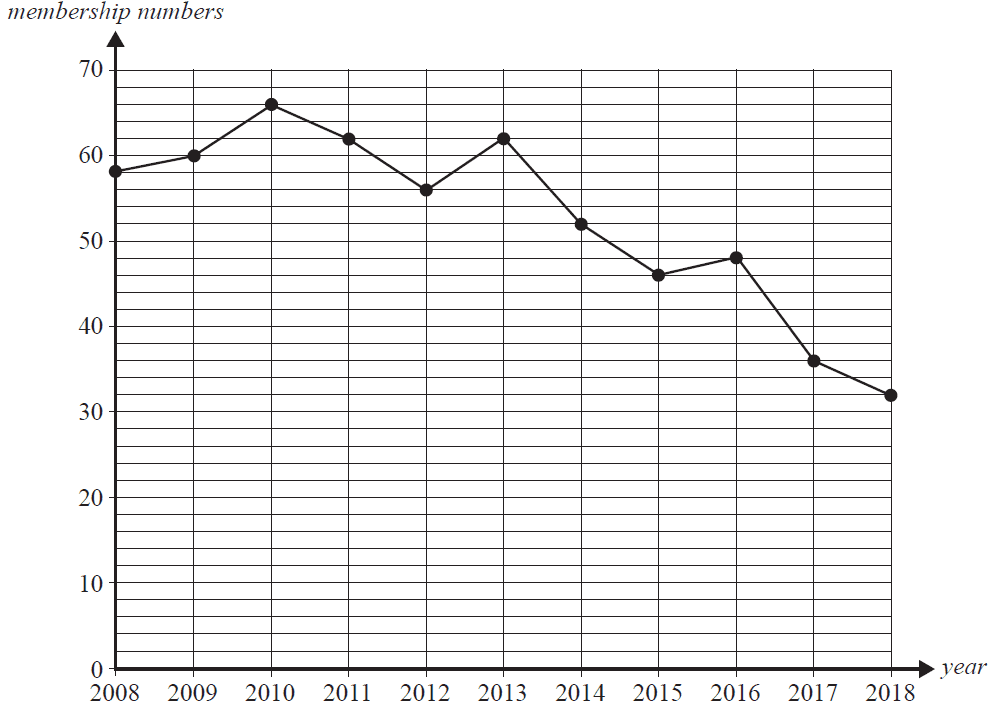
a. How many members were there in 2009? 1 mark
b. i. Show that the average rate of change of membership numbers from 2013 to 2018 was –6 members per year. 1 mark
ii. If the change in membership numbers continues at this rate, how many members will there be in 2021? 1 mark
Each branch within the association pays an annual fee based on the number of members it has.
To encourage each branch to find new members, two new annual fee systems have been proposed.
Proposal 1 is shown in the graph below, where the proposed annual fee per member, in dollars, is displayed for branches with up to 25 members.
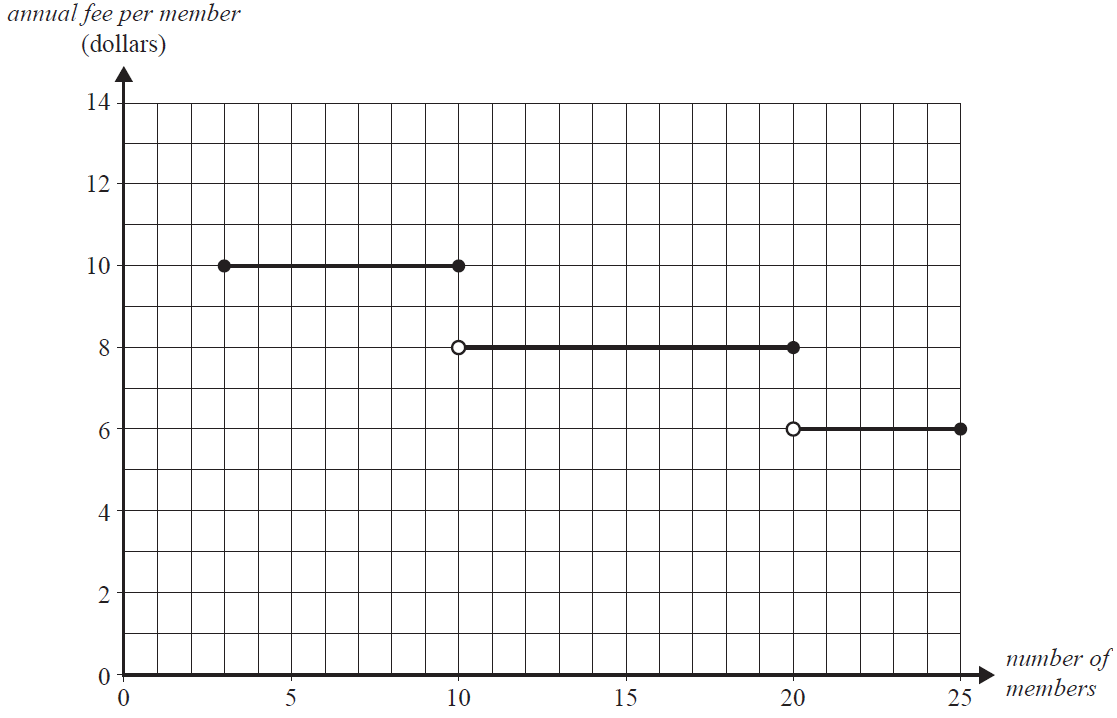
a. What is the smallest number of members that a branch may have? 1 mark
b. The incomplete inequality below shows the number of members required for an annual fee per member of $10.
Complete the inequality by writing the appropriate symbol and number in the box provided. 1 mark
3 ≤ number of members
Proposal 2 is modelled by the following equation.
annual fee per member = –0.25 × number of members + 12.25
c. Sketch this equation on the graph for Proposal 1, shown below. 1 mark
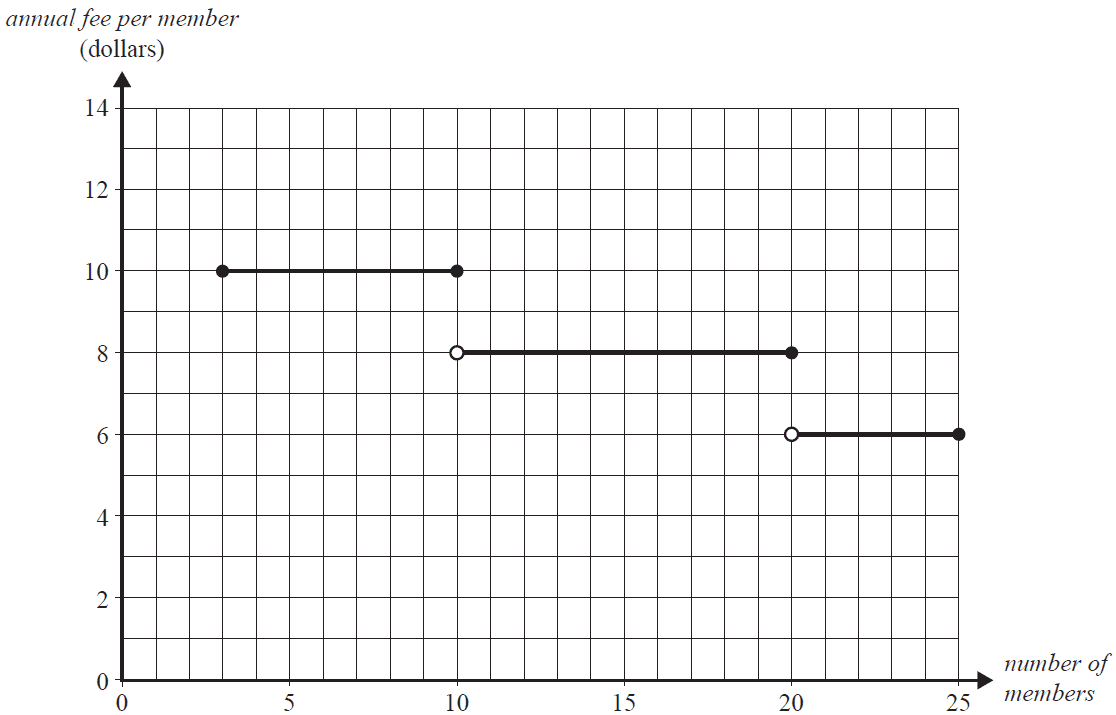
d. Proposal 1 and Proposal 2 have the same annual fee per member for some values of the number of members.
Write down all values of the number of members for which this is the case. 1 mark
Members of the association will travel to a conference in cars and minibuses:
- Let \(x\) be the number of cars used for travel.
- Let \(y\) be the number of minibuses used for travel.
- A maximum of eight cars and minibuses in total can be used.
- At least three cars must be used.
- At least two minibuses must be used.
The constraints above can be represented by the following three inequalities.
Inequality 1 \(x + y \le 8\)
Inequality 2 \(x \ge 3\)
Inequality 3 \(y \ge 2\)
a. Each car can carry a total of five people and each minibus can carry a total of 10 people.
A maximum of 60 people can attend the conference.
Use this information to write Inequality 4. 1 mark
The graph below shows the four lines representing Inequalities 1 to 4.
Also shown on this graph are four of the integer points that satisfy Inequalities 1 to 4. Each of these integer points is marked with a cross (X).
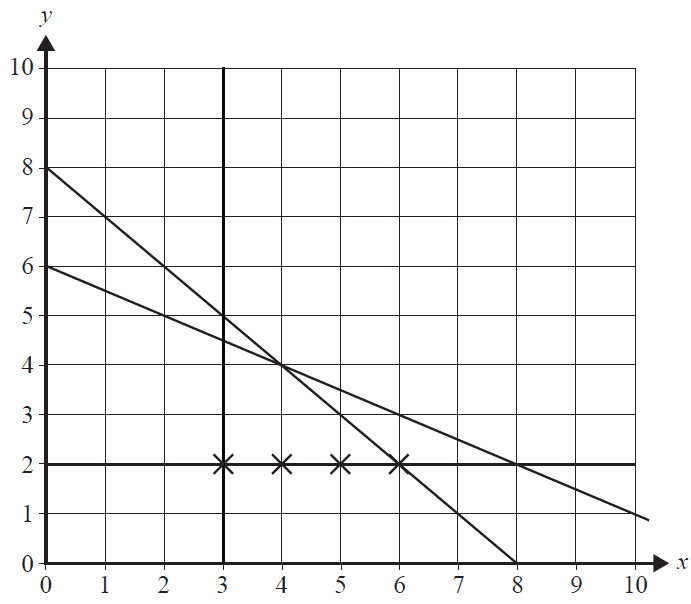
b. On the graph above, mark clearly, with a circle (O), the remaining integer points that satisfy Inequalities 1 to 4. 1 mark
Each car will cost $70 to hire and each minibus will cost $100 to hire.
c. What is the cost for 60 members to travel to the conference? 1 mark
d. What is the minimum cost for 55 members to travel to the conference? 1 mark
e. Just before the cars were booked, the cost of hiring each car increased.
The cost of hiring each minibus remained $100.
All original constraints apply.
If the increase in the cost of hiring each car is more than \(k\) dollars, then the maximum cost of transporting members to this conference can only occur when using six cars and two minibuses.
Determine the value of \(k\). 1 mark
End of Multiple-Choice Question Book
VCE is a registered trademark of the VCAA. The VCAA does not endorse or make any warranties regarding this study resource. Past VCE exams and related content can be accessed directly at www.vcaa.vic.edu.au
