2019 VCE Further Maths Exam 1
This is the full VCE Further Maths Exam with worked solutions. You can also try Mini-Tests, which are official VCAA exams split into short tests you can do anytime.
Number of marks: 40
Reading time: 15 minutes
Writing time: 1.5 hours
Instructions
• Answer all questions in pencil on your Multiple-Choice Answer Sheet.
• Choose the response that is correct for the question.
• A correct answer scores 1; an incorrect answer scores 0.
• Marks will not be deducted for incorrect answers.
• No marks will be given if more than one answer is completed for any question.
• Unless otherwise indicated, the diagrams in this book are not drawn to scale.
Data analysis
Use the following information to answer Questions 1–3.
The histogram below shows the distribution of the population size of 48 countries in 2018.
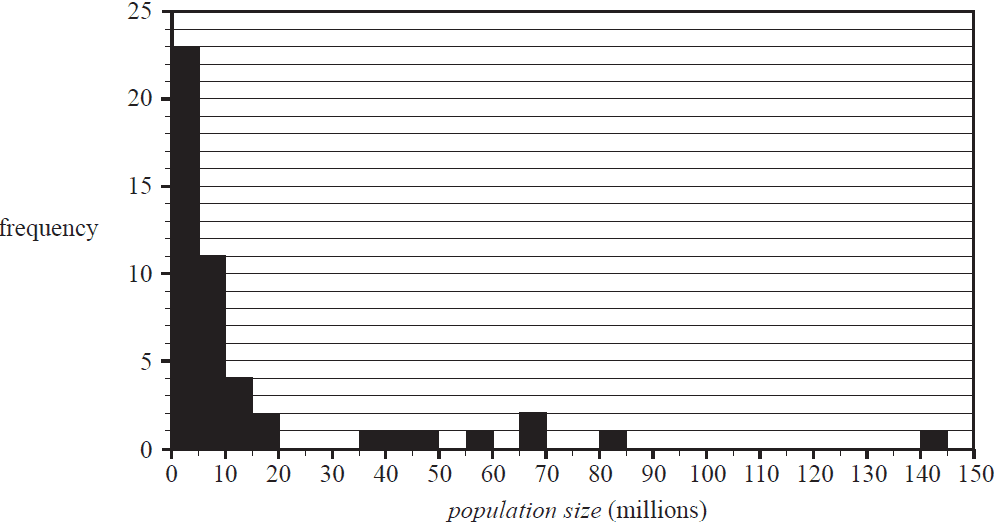
The number of these countries with a population size between 5 million and 20 million people is
- A. 11
- B. 17
- C. 23
- D. 34
- E. 35
The shape of this histogram is best described as
- A. positively skewed with no outliers.
- B. positively skewed with outliers.
- C. approximately symmetric.
- D. negatively skewed with no outliers.
- E. negatively skewed with outliers.
The histogram below shows the population size for these 48 countries plotted on a log10 scale.
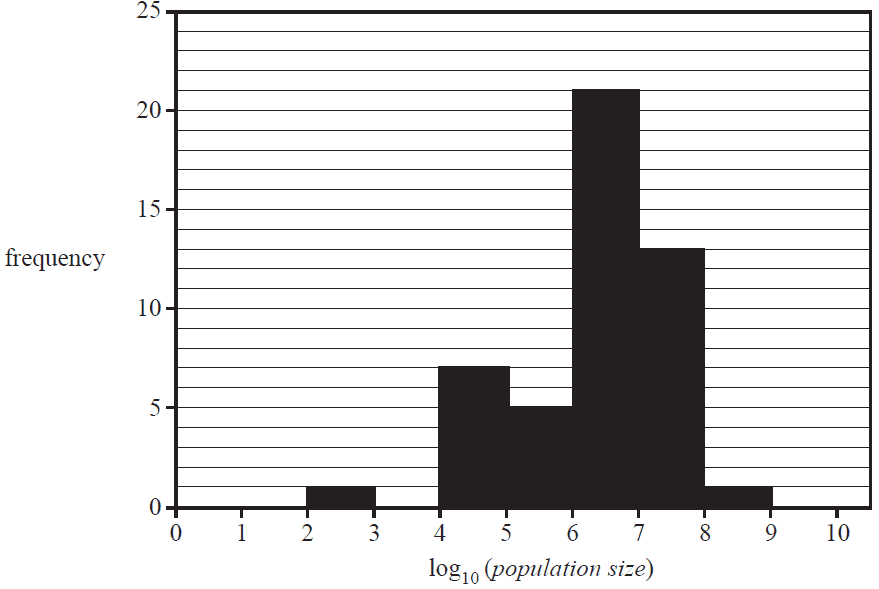
Based on this histogram, the number of countries with a population size that is less than 100 000 people is
- A. 1
- B. 5
- C. 7
- D. 8
- E. 48
Use the following information to answer Questions 4 and 5.
The stem plot below shows the distribution of mathematics test scores for a class of 23 students.
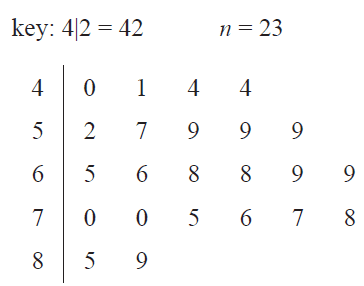
For this class, the range of test scores is
- A. 22
- B. 40
- C. 45
- D. 49
- E. 89
For this class, the interquartile range (IQR) of test scores is
- A. 14.5
- B. 17.5
- C. 18
- D. 24
- E. 49
The time taken to travel between two regional cities is approximately normally distributed with a mean of 70 minutes and a standard deviation of 2 minutes.
The percentage of travel times that are between 66 minutes and 72 minutes is closest to
- A. 2.5%
- B. 34%
- C. 68%
- D. 81.5%
- E. 95%
The volume of a cup of soup served by a machine is normally distributed with a mean of 240 mL and a standard deviation of 5 mL.
A fast-food store used this machine to serve 160 cups of soup.
The number of these cups of soup that are expected to contain less than 230 mL of soup is closest to
- A. 3
- B. 4
- C. 8
- D. 26
- E. 156
Percy conducted a survey of people in his workplace. He constructed a two-way frequency table involving two variables.
One of the variables was attitude towards shorter working days (for, against).
The other variable could have been
- A. age (in years).
- B. sex (male, female).
- C. height (to the nearest centimetre).
- D. income (to the nearest thousand dollars).
- E. time spent travelling to work (in minutes).
Use the following information to answer Questions 9 and 10.
A least squares line is used to model the relationship between the monthly average temperature and latitude recorded at seven different weather stations. The equation of the least squares line is found to be
\( \textit{average temperature} = 42.9842 - 0.877447 \times \textit{latitude} \)
Question 9When the numbers in this equation are correctly rounded to three significant figures, the equation will be
- A. \( \textit{average temperature} = 42.984 - 0.877 \times \textit{latitude} \)
- B. \( \textit{average temperature} = 42.984 - 0.878 \times \textit{latitude} \)
- C. \( \textit{average temperature} = 43.0 - 0.878 \times \textit{latitude} \)
- D. \( \textit{average temperature} = 42.9 - 0.878 \times \textit{latitude} \)
- E. \( \textit{average temperature} = 43.0 - 0.877 \times \textit{latitude} \)
The coefficient of determination was calculated to be 0.893743
The value of the correlation coefficient, rounded to three decimal places, is
- A. -0.945
- B. -0.898
- C. 0.806
- D. 0.898
- E. 0.945
A study was conducted to investigate the effect of drinking coffee on sleep.
In this study, the amount of sleep, in hours, and the amount of coffee drunk, in cups, on a given day were recorded for a group of adults.
The following summary statistics were generated.
| Sleep (hours) | Coffee (cups) | |
| Mean | 7.08 | 2.42 |
| Standard deviation | 1.12 | 1.56 |
| Correlation coefficient (r) | -0.770 | |
On average, for each additional cup of coffee drunk, the amount of sleep
- A. decreased by 0.55 hours.
- B. decreased by 0.77 hours.
- C. decreased by 1.1 hours.
- D. increased by 1.1 hours.
- E. increased by 2.3 hours.
The table below shows the values of two variables \(x\) and \(y\).
The associated scatterplot is also shown.
The explanatory variable is \(x\).
| x | y |
|---|---|
| 1 | 7.6 |
| 3 | 3.4 |
| 5 | 12.1 |
| 7 | 23.4 |
| 9 | 43.6 |
| 11 | 51.8 |
| 13 | 95.4 |
| 15 | 108 |
| 16 | 145 |
| 17 | 172 |
| 18 | 168 |
The scatterplot is non-linear.
A squared transformation applied to the variable \(x\) can be used to linearise the scatterplot.
The equation of the least squares line fitted to the linearised data is closest to
- A. \(y = -1.34 + 0.546x\)
- B. \(y = -1.34 + 0.546x^2\)
- C. \(y = 3.93 - 0.00864x^2\)
- D. \(y = 34.6 - 10.5x\)
- E. \(y = 34.6 - 10.5x^2\)
Use the following information to answer Questions 13 and 14.
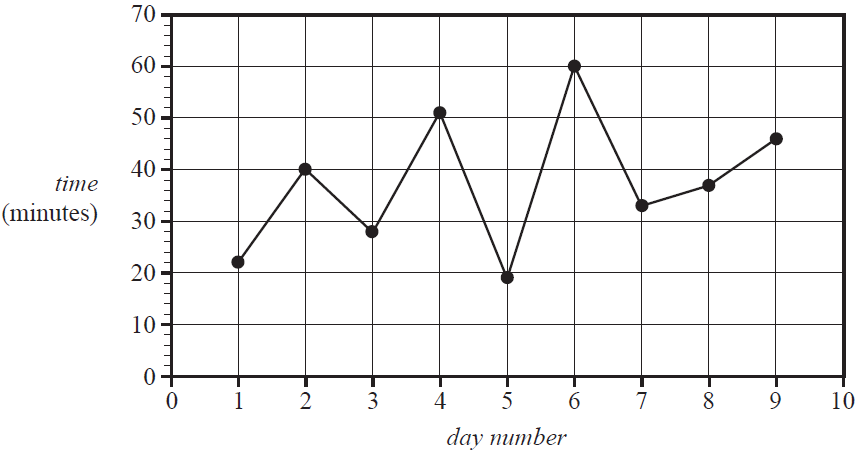
The time, in minutes, that Liv ran each day was recorded for nine days.
These times are shown in the table below.
| Day number | 1 | 2 | 3 | 4 | 5 | 6 | 7 | 8 | 9 |
| Time (minutes) | 22 | 40 | 28 | 51 | 19 | 60 | 33 | 37 | 46 |
The time series plot below was generated from this data.
Both three-median smoothing and five-median smoothing are being considered for this data.
Both of these methods result in the same smoothed value on day number
- A. 3
- B. 4
- C. 5
- D. 6
- E. 7
A least squares line is to be fitted to the time series plot shown above.
The equation of this least squares line, with day number as the explanatory variable, is closest to
- A. \( \textit{day number} = 23.8 + 2.29 \times \textit{time} \)
- B. \( \textit{day number} = 28.5 + 1.77 \times \textit{time} \)
- C. \( \textit{time} = 23.8 + 1.77 \times \textit{day number} \)
- D. \( \textit{time} = 23.8 + 2.29 \times \textit{day number} \)
- E. \( \textit{time} = 28.5 + 1.77 \times \textit{day number} \)
Use the following information to answer Questions 15 and 16.
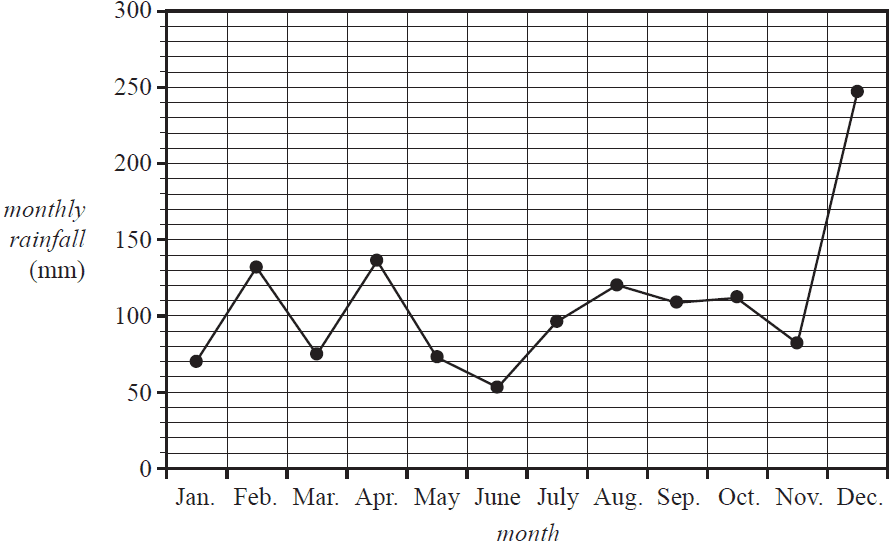
The time series plot below shows the monthly rainfall at a weather station, in millimetres, for each month in 2017.

The median monthly rainfall for 2017 was closest to
- A. 53 mm
- B. 82 mm
- C. 96 mm
- D. 103 mm
- E. 111 mm
If seven-mean smoothing is used to smooth this time series plot, the number of smoothed data points would be
- A. 3
- B. 5
- C. 6
- D. 8
- E. 10
Recursion and financial modelling
Question 17Consider the recurrence relation shown below.
\( A_0 = 3, \quad A_{n+1} = 2A_n + 4 \)
The value of \(A_3\) in the sequence generated by this recurrence relation is given by
- A. \(2 \times 3 + 4\)
- B. \(2 \times 4 + 4\)
- C. \(2 \times 10 + 4\)
- D. \(2 \times 24 + 4\)
- E. \(2 \times 52 + 4\)
The value of a compound interest investment, in dollars, after \(n\) years, \(V_n\), can be modelled by the recurrence relation shown below.
\( V_0 = 100\,000, \quad V_{n+1} = 1.01 V_n \)
The interest rate, per annum, for this investment is
- A. 0.01%
- B. 0.101%
- C. 1%
- D. 1.01%
- E. 101%
Geoff purchased a computer for $4500. He will depreciate the value of his computer by a flat rate of 10% of the purchase price per annum.
A recurrence relation that Geoff can use to determine the value of the computer after \(n\) years, \(V_n\), is
- A. \( V_0 = 4500, \quad V_{n+1} = V_n - 450 \)
- B. \( V_0 = 4500, \quad V_{n+1} = V_n + 450 \)
- C. \( V_0 = 4500, \quad V_{n+1} = 0.9 V_n \)
- D. \( V_0 = 4500, \quad V_{n+1} = 1.1 V_n \)
- E. \( V_0 = 4500, \quad V_{n+1} = 0.1 (V_n - 450) \)
Consider the following amortisation table for a reducing balance loan.
| Payment number | Payment | Interest | Principal reduction | Balance |
|---|---|---|---|---|
| 0 | 0.00 | 0.00 | 0.00 | 300 000.00 |
| 1 | 1050.00 | 900.00 | 150.00 | 299 850.00 |
| 2 | 1050.00 | 899.55 | 150.45 | 299 699.55 |
| 3 | 1050.00 | 899.10 | 150.90 | 299 548.65 |
The annual interest rate for this loan is 3.6%.
Interest is calculated immediately before each payment.
For this loan, the repayments are made
- A. weekly.
- B. fortnightly.
- C. monthly.
- D. quarterly.
- E. yearly.
The graph below shows the value, in dollars, of a compound interest investment after \(n\) compounding periods, \(V_n\), for a period of four compounding periods.
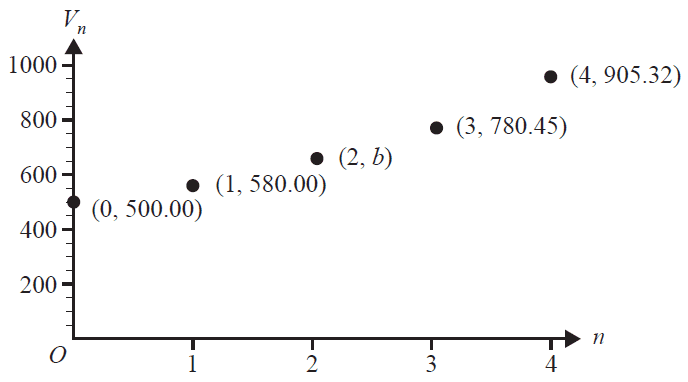
The coordinates of the point where \(n=2\) are \((2, b)\).
The value of \(b\) is
- A. 660.00
- B. 670.00
- C. 672.80
- D. 678.40
- E. 685.60
A machine is purchased for $30 000.
It produces 24 000 items each year.
The value of the machine is depreciated using a unit cost method of depreciation.
After three years, the value of the machine is $18 480.
A rule for the value of the machine after \(n\) units are produced, \(V_n\), is
- A. \( V_n = 0.872n \)
- B. \( V_n = 24\,000n - 3840 \)
- C. \( V_n = 30\,000 - 24\,000n \)
- D. \( V_n = 30\,000 - 0.872n \)
- E. \( V_n = 30\,000 - 0.16n \)
Joseph borrowed $50 000 to buy a new car.
Interest on this loan is charged at the rate of 7.5% per annum, compounding monthly.
Joseph will fully repay this loan with 60 monthly repayments over five years.
Immediately after the 59th repayment is made, Joseph still owes $995.49
The value of his final repayment, to the nearest cent, will be
- A. $995.49
- B. $998.36
- C. $1001.71
- D. $1001.90
- E. $1070.15
Millie invested $20 000 in an account at her bank with interest compounding monthly.
After one year, the balance of Millie's account was $20 732.
The difference between the rate of interest per annum used by her bank and the effective annual rate of interest for Millie's investment is closest to
- A. 0.04%
- B. 0.06%
- C. 0.08%
- D. 0.10%
- E. 0.12%
Module 1 – Matrices
Question 1Consider the following four matrix expressions.
\( \begin{bmatrix} 8 \\ 12 \end{bmatrix} + \begin{bmatrix} 4 \\ 2 \end{bmatrix} \)
\( \begin{bmatrix} 8 & 4 \\ 12 & 0 \end{bmatrix} + \begin{bmatrix} 4 & 0 \\ 0 & 2 \end{bmatrix} \)
\( \begin{bmatrix} 8 & 0 \\ 12 & 0 \end{bmatrix} + \begin{bmatrix} 4 \\ 2 \end{bmatrix} \)
\( \begin{bmatrix} 8 & 0 \\ 12 & 0 \end{bmatrix} + \begin{bmatrix} 4 & 0 \\ 0 & 2 \end{bmatrix} \)
How many of these four matrix expressions are defined?
- A. 0
- B. 1
- C. 2
- D. 3
- E. 4
There are two rides called The Big Dipper and The Terror Train at a carnival.
The cost, in dollars, for a child to ride on each ride is shown in the table below.
| Ride | Cost ($) |
| The Big Dipper | 7 |
| The Terror Train | 8 |
Six children ride once only on The Big Dipper and once only on The Terror Train.
The total cost of the rides, in dollars, for these six children can be determined by which one of the following calculations?
- A. \( \times [7 \quad 8] \)
- B. \( \times \begin{bmatrix} 7 \\ 8 \end{bmatrix} \)
- C. \( [6 \quad 6] \times [7 \quad 8] \)
- D. \( [6 \quad 6] \times \begin{bmatrix} 7 \\ 8 \end{bmatrix} \)
- E. \( \begin{bmatrix} 6 \\ 6 \end{bmatrix} \times [7 \quad 8] \)
Consider the matrix \(P\), where \( P = \begin{bmatrix} 3 & 2 & 1 \\ 5 & 4 & 3 \end{bmatrix} \)
The element in row \(i\) and column \(j\) of matrix \(P\) is \(p_{ij}\).
The elements in matrix \(P\) are determined by the rule
- A. \( p_{ij} = 4 - j \)
- B. \( p_{ij} = 2i + 1 \)
- C. \( p_{ij} = i + j + 1 \)
- D. \( p_{ij} = i + 2j \)
- E. \( p_{ij} = 2i - j + 2 \)
Stella completed a multiple-choice test that had 10 questions.
Each question had five possible answers, A, B, C, D and E.
For question number one, Stella chose the answer E.
Stella chose each of the nine remaining answers, in order, by following the transition matrix, \(T\), below.
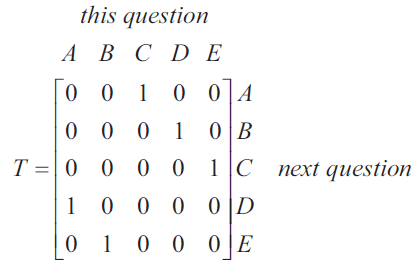
What answer did Stella choose for question number six?
- A. A
- B. B
- C. C
- D. D
- E. E
\[ \begin{bmatrix} 2 & 2 & 0 & -2 \\ 2 & 0 & -2 & 0 \\ 0 & 2 & 0 & -2 \\ 2 & 2 & -2 & 0 \end{bmatrix} \begin{bmatrix} v \\ w \\ x \\ y \end{bmatrix} = \begin{bmatrix} 2 \\ 6 \\ -8 \\ 4 \end{bmatrix} \]
Which one of the following systems of simultaneous linear equations best represents the matrix equation above?
- A. \(2v+2w - 2y = 2\)
\(2v - 2x = 6\)
\(2v - 2y = -8\)
\(2v+2w - 2x = 4\) - B. \(2v+2w - 2y = 2\)
\(2v - 2x = 6\)
\(2w - 2y = -8\)
\(2v+2w - 2x = 4\) - C. \(2v+2w + 2y = 2\)
\(2v - 2x = 6\)
\(2w - 2y = -8\)
\(2v+2w - 2x = 4\) - D. \(2v+2w - 2y = 2\)
\(2v - 2x = 6\)
\(2w - 2y = -8\)
\(2v+2w + 2x = 4\) - E. \(2v+2w - 2y = 2\)
\(2v - 2w = 6\)
\(2w - 2y = -8\)
\(2v+2w - 2x = 4\)
A water park is open from 9 am until 5 pm.
There are three activities, the pool (\(P\)), the slide (\(S\)) and the water jets (\(W\)), at the water park.
Children have been found to change their activity at the water park each half hour, as shown in the transition matrix, \(T\), below.
\[ \begin{array}{r@{\hskip 1em}c} T = \begin{array}{c} \begin{array}{ccc} \textit{P} & \textit{S} & \textit{W} \end{array} \\[-1.2ex] \left[ \begin{array}{ccc} 0.80 & 0.20 & 0.40 \\ 0.05 & 0.60 & 0.10 \\ 0.15 & 0.20 & 0.50 \end{array} \right] \end{array} & \begin{array}{c} \textit{this half hour} \\[-1.2ex] \textit{P} \\ \textit{S} \\ \textit{W} \end{array} \quad \textit{next half hour} \end{array} \]
A group of children has come to the water park for the whole day.
The percentage of these children who are expected to be at the slide (\(S\)) at closing time is closest to
- A. 14%
- B. 20%
- C. 24%
- D. 25%
- E. 62%
The communication matrix below shows the direct paths by which messages can be sent between two people in a group of six people, \(U\) to \(Z\).
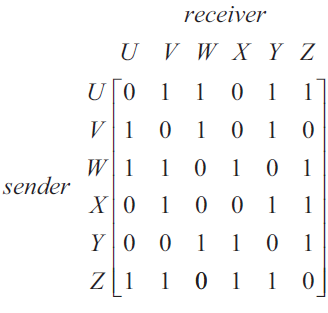
A '1' in the matrix shows that the person named in that row can send a message directly to the person named in that column.
For example, the '1' in row 4, column 2 shows that \(X\) can send a message directly to \(V\).
In how many ways can \(Y\) get a message to \(W\) by sending it directly to one other person?
- A. 0
- B. 1
- C. 2
- D. 3
- E. 4
An airline parks all of its planes at Sydney airport or Melbourne airport overnight.
The transition diagram below shows the change in the location of the planes from night to night.
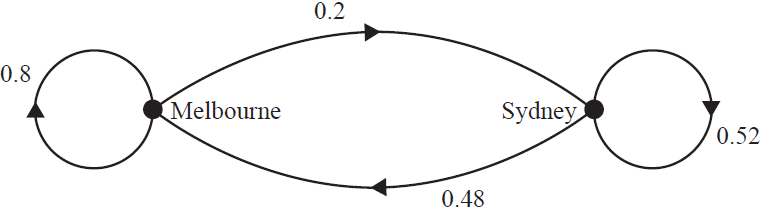
There are always \(m\) planes parked at Melbourne airport.
There are always \(s\) planes parked at Sydney airport.
Of the planes parked at Melbourne airport on Tuesday night, 12 had been parked at Sydney airport on Monday night.
How many planes does the airline have?
- A. 25
- B. 37
- C. 62
- D. 65
- E. 85
Module 2 – Networks and decision mathematics
Question 1In the graph shown above, the sum of the degrees of the vertices is
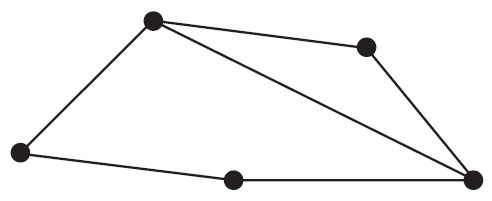
- A. 5
- B. 6
- C. 10
- D. 11
- E. 12
Consider the graph below.
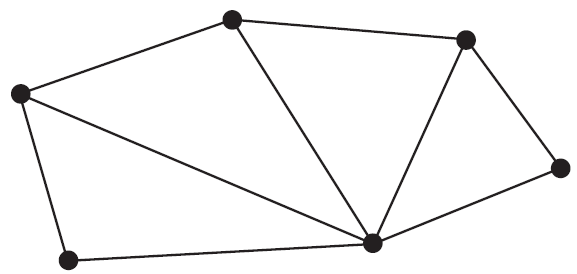
The minimum number of extra edges that are required so that an Eulerian circuit is possible in this graph is
- A. 0
- B. 1
- C. 2
- D. 3
- E. 4
The flow of water through a series of pipes is shown in the network below.
The numbers on the edges show the maximum flow through each pipe in litres per minute.
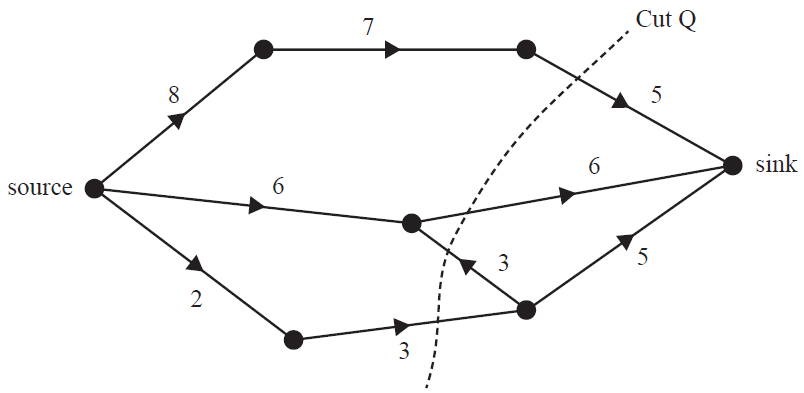
The capacity of Cut Q, in litres per minute, is
- A. 11
- B. 13
- C. 14
- D. 16
- E. 17
Two graphs, labelled Graph 1 and Graph 2, are shown below.
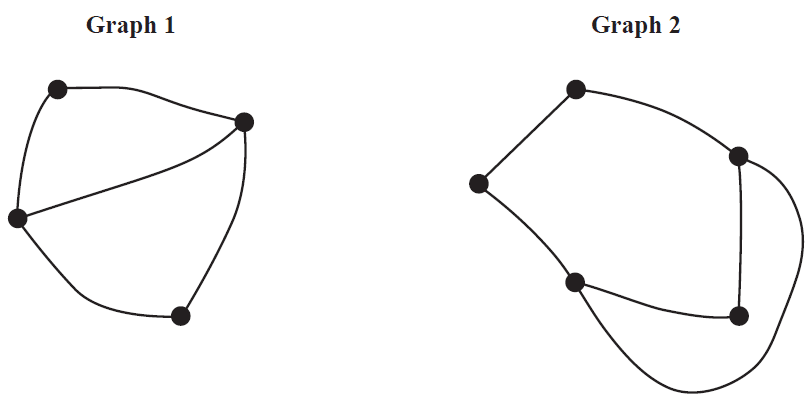
Which one of the following statements is not true?
- A. Graph 1 and Graph 2 are isomorphic.
- B. Graph 1 has five edges and Graph 2 has six edges.
- C. Both Graph 1 and Graph 2 are connected graphs.
- D. Both Graph 1 and Graph 2 have three faces each.
- E. Neither Graph 1 nor Graph 2 are complete graphs.
The following diagram shows the distances, in metres, along a series of cables connecting a main server to seven points, \(A\) to \(G\), in a computer network.
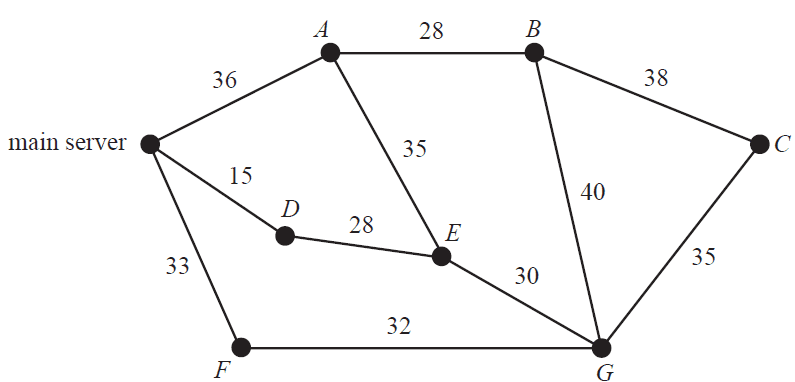
The minimum length of cable, in metres, required to ensure that each of the seven points is connected to the main server directly or via another point is
- A. 175
- B. 203
- C. 208
- D. 221
- E. 236
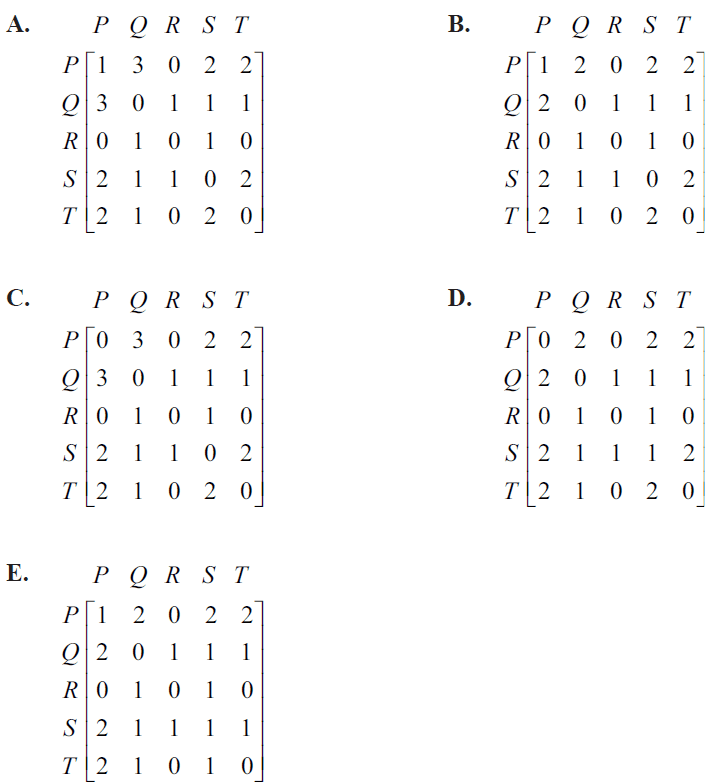
The map below shows all the road connections between five towns, \(P, Q, R, S\) and \(T\).
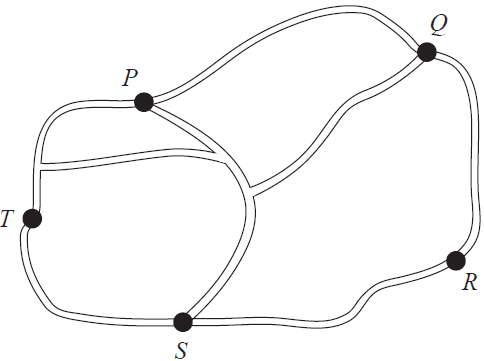
The road connections could be represented by the adjacency matrix
A project involves nine activities, \(A\) to \(I\).
The immediate predecessor(s) of each activity is shown in the table below.
| Activity | Immediate predecessor(s) |
|---|---|
| A | – |
| B | A |
| C | A |
| D | B |
| E | B, C |
| F | D |
| G | D |
| H | E, F |
| I | G, H |
A directed network for this project will require a dummy activity.
The dummy activity will be drawn from the end of
- A. activity \(B\) to the start of activity \(C\).
- B. activity \(B\) to the start of activity \(E\).
- C. activity \(D\) to the start of activity \(E\).
- D. activity \(E\) to the start of activity \(H\).
- E. activity \(E\) to the start of activity \(F\).
The directed network below shows the sequence of activities, \(A\) to \(S\), that is required to complete a manufacturing process.
The time taken to complete each activity, in hours, is also shown.
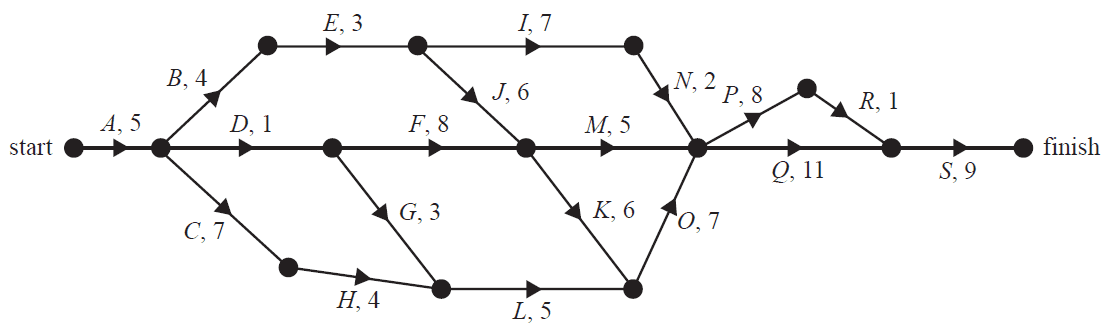
The number of activities that have a float time of 10 hours is
- A. 0
- B. 1
- C. 2
- D. 3
- E. 4
Module 3 – Geometry and measurement
Question 1The four bases of a baseball field form four corners of a square of side length 27.43 m, as shown in the diagram below.
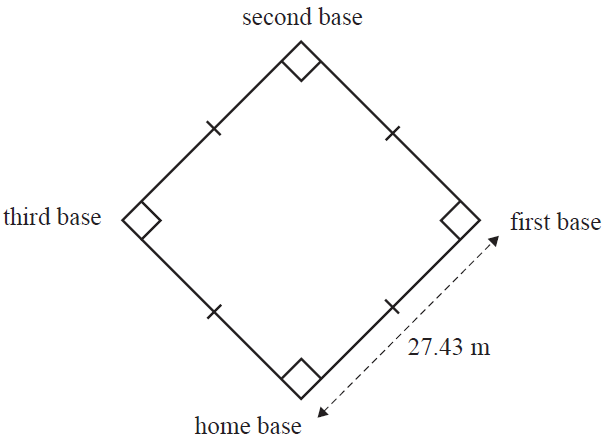
A player ran from home base to first base, then to second base, then to third base and finally back to home base.
The minimum distance, in metres, that the player ran is
- A. 27.43
- B. 54.86
- C. 82.29
- D. 109.72
- E. 164.58
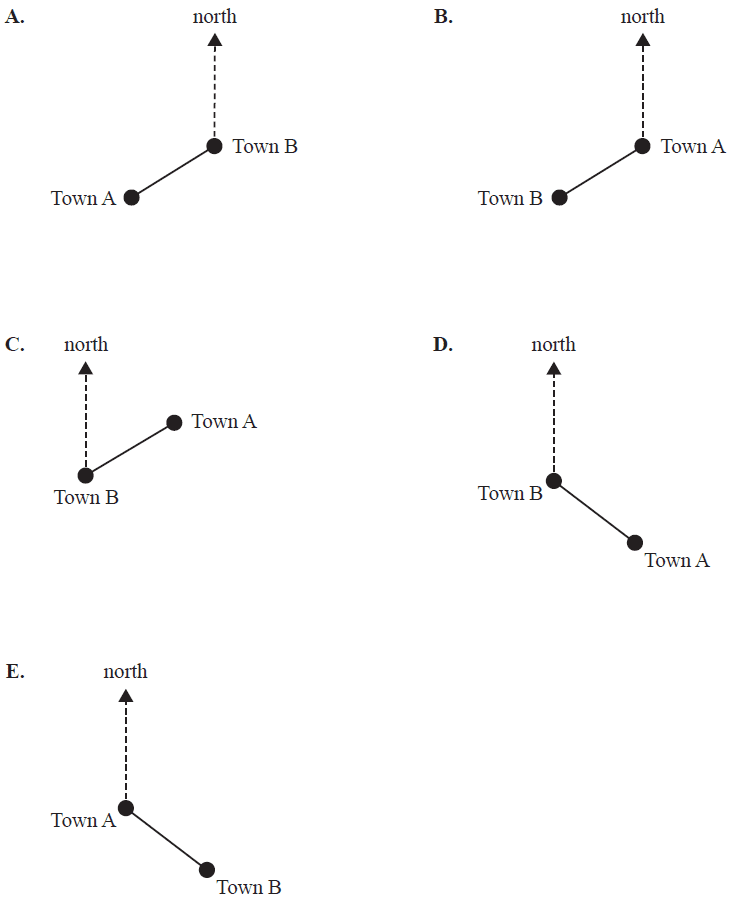
Town B is located on a bearing of 060° from Town A.
The diagram that could illustrate this is
An ice cream dessert is in the shape of a hemisphere. The dessert has a radius of 5 cm.
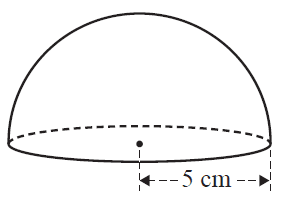
The top and the base of the dessert are covered in chocolate.
The total surface area, in square centimetres, that is covered in chocolate is closest to
- A. 52
- B. 157
- C. 236
- D. 314
- E. 942
Triangle \(M\), shown below, has side lengths of 3 cm, 4 cm and 5 cm.
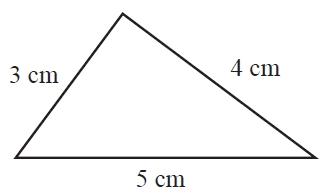
Four other triangles have the following side lengths:
- Triangle \(N\) has side lengths of 3 cm, 6 cm and 8 cm.
- Triangle \(O\) has side lengths of 4 cm, 8 cm and 12 cm.
- Triangle \(P\) has side lengths of 6 cm, 8 cm and 10 cm.
- Triangle \(Q\) has side lengths of 9 cm, 12 cm and 15 cm.
The triangles that are similar to triangle \(M\) are
- A. triangle \(N\) and triangle \(O\).
- B. triangle \(N\), triangle \(O\) and triangle \(P\).
- C. triangle \(O\) and triangle \(P\).
- D. triangle \(O\) and triangle \(Q\).
- E. triangle \(P\) and triangle \(Q\).
In triangle \(ABC\), the point \(D\) lies on the line \(AC\), as shown in the diagram below.
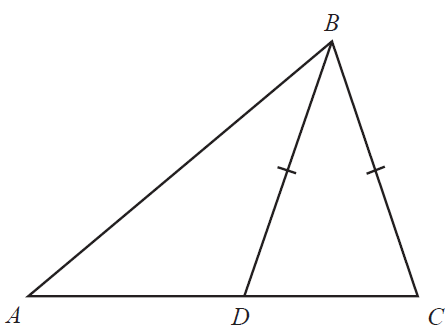
The length of the line \(BC\) is equal to the length of the line \(BD\).
Which one of the following statements is true?
- A. The angle \(BAD\) is equal to the angle \(ADB\).
- B. The angle \(ADB\) is equal to the angle \(BDC\).
- C. The sum of the angle \(ACB\) and the angle \(ADB\) is equal to 180°.
- D. The sum of the angle \(ABD\) and the angle \(CBD\) is equal to 180°.
- E. The sum of the angle \(ABC\) and the angle \(ACB\) is equal to the angle \(ADB\).
All cities in China are in the same time zone.
Wuhan (31° N, 114° E) and Chengdu (31° N, 104° E) are both cities in China.
On one day in January, the sun set in Wuhan at 5.50 pm.
Assuming that 15° of longitude equates to a one-hour time difference, the time the sun set in Chengdu on the same day is
- A. 4.20 pm
- B. 5.10 pm
- C. 5.50 pm
- D. 6.30 pm
- E. 7.20 pm
A can of dog food is in the shape of a cylinder. The can has a circumference of 18.85 cm and a volume of 311 cm³.
The height of the can, in centimetres, is closest to
- A. 2.8
- B. 3.0
- C. 6.0
- D. 11.0
- E. 16.5
Four identical circles of radius \(r\) are drawn inside a square, as shown in the diagram below.
The region enclosed by the circles has been shaded in the diagram.
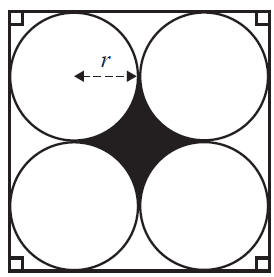
The shaded area can be found using
- A. \(4r^2 - 2\pi r\)
- B. \(4r^2 - \pi r^2\)
- C. \(4r - \pi r^2\)
- D. \(2r^2 - \pi r^2\)
- E. \(2r - 2\pi r\)
Module 4 – Graphs and relations
Question 1The graph below shows the water level in a creek, in metres, over a 12-hour period.
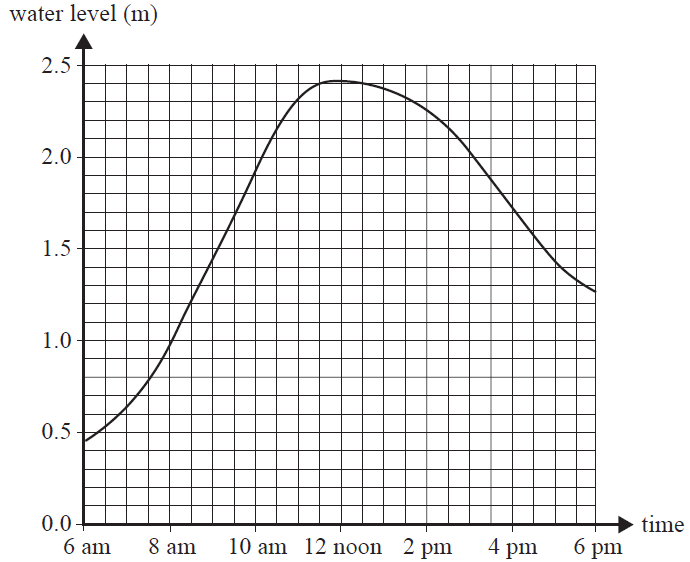
Compared to the water level at 8 am, the water level at 12 noon was closest to
- A. 1.0 m higher.
- B. 1.4 m higher.
- C. 2.4 m higher.
- D. 0.9 m lower.
- E. 1.3 m lower.
The cost, \($C\), of using \(K\) kilowatt hours of electricity can be calculated using the equation below.
\(C = 52.00 + 0.15 \times K\)
From this equation, it can be concluded that there is
- A. no fixed charge and the electricity used is charged at $0.15 per kilowatt hour.
- B. no fixed charge and the electricity used is charged at $52.00 per kilowatt hour.
- C. a fixed charge of $0.15 and the electricity used is charged at $52.00 per kilowatt hour.
- D. a fixed charge of $52.00 and the electricity used is charged at $0.15 per kilowatt hour.
- E. a fixed charge of $52.00 and the electricity used is charged at $15.00 per kilowatt hour.
A shop sells two types of discs: compact discs (CDs) and digital video discs (DVDs).
CDs are sold for $7.00 each and DVDs are sold for $13.00 each.
Bonnie bought a total of 16 discs for $178.00
How many DVDs did Bonnie buy?
- A. 3
- B. 5
- C. 7
- D. 9
- E. 11
The graph below shows a straight line that crosses the \(x\)-axis at \((-10, 0)\), passes through the point \((-6, 8)\) and crosses the \(y\)-axis at \((0, q)\).
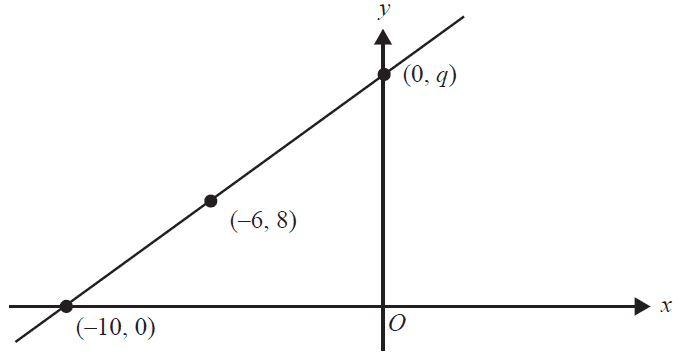
What is the value of \(q\)?
- A. 14
- B. 16
- C. 18
- D. 20
- E. 22
Giovanni makes and sells toy train sets.
Each toy train set costs $40.00 to make and sells for $65.00
Giovanni also has a fixed cost for making a batch of toy train sets.
Last Sunday, Giovanni sold a batch of 35 toy train sets for a profit of $250.
Giovanni's fixed cost for this batch of train sets is
- A. $250
- B. $625
- C. $875
- D. $1400
- E. $2275
A recipe for a fruit drink lists both pineapple juice and mango juice.
Let \(x\) be the number of millilitres of pineapple juice required to make the fruit drink.
Let \(y\) be the number of millilitres of mango juice required to make the fruit drink.
For every 200 mL of mango juice that is used, at least 300 mL of pineapple juice must be used.
The inequality representing this situation is
- A. \( x \le \frac{2y}{3} \)
- B. \( x \le \frac{3y}{2} \)
- C. \( y \le \frac{2x}{3} \)
- D. \( y \le \frac{3x}{2} \)
- E. \( y \le \frac{2x}{5} \)
The feasible region for a linear programming problem is shaded in the diagram below.
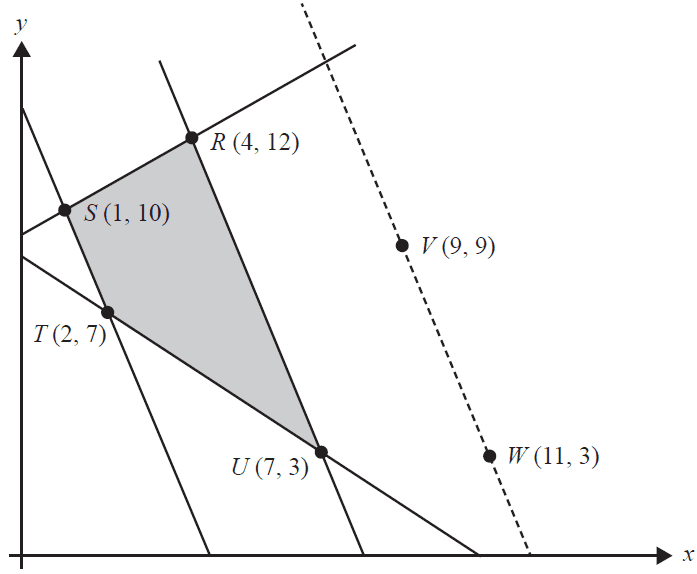
The equation of the objective function for this problem is of the form
\(P = mx + ny, \quad \text{where } m > 0 \text{ and } n > 0\)
The dotted line passing through the points \(V\) and \(W\) in the diagram has the same slope as the objective function for this problem.
The minimum value of the objective function can be determined by calculating its value at
- A. point \(S\) only.
- B. point \(T\) only.
- C. point \(U\) only.
- D. any point along the line segment \(RU\).
- E. any point along the line segment \(ST\).
Jenny and Alan's house is 900 m from a supermarket.
Jenny is at the house and Alan is at the supermarket.
At 12 noon Jenny leaves the house and walks towards the supermarket.
At the same time, Alan leaves the supermarket and walks towards the house.
Jenny's planned walk is modelled by the equation
\[ j = \begin{cases} 120t & 0 < t \le 2 \\ 100t + 40 & 2 < t \le 6 \\ 65t + 250 & 6 < t \le 10 \end{cases} \]
where \(j\) is Jenny's distance, in metres, from the house after \(t\) minutes.
Alan's planned walk is modelled by the equation
\( a = -80t + 900 \quad t > 0 \)
where \(a\) is Alan's distance, in metres, from the house after \(t\) minutes.
When they meet
- A. Jenny will have walked 359 m, to the nearest metre.
- B. Alan will have walked 360 m, to the nearest metre.
- C. Alan will have walked 382 m, to the nearest metre.
- D. Alan will have walked 518 m, to the nearest metre.
- E. Jenny will have walked 541 m, to the nearest metre.
End of Multiple-Choice Question Book
VCE is a registered trademark of the VCAA. The VCAA does not endorse or make any warranties regarding this study resource. Past VCE exams and related content can be accessed directly at www.vcaa.vic.edu.au
