2018 VCE Further Maths Exam 1
This is the full VCE Further Maths Exam with worked solutions. You can also try Mini-Tests, which are official VCAA exams split into short tests you can do anytime.
Number of marks: 40
Reading time: 15 minutes
Writing time: 1.5 hours
Instructions
• Answer all questions in pencil on your Multiple-Choice Answer Sheet.
• Choose the response that is correct for the question.
• A correct answer scores 1; an incorrect answer scores 0.
• Marks will not be deducted for incorrect answers.
• No marks will be given if more than one answer is completed for any question.
• Unless otherwise indicated, the diagrams in this book are not drawn to scale.
Data analysis
Use the following information to answer Questions 1 and 2.
The dot plot below displays the difference in travel time between the morning peak and the evening peak travel times for the same journey on 25 days.
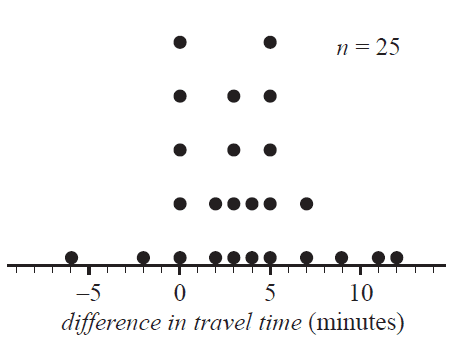
The percentage of days when there was five minutes difference in travel time between the morning peak and the evening peak travel times is
- A. \(0\%\)
- B. \(5\%\)
- C. \(20\%\)
- D. \(25\%\)
- E. \(28\%\)
The median difference in travel time is
- A. 3.0 minutes.
- B. 3.5 minutes.
- C. 4.0 minutes.
- D. 4.5 minutes.
- E. 5.0 minutes.
Use the following information to answer Questions 3–5.
The pulse rates of a population of Year 12 students are approximately normally distributed with a mean of 69 beats per minute and a standard deviation of 4 beats per minute.
Question 3A student selected at random from this population has a standardised pulse rate of \(z = -2.5\)
This student’s actual pulse rate is
- A. 59 beats per minute.
- B. 63 beats per minute.
- C. 65 beats per minute.
- D. 73 beats per minute.
- E. 79 beats per minute.
Another student selected at random from this population has a standardised pulse rate of \(z = -1\).
The percentage of students in this population with a pulse rate greater than this student is closest to
- A. 2.5%
- B. 5%
- C. 16%
- D. 68%
- E. 84%
A sample of 200 students was selected at random from this population.
The number of these students with a pulse rate of less than 61 beats per minute or greater than 73 beats per minute is closest to
- A. 19
- B. 37
- C. 64
- D. 95
- E. 190
Data was collected to investigate the association between the following two variables:
- age (29 and under, 30–59, 60 and over)
- uses public transport (yes, no)
Which one of the following is appropriate to use in the statistical analysis of this association?
- A. a scatterplot
- B. parallel box plots
- C. a least squares line
- D. a segmented bar chart
- E. the correlation coefficient \(r\)
Use the following information to answer Questions 7–9.
The scatterplot below displays the resting pulse rate, in beats per minute, and the time spent exercising, in hours per week, of 16 students. A least squares line has been fitted to the data.
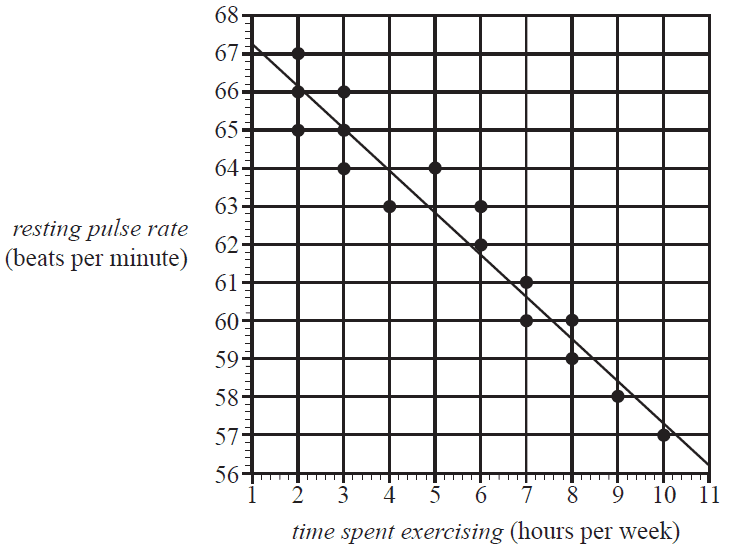
Using this least squares line to model the association between resting pulse rate and time spent exercising, the residual for the student who spent four hours per week exercising is closest to
- A. –2.0 beats per minute.
- B. –1.0 beats per minute.
- C. –0.3 beats per minute.
- D. 1.0 beats per minute.
- E. 2.0 beats per minute.
The equation of this least squares line is closest to
- A. resting pulse rate = 67.2 – 0.91 × time spent exercising
- B. resting pulse rate = 67.2 – 1.10 × time spent exercising
- C. resting pulse rate = 68.3 – 0.91 × time spent exercising
- D. resting pulse rate = 68.3 – 1.10 × time spent exercising
- E. resting pulse rate = 67.2 + 1.10 × time spent exercising
The coefficient of determination is 0.8339
The correlation coefficient \(r\) is closest to
- A. –0.913
- B. –0.834
- C. –0.695
- D. 0.834
- E. 0.913
In a study of the association between a person’s height, in centimetres, and body surface area, in square metres, the following least squares line was obtained.
body surface area = –1.1 + 0.019 × height
Which one of the following is a conclusion that can be made from this least squares line?
- A. An increase of 1 m² in body surface area is associated with an increase of 0.019 cm in height.
- B. An increase of 1 cm in height is associated with an increase of 0.019 m² in body surface area.
- C. The correlation coefficient is 0.019
- D. A person’s body surface area, in square metres, can be determined by adding 1.1 cm to their height.
- E. A person’s height, in centimetres, can be determined by subtracting 1.1 from their body surface area, in square metres.
Freya uses the following data to generate the scatterplot below.
| x | 1 | 2 | 3 | 4 | 5 | 6 | 7 | 8 | 9 | 10 |
| y | 105 | 48 | 35 | 23 | 18 | 16 | 12 | 12 | 9 | 9 |
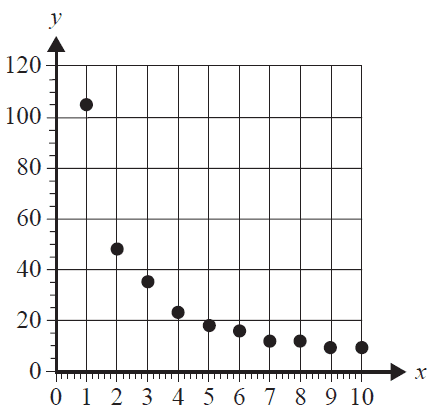
The scatterplot shows that the data is non-linear.
To linearise the data, Freya applies a reciprocal transformation to the variable \(y\).
She then fits a least squares line to the transformed data.
With \(x\) as the explanatory variable, the equation of this least squares line is closest to
- A. \(\frac{1}{y} = -0.0039 + 0.012x\)
- B. \(\frac{1}{y} = -0.025 + 1.1x\)
- C. \(\frac{1}{y} = 7.8 - 0.082x\)
- D. \(y = 45.3 + 59.7 \times \frac{1}{x}\)
- E. \(y = 59.7 + 45.3 \times \frac{1}{x}\)
A \(\log_{10}(y)\) transformation was used to linearise a set of non-linear bivariate data.
A least squares line was then fitted to the transformed data.
The equation of this least squares line is
\(\log_{10}(y) = 3.1 - 2.3x\)
This equation is used to predict the value of \(y\) when \(x = 1.1\)
The value of \(y\) is closest to
- A. –0.24
- B. 0.57
- C. 0.91
- D. 1.6
- E. 3.7
The statistical analysis of a set of bivariate data involving variables \(x\) and \(y\) resulted in the information displayed in the table below.
| Mean | \(\bar{x} = 27.8\) | \(\bar{y} = 33.4\) |
| Standard deviation | \(s_x = 2.33\) | \(s_y = 3.24\) |
| Equation of the least squares line | \(y = -2.84 + 1.31x\) | |
Using this information, the value of the correlation coefficient \(r\) for this set of bivariate data is closest to
- A. 0.88
- B. 0.89
- C. 0.92
- D. 0.94
- E. 0.97
A least squares line is fitted to a set of bivariate data.
Another least squares line is fitted with response and explanatory variables reversed.
Which one of the following statistics will not change in value?
- A. the residual values
- B. the predicted values
- C. the correlation coefficient \(r\)
- D. the slope of the least squares line
- E. the intercept of the least squares line
The table below shows the monthly profit, in dollars, of a new coffee shop for the first nine months of 2018.
| Month | Jan. | Feb. | Mar. | Apr. | May | June | July | Aug. | Sept. |
| Profit ($) | 2890 | 1978 | 2402 | 2456 | 4651 | 3456 | 2823 | 2678 | 2345 |
Using four-mean smoothing with centring, the smoothed profit for May is closest to
- A. $2502
- B. $3294
- C. $3503
- D. $3804
- E. $4651
The quarterly sales figures for a large suburban garden centre, in millions of dollars, for 2016 and 2017 are displayed in the table below.
| Year | Quarter 1 | Quarter 2 | Quarter 3 | Quarter 4 |
|---|---|---|---|---|
| 2016 | 1.73 | 2.87 | 3.34 | 1.23 |
| 2017 | 1.03 | 2.45 | 2.05 | 0.78 |
Using these sales figures, the seasonal index for Quarter 3 is closest to
- A. 1.28
- B. 1.30
- C. 1.38
- D. 1.46
- E. 1.48
Recursion and financial modelling
Use the following information to answer Questions 17 and 18.
The value of an annuity investment, in dollars, after \(n\) years, \(V_n\), can be modelled by the recurrence relation shown below.
\(V_0 = 46\,000, \quad V_{n+1} = 1.0034 V_n + 500\)
Question 17What is the value of the regular payment added to the principal of this annuity investment?
- A. $34.00
- B. $156.40
- C. $466.00
- D. $500.00
- E. $656.40
Between the second and third years, the increase in the value of this investment is closest to
- A. $656
- B. $658
- C. $661
- D. $1315
- E. $1975
Daniel borrows $5000, which he intends to repay fully in a lump sum after one year.
The annual interest rate and compounding period for five different compound interest loans are given below:
- Loan I – 12.6% per annum, compounding weekly
- Loan II – 12.8% per annum, compounding weekly
- Loan III – 12.9% per annum, compounding weekly
- Loan IV – 12.7% per annum, compounding quarterly
- Loan V – 13.2% per annum, compounding quarterly
When fully repaid, the loan that will cost Daniel the least amount of money is
- A. Loan I.
- B. Loan II.
- C. Loan III.
- D. Loan IV.
- E. Loan V.
The graph below shows the value, \(V_n\), of an asset as it depreciates over a period of five months.
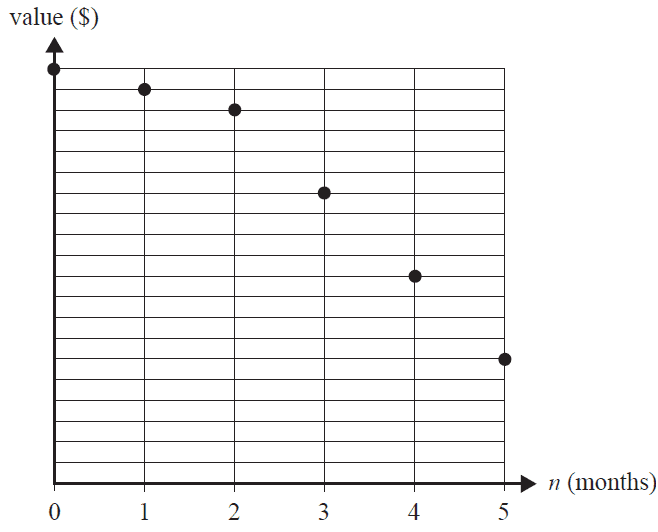
Which one of the following depreciation situations does this graph best represent?
- A. flat rate depreciation with a decrease in depreciation rate after two months
- B. flat rate depreciation with an increase in depreciation rate after two months
- C. unit cost depreciation with a decrease in units used per month after two months
- D. reducing balance depreciation with an increase in the rate of depreciation after two months
- E. reducing balance depreciation with a decrease in the rate of depreciation after two months
Which one of the following recurrence relations could be used to model the value of a perpetuity investment, \(P_n\), after \(n\) months?
- A. \(P_0 = 120\,000, \quad P_{n+1} = 1.0029 \times P_n - 356\)
- B. \(P_0 = 180\,000, \quad P_{n+1} = 1.0047 \times P_n - 846\)
- C. \(P_0 = 210\,000, \quad P_{n+1} = 1.0071 \times P_n - 1534\)
- D. \(P_0 = 240\,000, \quad P_{n+1} = 0.0047 \times P_n - 2232\)
- E. \(P_0 = 250\,000, \quad P_{n+1} = 0.0085 \times P_n - 2125\)
Adam has a home loan with a present value of $175 260.56
The interest rate for Adam’s loan is 3.72% per annum, compounding monthly.
His monthly repayment is $3200.
The loan is to be fully repaid after five years.
Adam knows that the loan cannot be exactly repaid with 60 repayments of $3200.
To solve this problem, Adam will make 59 repayments of $3200. He will then adjust the value of the final repayment so that the loan is fully repaid with the 60th repayment.
The value of the 60th repayment will be closest to
- A. $368.12
- B. $2831.88
- C. $3200.56
- D. $3557.09
- E. $3568.12
Five lines of an amortisation table for a reducing balance loan with monthly repayments are shown below.
| Repayment number | Repayment | Interest | Principal reduction | Balance of loan |
|---|---|---|---|---|
| 25 | $2200.00 | $972.24 | $1227.76 | $230 256.78 |
| 26 | $2200.00 | $967.08 | $1232.92 | $229 023.86 |
| 27 | $2200.00 | $961.90 | $1238.10 | $227 785.76 |
| 28 | $2200.00 | $1002.26 | $1197.74 | $226 588.02 |
| 29 | $2200.00 | $996.99 | $1203.01 | $225 385.01 |
The interest rate for this loan changed immediately before repayment number 28.
This change in interest rate is best described as
- A. an increase of 0.24% per annum.
- B. a decrease of 0.024% per annum.
- C. an increase of 0.024% per annum.
- D. a decrease of 0.0024% per annum.
- E. an increase of 0.00024% per annum.
Mariska plans to retire from work 10 years from now.
Her retirement goal is to have a balance of $600 000 in an annuity investment at that time.
The present value of this annuity investment is $265 298.48, on which she earns interest at the rate of 3.24% per annum, compounding monthly.
To make this investment grow faster, Mariska will add a $1000 payment at the end of every month.
Two years from now, she expects the interest rate of this investment to fall to 3.20% per annum, compounding monthly. It is expected to remain at this rate until Mariska retires.
When the interest rate drops, she must increase her monthly payment if she is to reach her retirement goal.
The value of this new monthly payment will be closest to
- A. $1234
- B. $1250
- C. $1649
- D. $1839
- E. $1854
Module 1 – Matrices
Which one of the following matrices has a determinant of zero?
- A. \(\begin{bmatrix} 0 & 1 \\ 1 & 0 \end{bmatrix}\)
- B. \(\begin{bmatrix} 1 & 0 \\ 0 & 1 \end{bmatrix}\)
- C. \(\begin{bmatrix} 1 & 2 \\ -3 & 6 \end{bmatrix}\)
- D. \(\begin{bmatrix} 3 & 6 \\ 2 & 4 \end{bmatrix}\)
- E. \(\begin{bmatrix} 4 & 0 \\ 0 & -2 \end{bmatrix}\)
The matrix product \(\begin{bmatrix} 4 & 2 & 0 \end{bmatrix} \times \begin{bmatrix} 4 \\ 12 \\ 8 \end{bmatrix}\) is equal to
- A. \(\begin{bmatrix} 144 \end{bmatrix}\)
- B. \(\begin{bmatrix} 16 \\ 24 \\ 0 \end{bmatrix}\)
- C. \(4 \times \begin{bmatrix} 1 & 2 & 0 \end{bmatrix} \times \begin{bmatrix} 12 \\ 8 \end{bmatrix}\)
- D. \(2 \times \begin{bmatrix} 2 & 1 & 0 \end{bmatrix} \times \begin{bmatrix} 2 \\ 6 \\ 4 \end{bmatrix}\)
- E. \(4 \times \begin{bmatrix} 2 & 1 & 0 \end{bmatrix} \times \begin{bmatrix} 2 \\ 6 \\ 4 \end{bmatrix}\)
Five people, India (I), Jackson (J), Krishna (K), Leanne (L) and Mustafa (M), competed in a table tennis tournament.
Each competitor played every other competitor once only.
Each match resulted in a winner and a loser.
The matrix below shows the tournament results.
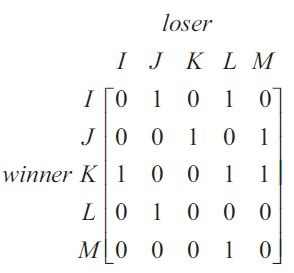
A ‘1’ in the matrix shows that the competitor named in that row defeated the competitor named in that column.
For example, the ‘1’ in the fourth row shows that Leanne defeated Jackson.
A ‘0’ in the matrix shows that the competitor named in that row lost to the competitor named in that column.
There is an error in the matrix. The winner of one of the matches has been incorrectly recorded as a ‘0’.
This match was between
- A. India and Mustafa.
- B. India and Krishna.
- C. Krishna and Leanne.
- D. Leanne and Mustafa.
- E. Jackson and Mustafa.
Matrix \(P\) is a \(4 \times 4\) permutation matrix.
Matrix \(W\) is another matrix such that the matrix product \(P \times W\) is defined.
This matrix product results in the entire first and third rows of matrix \(W\) being swapped.
The permutation matrix \(P\) is
- A. \(\begin{bmatrix} 0 & 0 & 0 & 1 \\ 0 & 1 & 0 & 0 \\ 0 & 0 & 1 & 0 \\ 0 & 0 & 0 & 1 \end{bmatrix}\)
- B. \(\begin{bmatrix} 0 & 0 & 1 & 0 \\ 0 & 1 & 0 & 0 \\ 1 & 0 & 0 & 0 \\ 0 & 0 & 0 & 1 \end{bmatrix}\)
- C. \(\begin{bmatrix} 1 & 0 & 0 & 0 \\ 0 & 0 & 0 & 0 \\ 1 & 0 & 0 & 0 \\ 0 & 0 & 0 & 0 \end{bmatrix}\)
- D. \(\begin{bmatrix} 1 & 0 & 0 & 0 \\ 0 & 0 & 0 & 0 \\ 0 & 0 & 1 & 0 \\ 0 & 0 & 0 & 0 \end{bmatrix}\)
- E. \(\begin{bmatrix} 1 & 0 & 0 & 0 \\ 0 & 1 & 0 & 0 \\ 1 & 0 & 0 & 0 \\ 0 & 0 & 0 & 1 \end{bmatrix}\)
Liam cycles, runs, swims and walks for exercise several times a month.
Each time he cycles, Liam covers a distance of \(c\) kilometres.
Each time he runs, Liam covers a distance of \(r\) kilometres.
Each time he swims, Liam covers a distance of \(s\) kilometres.
Each time he walks, Liam covers a distance of \(w\) kilometres.
The number of times that Liam cycled, ran, swam and walked each month over a four-month period, and the total distance that Liam travelled in each of those months, are shown in the table below.
| Number of times in a month | Total distance for a month (km) | ||||
|---|---|---|---|---|---|
| Cycle | Run | Swim | Walk | ||
| Month 1 | 5 | 7 | 6 | 8 | 160 |
| Month 2 | 8 | 6 | 9 | 7 | 172 |
| Month 3 | 7 | 8 | 7 | 6 | 165 |
| Month 4 | 8 | 8 | 5 | 5 | 162 |
The matrix that contains the distance each time Liam cycled, ran, swam and walked, \(\begin{bmatrix} c \\ r \\ s \\ w \end{bmatrix}\), is
- A. \(\begin{bmatrix} 5 \\ 6 \\ 7 \\ 5 \end{bmatrix}\)
- B. \(\begin{bmatrix} 8 \\ 6 \\ 1 \\ 9 \end{bmatrix}\)
- C. \(\begin{bmatrix} 8 \\ 6 \\ 7 \\ 9 \end{bmatrix}\)
- D. \(\begin{bmatrix} 8 \\ 8 \\ 9 \\ 8 \end{bmatrix}\)
- E. \(\begin{bmatrix} 4290 \\ 4931 \\ 4623 \\ 4291 \end{bmatrix}\)
A transition matrix, \(V\), is shown below.
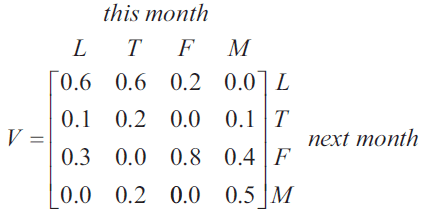
The transition diagram below has been constructed from the transition matrix \(V\).
The labelling in the transition diagram is not yet complete.
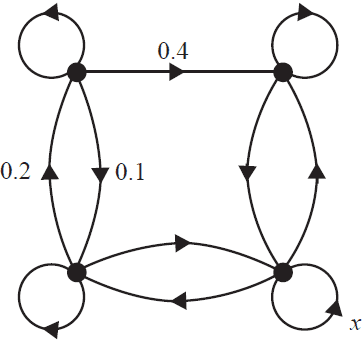
The proportion for one of the transitions is labelled \(x\).
The value of \(x\) is
- A. 0.2
- B. 0.5
- C. 0.6
- D. 0.7
- E. 0.8
A study of the antelope population in a wildlife park has shown that antelope regularly move between three locations, east (E), north (N) and west (W).
Let \(A_n\) be the state matrix that shows the population of antelope in each location \(n\) months after the study began.
The expected population of antelope in each location can be determined by the matrix recurrence rule
\(A_{n+1} = TA_n - D\)
where
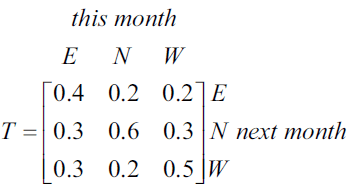
and
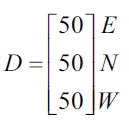
The state matrix, \(A_3\), below shows the population of antelope three months after the study began.
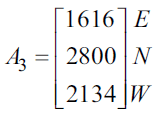
The number of antelope in the west (W) location two months after the study began, as found in the state matrix \(A_2\), is closest to
- A. 2060
- B. 2130
- C. 2200
- D. 2240
- E. 2270
A public library organised 500 of its members into five categories according to the number of books each member borrows each month.
These categories are
\(J\) = no books borrowed per month
\(K\) = one book borrowed per month
\(L\) = two books borrowed per month
\(M\) = three books borrowed per month
\(N\) = four or more books borrowed per month
The transition matrix, \(T\), below shows how the number of books borrowed per month by the members is expected to change from month to month.
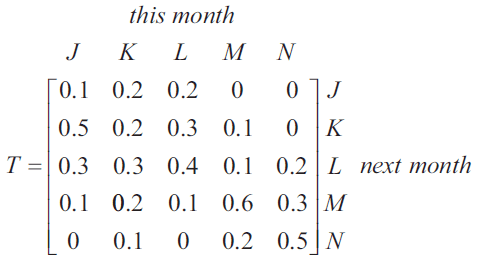
In the long term, which category is expected to have approximately 96 members each month?
- A. J
- B. K
- C. L
- D. M
- E. N
Module 2 – Networks and decision mathematics
Consider the graph with five isolated vertices shown below.

To form a tree, the minimum number of edges that must be added to the graph is
- A. 1
- B. 4
- C. 5
- D. 6
- E. 10
Niko drives from his home to university.
The network below shows the distances, in kilometres, along a series of streets connecting Niko’s home to the university.
The vertices \(A, B, C, D\) and \(E\) represent the intersection of these streets.
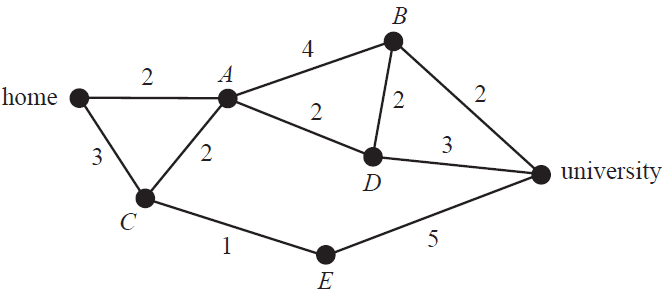
The shortest path for Niko from his home to the university could be found using
- A. a minimum cut.
- B. Prim’s algorithm.
- C. Dijkstra’s algorithm.
- D. critical path analysis.
- E. the Hungarian algorithm.
A planar graph has five faces.
This graph could have
- A. eight vertices and eight edges.
- B. six vertices and eight edges.
- C. eight vertices and five edges.
- D. eight vertices and six edges.
- E. five vertices and eight edges.
Consider the graph below.
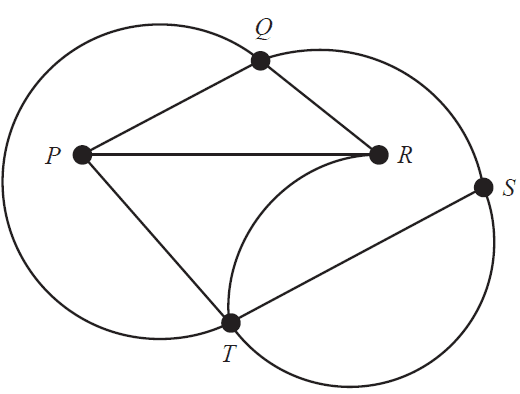
Which one of the following is not a path for this graph?
- A. PRQTS
- B. PQRTS
- C. PRTSQ
- D. PTQSR
- E. PTRQS
The directed network below shows the sequence of 11 activities that are needed to complete a project.
The time, in weeks, that it takes to complete each activity is also shown.
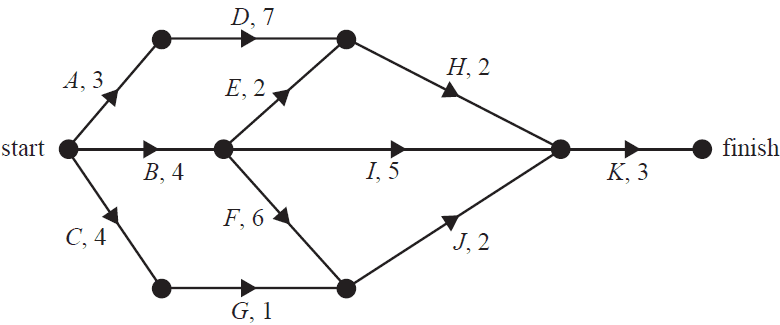
How many of these activities could be delayed without affecting the minimum completion time of the project?
- A. 3
- B. 4
- C. 5
- D. 6
- E. 7
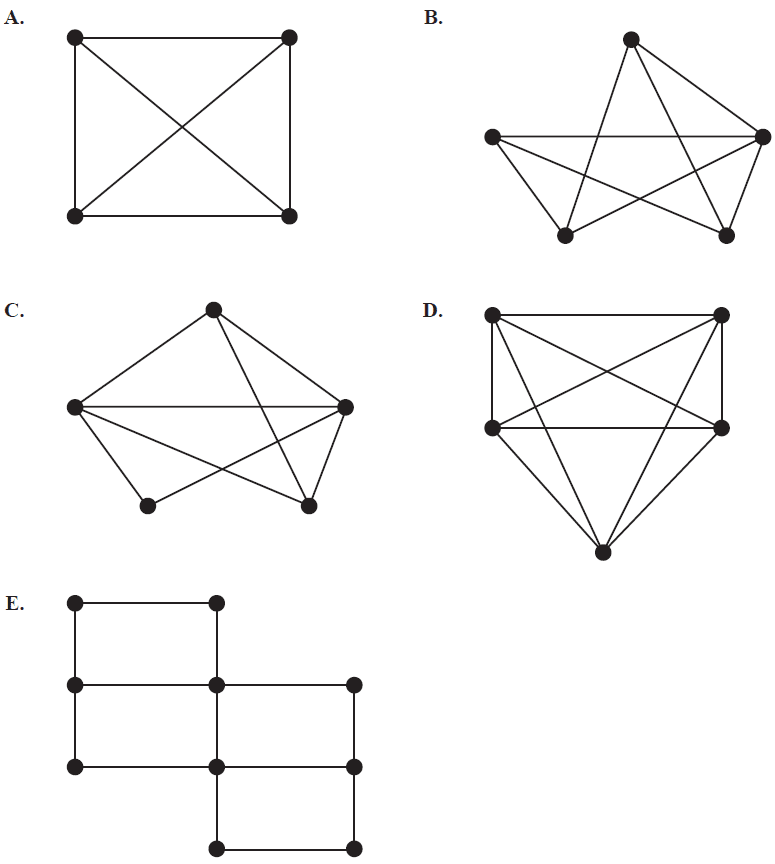
Which one of the following graphs is not a planar graph?
A project requires nine activities (A–I) to be completed. The duration, in hours, and the immediate predecessor(s) of each activity are shown in the table below.
| Activity | Duration (hours) | Immediate predecessor(s) |
|---|---|---|
| A | 4 | – |
| B | 3 | A |
| C | 7 | A |
| D | 2 | A |
| E | 5 | B |
| F | 2 | C |
| G | 4 | E, F |
| H | 5 | D |
| I | 3 | G, H |
The minimum completion time for this project, in hours, is
- A. 14
- B. 19
- C. 20
- D. 24
- E. 35
Annie, Buddhi, Chuck and Dorothy work in a factory.
Today each worker will complete one of four tasks, 1, 2, 3 and 4.
The usual completion times for Annie, Chuck and Dorothy are shown in the table below.
| Task 1 | Task 2 | Task 3 | Task 4 | |
|---|---|---|---|---|
| Annie | 7 | 3 | 8 | 2 |
| Buddhi | \(k\) | \(k\) | 3 | \(k\) |
| Chuck | 5 | 6 | 9 | 2 |
| Dorothy | 4 | 8 | 5 | 3 |
Buddhi takes 3 minutes for Task 3.
He takes \(k\) minutes for each other task.
Today the factory supervisor allocates the tasks as follows:
- Task 1 to Dorothy
- Task 2 to Annie
- Task 3 to Buddhi
- Task 4 to Chuck
This allocation will achieve the minimum total completion time if the value of \(k\) is at least
- A. 0
- B. 1
- C. 2
- D. 3
- E. 4
Module 3 – Geometry and measurement
Henry flies a kite attached to a long string, as shown in the diagram below.
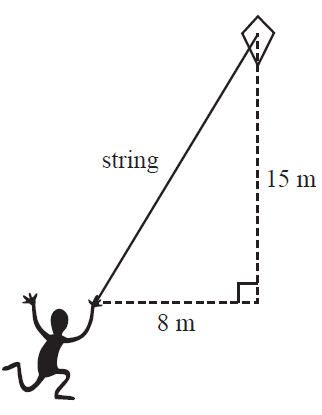
The horizontal distance of the kite to Henry’s hand is 8 m.
The vertical distance of the kite above Henry’s hand is 15 m.
The length of the string, in metres, is
- A. 13
- B. 17
- C. 23
- D. 161
- E. 289
A triangle PQR is shown in the diagram below.
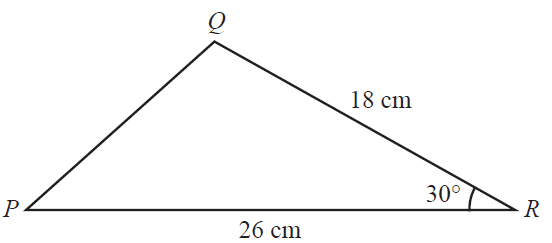
The length of the side QR is 18 cm.
The length of the side PR is 26 cm.
The angle QRP is 30°.
The area of triangle PQR, in square centimetres, is closest to
- A. 117
- B. 162
- C. 171
- D. 234
- E. 468
The city of Karachi in Pakistan has latitude 25° N and longitude 67° E.
Assume that the radius of Earth is 6400 km.
The shortest distance along the surface of Earth between Karachi and the North Pole, in kilometres, can be found by evaluating which one of the following products?
- A. \(\frac{23}{180} \times \pi \times 6400\)
- B. \(\frac{25}{180} \times \pi \times 6400\)
- C. \(\frac{65}{180} \times \pi \times 6400\)
- D. \(\frac{67}{180} \times \pi \times 6400\)
- E. \(\frac{23}{360} \times \pi \times 6400\)
The course for a yacht race is triangular in shape and is marked by three buoys, \(T, U\) and \(V\).
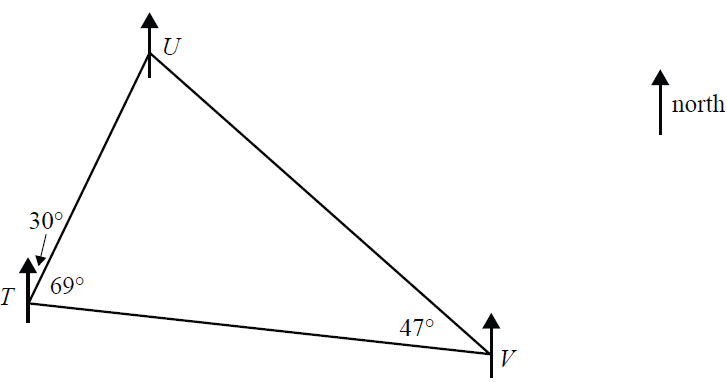
Starting from buoy \(T\), the yachts sail on a bearing of 030° to buoy \(U\).
From buoy \(U\) the yachts sail to buoy \(V\) and then to buoy \(T\).
The angle \(UTV\) is 69° and the angle \(UVT\) is 47°.
The bearing of buoy \(U\) from buoy \(V\) is
- A. 034°
- B. 047°
- C. 133°
- D. 279°
- E. 326°
On the first day of June 2019 in the city of St Petersburg, Russia, (60° N, 30° E) the sun is expected to rise at 3.48 am.
On this same day, the sun is expected to rise in Helsinki, Finland, (60° N, 25° E) approximately
- A. at the same time.
- B. 20 minutes earlier.
- C. 20 minutes later.
- D. one hour earlier.
- E. one hour later.
Aaliyah is bushwalking.
She walks 5.4 km from a starting point on a bearing of 045° until she reaches a hut. From this hut, she walks 2.8 km on a bearing of 300° until she reaches a river.
From the river, she turns and walks back directly to the starting point.
The total distance that she walks, in kilometres, is closest to
- A. 8.2
- B. 13.2
- C. 13.6
- D. 14.1
- E. 14.9
A windscreen wiper blade can clean a large area of windscreen glass, as shown by the shaded area in the diagram below.
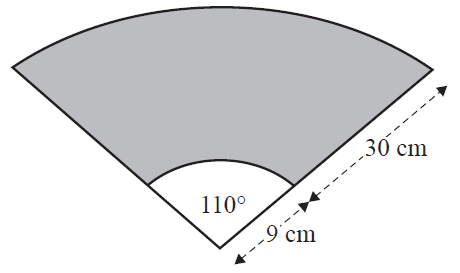
The windscreen wiper blade is 30 cm long and it is attached to a 9 cm long arm.
The arm and blade move back and forth in a circular arc with an angle of 110° at the centre.
The area cleaned by this blade, in square centimetres, is closest to
- A. 786
- B. 1382
- C. 2573
- D. 2765
- E. 4524
A cone with a radius of 2.5 cm is shown in the diagram below.
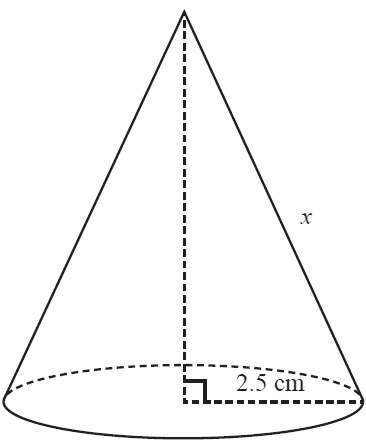
The slant edge, \(x\), of this cone is also shown.
The volume of this cone is 36 cm³.
The surface area of this cone, including the base, can be found using the rule surface area = \(\pi r(r + x)\).
The total surface area of this cone, including the base, in square centimetres, is closest to
- A. 20
- B. 42
- C. 63
- D. 67
- E. 90
Module 4 – Graphs and relations
The graph below shows a line intersecting the \(x\)-axis at (4, 0) and the \(y\)-axis at (0, 2).
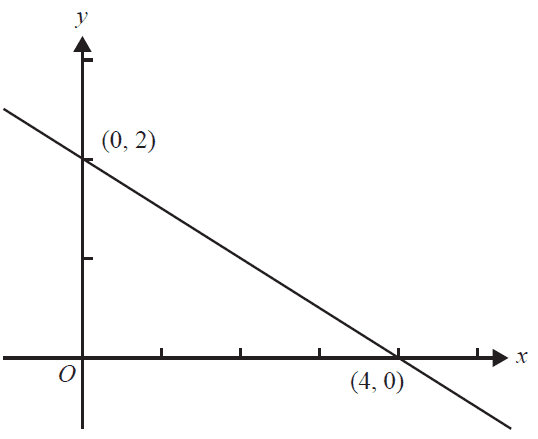
The gradient of this line is
- A. –4
- B. –2
- C. \(-\frac{1}{2}\)
- D. \(\frac{1}{2}\)
- E. 4
Steven is a wedding photographer.
He charges his clients a fixed fee of $500, plus $250 per hour of photography.
The equation that represents the total amount, $C, Steven charges, for \(t\) hours of photography is
- A. \(C = 250t\)
- B. \(C = 500t\)
- C. \(C = 750t\)
- D. \(C = 500 + 250t\)
- E. \(C = 250 + 500t\)
The three inequalities below were used to construct the feasible region for a linear programming problem.
\(x < 3\)
\(y < 6\)
\(x + y > 6\)
A point that lies within this feasible region is
- A. (0, 6)
- B. (1, 5)
- C. (2, 4)
- D. (2, 5)
- E. (3, 6)
A team of four students competes in a 4 × 100 m relay race.
Each student in the race runs 100 m.
The order in which each student runs in the race is shown in the table below.
| Order | Name |
|---|---|
| first | Joanne |
| second | Elle |
| third | Sam |
| fourth | Kristen |
The following line-segment graph represents the race for Joanne, Sam and Kristen, where \(d\) is the distance, in metres, from the starting point and \(t\) is the recorded time, in seconds.
Elle’s line segment is missing.
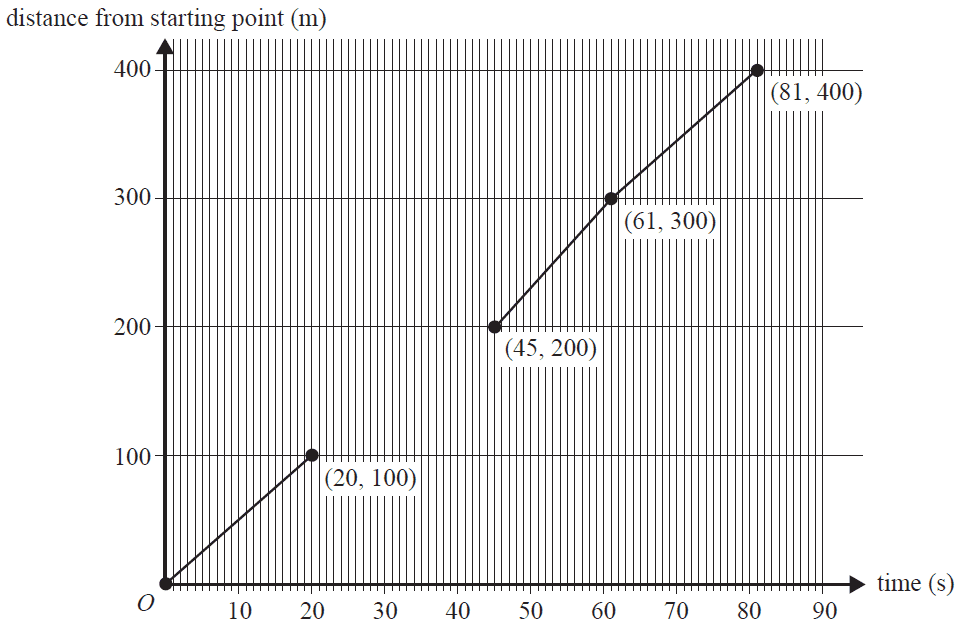
The equation representing Elle’s line segment is
- A. \(d = 4t\)
- B. \(d = 4t + 20\)
- C. \(d = 5t\)
- D. \(d = 5t - 5\)
- E. \(d = 6.25t – 81.25\)
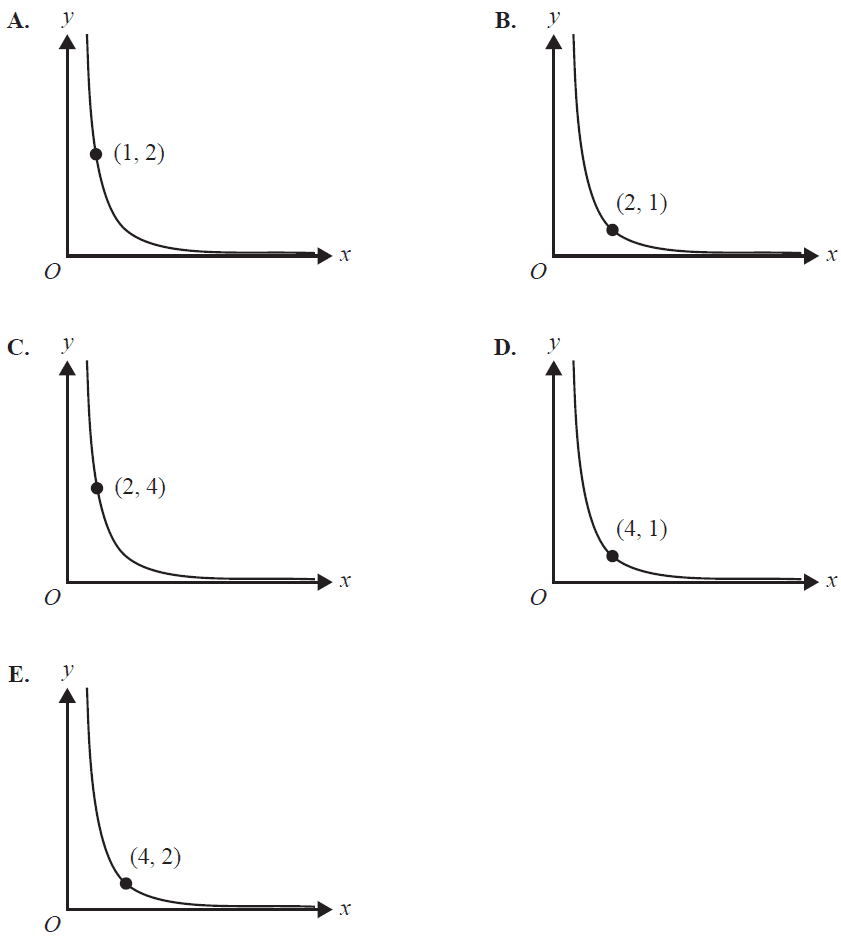
The graph below shows a relationship between \(y\) and \(\frac{1}{x^2}\).
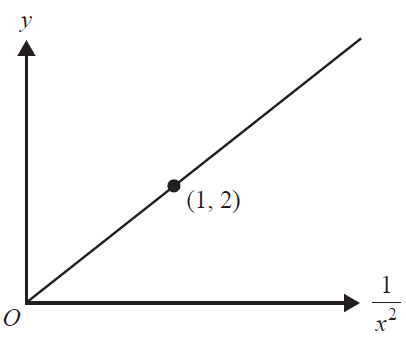
The graph that shows the same relationship between \(y\) and \(x\) is
Amy makes and sells quilts.
The fixed cost to produce the quilts is $800.
Each quilt costs an additional $35 to make.
Amy made and sold a batch of 80 quilts for a profit of $1200.
The selling price of each quilt was
- A. $15.00
- B. $22.50
- C. $30.00
- D. $45.00
- E. $60.00
In the diagram below, the shaded region (with boundaries included) represents the feasible region for a linear programming problem.
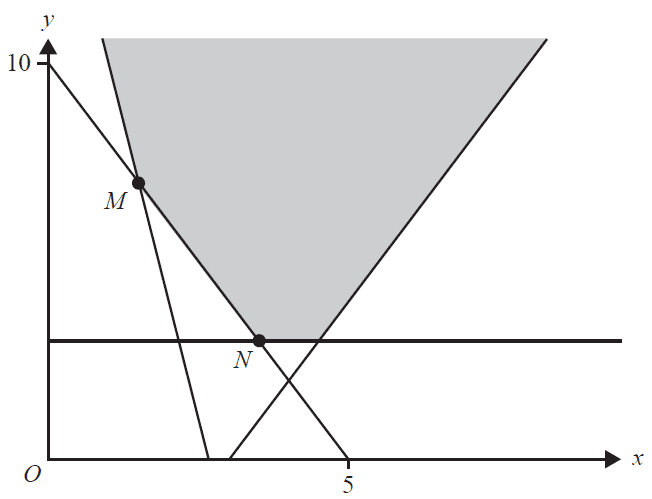
The objective function, \(Z\), has minimum values at both point \(M\) and point \(N\).
Which one of the following could be the objective function?
- A. \(Z = x - 2y\)
- B. \(Z = x + 2y\)
- C. \(Z = 2x + y\)
- D. \(Z = -2x + y\)
- E. \(Z = 2x + 2y\)
A ride-share company has a fee that includes a fixed cost and a cost that depends on both the time spent travelling, in minutes, and the distance travelled, in kilometres.
The fixed cost of a ride is $2.55
Judy’s ride cost $16.75 and took eight minutes. The distance travelled was 10 km.
Pat’s ride cost $30.35 and took 20 minutes. The distance travelled was 18 km.
Roy’s ride took 10 minutes. The distance travelled was 15 km.
The cost of Roy’s ride was
- A. $17.00
- B. $19.55
- C. $20.50
- D. $23.05
- E. $25.60
End of Multiple-Choice Question Book
VCE is a registered trademark of the VCAA. The VCAA does not endorse or make any warranties regarding this study resource. Past VCE exams and related content can be accessed directly at www.vcaa.vic.edu.au
