2017 VCE Further Maths Exam 2
This is the full VCE Further Maths Exam with worked solutions. You can also try Mini-Tests, which are official VCAA exams split into short tests you can do anytime.
Number of marks: 60
Reading time: 15 minutes
Writing time: 1.5 hours
Instructions
• Answer all questions in pencil on your Multiple-Choice Answer Sheet.
• Choose the response that is correct for the question.
• A correct answer scores 1; an incorrect answer scores 0.
• Marks will not be deducted for incorrect answers.
• No marks will be given if more than one answer is completed for any question.
• Unless otherwise indicated, the diagrams in this book are not drawn to scale.
SECTION A – Core
Data analysis
The number of eggs counted in a sample of 12 clusters of moth eggs is recorded in the table below.
| Number of eggs | 172 | 192 | 159 | 125 | 197 | 135 | 140 | 140 | 138 | 166 | 136 | 131 |
a. From the information given, determine
i. the range 1 mark
ii. the percentage of clusters in this sample that contain more than 170 eggs. 1 mark
In a large population of moths, the number of eggs per cluster is approximately normally distributed with a mean of 165 eggs and a standard deviation of 25 eggs.
b. Using the 68–95–99.7% rule, determine
i. the percentage of clusters expected to contain more than 140 eggs 1 mark
ii. the number of clusters expected to have less than 215 eggs in a sample of 1000 clusters. 1 mark
c. The standardised number of eggs in one cluster is given by \(z = -2.4\)
Determine the actual number of eggs in this cluster. 1 mark
The back-to-back stem plot below displays the wingspan, in millimetres, of 32 moths and their place of capture (forest or grassland).
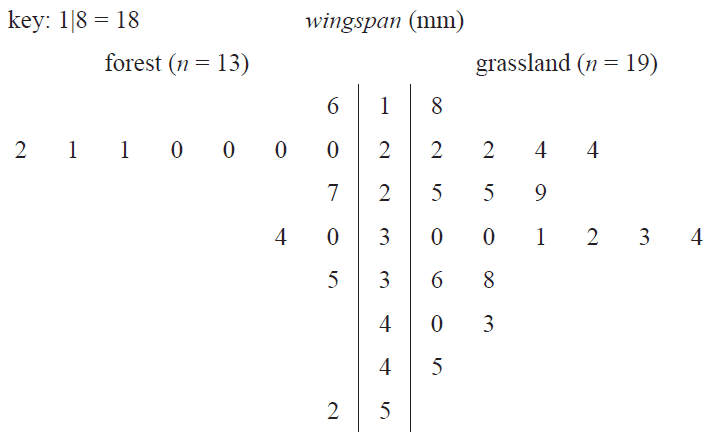
a. Which variable, wingspan or place of capture, is a categorical variable? 1 mark
b. Write down the modal wingspan, in millimetres, of the moths captured in the forest. 1 mark
c. Use the information in the back-to-back stem plot to complete the table below. 2 marks
| Place of capture | Wingspan (mm) | ||||
|---|---|---|---|---|---|
| minimum | \(Q_1\) | median (M) | \(Q_3\) | maximum | |
| forest | 20 | 21 | 32 | 52 | |
| grassland | 18 | 24 | 30 | 45 | |
d. Show that the moth captured in the forest that had a wingspan of 52 mm is an outlier. 2 marks
e. The back-to-back stem plot suggests that wingspan is associated with place of capture.
Explain why, quoting the values of an appropriate statistic. 2 marks
The number of male moths caught in a trap set in a forest and the egg density (eggs per square metre) in the forest are shown in the table below.
| Number of male moths | 35 | 37 | 45 | 49 | 65 | 74 | 77 | 86 | 95 |
| Egg density (eggs per square metre) |
471 | 635 | 664 | 997 | 1350 | 1100 | 2010 | 1640 | 1350 |
a. Determine the equation of the least squares line that can be used to predict the egg density in the forest from the number of male moths caught in the trap.
Write the values of the intercept and slope of this least squares line in the appropriate boxes provided below.
Round your answers to one decimal place. 2 marks
egg density = + × number of male moths
b. The number of female moths caught in a trap set in a forest and the egg density (eggs per square metre) in the forest can also be examined.
A scatterplot of the data is shown below.
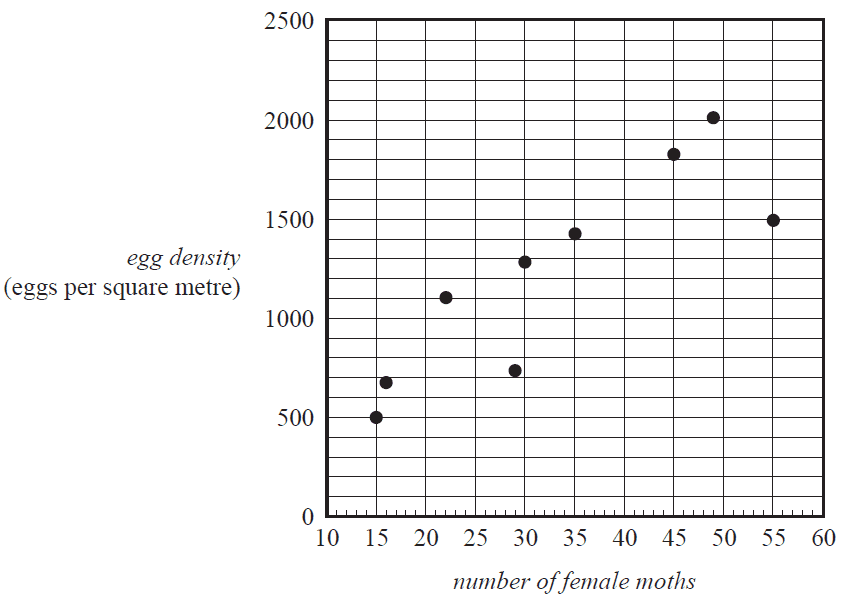
The equation of the least squares line is
egg density = 191 + 31.3 × number of female moths
i. Draw the graph of this least squares line on the scatterplot on page 6. 1 mark
(Answer on the scatterplot on page 6.)
ii. Interpret the slope of the regression line in terms of the variables egg density and number of female moths caught in the trap. 1 mark
iii. The egg density is 1500 when the number of female moths caught is 55.
Determine the residual value if the least squares line is used to predict the egg density for this number of female moths. 1 mark
iv. The correlation coefficient is \(r = 0.862\)
Determine the percentage of the variation in egg density in the forest explained by the variation in the number of female moths caught in the trap.
Round your answer to one decimal place. 1 mark
The eggs laid by the female moths hatch and become caterpillars.
The following time series plot shows the total area, in hectares, of forest eaten by the caterpillars in a rural area during the period 1900 to 1980. The data used to generate this plot is also given.
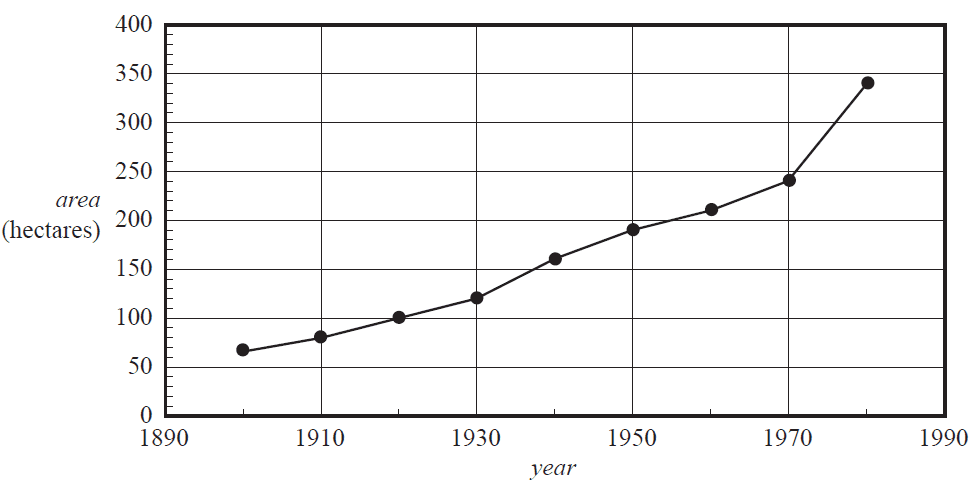
| Year | 1900 | 1910 | 1920 | 1930 | 1940 | 1950 | 1960 | 1970 | 1980 |
| Area (hectares) |
66 | 80 | 100 | 120 | 160 | 190 | 210 | 240 | 340 |
The association between area of forest eaten by the caterpillars and year is non-linear.
A log10 transformation can be applied to the variable area to linearise the data.
a. When the equation of the least squares line that can be used to predict log10(area) from year is determined, the slope of this line is approximately 0.0085385
Round this value to three significant figures. 1 mark
b. Perform the log10 transformation to the variable area and determine the equation of the least squares line that can be used to predict log10(area) from year.
Write the values of the intercept and slope of this least squares line in the appropriate boxes provided below.
Round your answers to three significant figures. 2 marks
log10(area) = + × year
c. i. The least squares line predicts that the log10(area) of forest eaten by the caterpillars by the year 2020 will be approximately 2.85
Using this value of 2.85, calculate the expected area of forest that will be eaten by the caterpillars by the year 2020.
Round your answer to the nearest hectare. 1 mark
ii. Give a reason why this prediction may have limited reliability. 1 mark
Recursion and financial modelling
Alex is a mobile mechanic.
He uses a van to travel to his customers to repair their cars.
The value of Alex's van is depreciated using the flat rate method of depreciation.
The value of the van, in dollars, after \(n\) years, \(V_n\), can be modelled by the recurrence relation shown below.
\(V_0 = 75\,000, \quad V_{n+1} = V_n - 3375\)
a. Recursion can be used to calculate the value of the van after two years.
Complete the calculations below by writing the appropriate numbers in the boxes provided. 2 marks
\(V_0 = 75\,000\)
\(V_1 = 75\,000 - \) \( = 71\,625\)
\(V_2 = \) \( - \) \( = \)
b. i. By how many dollars is the value of the van depreciated each year? 1 mark
ii. Calculate the annual flat rate of depreciation in the value of the van.
Write your answer as a percentage. 1 mark
c. The value of Alex's van could also be depreciated using the reducing balance method of depreciation.
The value of the van, in dollars, after \(n\) years, \(R_n\), can be modelled by the recurrence relation shown below.
\(R_0 = 75\,000, \quad R_{n+1} = 0.943 R_n\)
At what annual percentage rate is the value of the van depreciated each year? 1 mark
Alex sends a bill to his customers after repairs are completed.
If a customer does not pay the bill by the due date, interest is charged.
Alex charges interest after the due date at the rate of 1.5% per month on the amount of an unpaid bill.
The interest on this amount will compound monthly.
a. Alex sent Marcus a bill of $200 for repairs to his car.
Marcus paid the full amount one month after the due date.
How much did Marcus pay? 1 mark
Alex sent Lily a bill of $428 for repairs to her car.
Lily did not pay the bill by the due date.
Let \(A_n\) be the amount of this bill \(n\) months after the due date.
b. Write down a recurrence relation, in terms of \(A_0\), \(A_{n+1}\) and \(A_n\), that models the amount of the bill. 2 marks
c. Lily paid the full amount of her bill four months after the due date.
How much interest was Lily charged?
Round your answer to the nearest cent. 1 mark
Alex sold his mechanics' business for $360 000 and invested this amount in a perpetuity.
The perpetuity earns interest at the rate of 5.2% per annum.
Interest is calculated and paid monthly.
a. What monthly payment will Alex receive from this investment? 1 mark
b. Later, Alex converts the perpetuity to an annuity investment.
This annuity investment earns interest at the rate of 3.8% per annum, compounding monthly.
For the first four years Alex makes a further payment each month of $500 to his investment.
This monthly payment is made immediately after the interest is added.
After four years of these regular monthly payments, Alex increases the monthly payment.
This new monthly payment gives Alex a balance of $500 000 in his annuity after a further two years.
What is the value of Alex's new monthly payment?
Round your answer to the nearest cent. 2 marks
SECTION B – Modules
Module 1 – Matrices
A school canteen sells pies (P), rolls (R) and sandwiches (S).
The number of each item sold over three school weeks is shown in matrix \(M\).
\[ M = \begin{array}{c} \begin{array}{ccc} \text{P} & \text{R} & \text{S} \end{array} \\ \begin{bmatrix} 35 & 24 & 60 \\ 28 & 32 & 43 \\ 32 & 30 & 56 \end{bmatrix} \end{array} \begin{array}{l} \text{week 1} \\ \text{week 2} \\ \text{week 3} \end{array} \]a. In total, how many sandwiches were sold in these three weeks? 1 mark
The element in row \(i\) and column \(j\) of matrix \(M\) is \(m_{ij}\).
b. What does the element \(m_{12}\) indicate? 1 mark
c. Consider the matrix equation
\[ \begin{bmatrix} 35 & 24 & 60 \\ 28 & 32 & 43 \\ 32 & 30 & 56 \end{bmatrix} \times \begin{bmatrix} a \\ b \\ c \end{bmatrix} = \begin{bmatrix} 491.55 \\ 428.00 \\ 487.60 \end{bmatrix} \]where \(a\) = cost of one pie, \(b\) = cost of one roll and \(c\) = cost of one sandwich.
i. What is the cost of one sandwich? 1 mark
ii. The matrix equation below shows that the total value of all rolls and sandwiches sold in these three weeks is $915.60
\[ L \times \begin{bmatrix} 491.55 \\ 428.00 \\ 487.60 \end{bmatrix} = [915.60] \]Matrix \(L\) in this equation is of order \(1 \times 3\).
Write down matrix \(L\). 1 mark
]
Junior students at this school must choose one elective activity in each of the four terms in 2018.
Students can choose from the areas of performance (P), sport (S) and technology (T).
The transition diagram below shows the way in which junior students are expected to change their choice of elective activity from term to term.
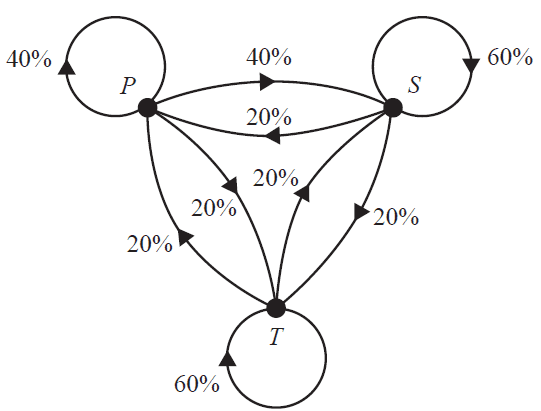
a. Of the junior students who choose performance (P) in one term, what percentage are expected to choose sport (S) the next term? 1 mark
Matrix \(J_1\) lists the number of junior students who will be in each elective activity in Term 1.
\[ J_1 = \begin{bmatrix} 300 \\ 240 \\ 210 \end{bmatrix} \begin{array}{c} \text{P} \\ \text{S} \\ \text{T} \end{array} \]b. 306 junior students are expected to choose sport (S) in Term 2.
Complete the calculation below to show this. 1 mark
\(300 \times \) \( + 240 \times \) \( + 210 \times \) \( = 306\)
c. In Term 4, how many junior students in total are expected to participate in performance (P) or sport (S) or technology (T)? 1 mark
Senior students at this school will also choose one elective activity in each of the four terms in 2018.
Their choices are communication (C), investigation (I), problem-solving (P) and service (S).
The transition matrix \(T\) shows the way in which senior students are expected to change their choice of elective activity from term to term.
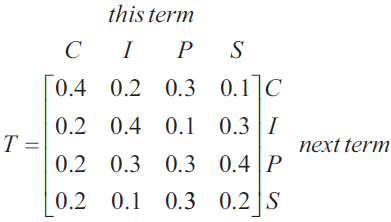
Let \(S_n\) be the state matrix for the number of senior students expected to choose each elective activity in Term \(n\).
For the given matrix \(S_1\), a matrix rule that can be used to predict the number of senior students in each elective activity in Terms 2, 3 and 4 is
\[ S_1 = \begin{bmatrix} 300 \\ 200 \\ 200 \\ 300 \end{bmatrix}, \quad S_{n+1} = TS_n \]a. How many senior students will not change their elective activity from Term 1 to Term 2? 1 mark
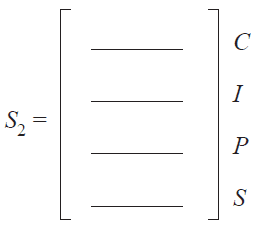
b. Complete \(S_2\), the state matrix for Term 2, below. 1 mark
c. Of the senior students expected to choose investigation (I) in Term 3, what percentage chose service (S) in Term 2? 2 marks
d. What is the maximum number of senior students expected in investigation (I) at any time during 2018? 1 mark
Module 2 – Networks and decision mathematics
Bus routes connect six towns.
The towns are Northend (N), Opera (O), Palmer (P), Quigley (Q), Rosebush (R) and Seatown (S).
The graph below gives the cost, in dollars, of bus travel along these routes.
Bai lives in Northend (N) and he will travel by bus to take a holiday in Seatown (S).
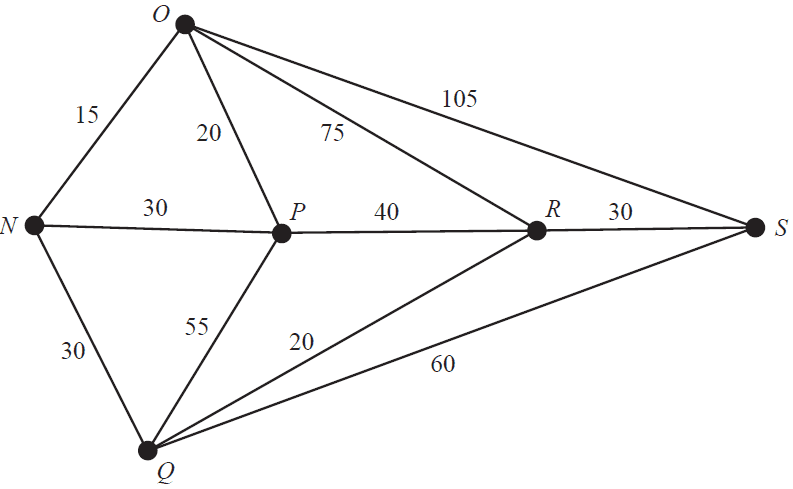
a. Bai considers travelling by bus along the route Northend (N) – Opera (O) – Seatown (S).
How much would Bai have to pay? 1 mark
b. If Bai takes the cheapest route from Northend (N) to Seatown (S), which other town(s) will he pass through? 1 mark
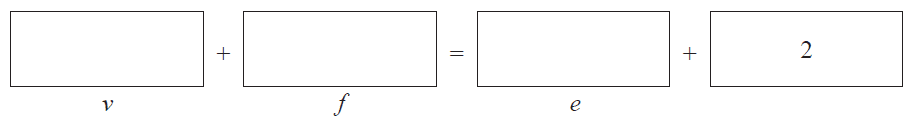
c. Euler's formula, \(v + f = e + 2\), holds for this graph.
Complete the formula by writing the appropriate numbers in the boxes provided below. 1 mark
Bai joins his friends Agatha, Colin and Diane when he arrives for the holiday in Seatown.
Each person will plan one tour that the group will take.
Table 1 shows the time, in minutes, it would take each person to plan each of the four tours.
Table 1
| Agatha | Bai | Colin | Diane | |
|---|---|---|---|---|
| Tour 1 | 13 | 7 | 13 | 12 |
| Tour 2 | 14 | 9 | 8 | 7 |
| Tour 3 | 19 | 25 | 21 | 18 |
| Tour 4 | 10 | 7 | 11 | 10 |
The aim is to minimise the total time it takes to plan the four tours.
Agatha applies the Hungarian algorithm to Table 1 to produce Table 2.
Table 2 shows the final result of all her steps of the Hungarian algorithm.
Table 2
| Agatha | Bai | Colin | Diane | |
|---|---|---|---|---|
| Tour 1 | 3 | 0 | 3 | 3 |
| Tour 2 | 6 | 4 | 0 | 0 |
| Tour 3 | 0 | 9 | 2 | 0 |
| Tour 4 | 0 | 0 | 1 | 1 |
a. In Table 2 there is a zero in the column for Colin.
When all values in the table are considered, what conclusion about minimum total planning time can be made from this zero? 1 mark
b. Determine the minimum total planning time, in minutes, for all four tours. 1 mark
While on holiday, the four friends visit a theme park where there are nine rides.
On the graph below, the positions of the rides are indicated by the vertices.
The numbers on the edges represent the distances, in metres, between rides.
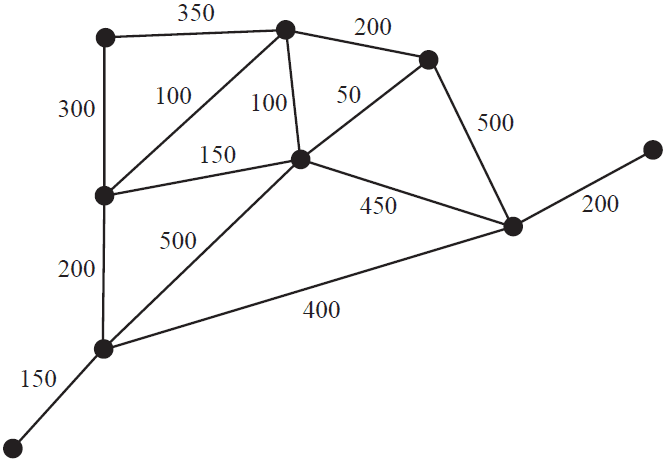
a. Electrical cables are required to power the rides.
These cables will form a connected graph.
The shortest total length of cable will be used.
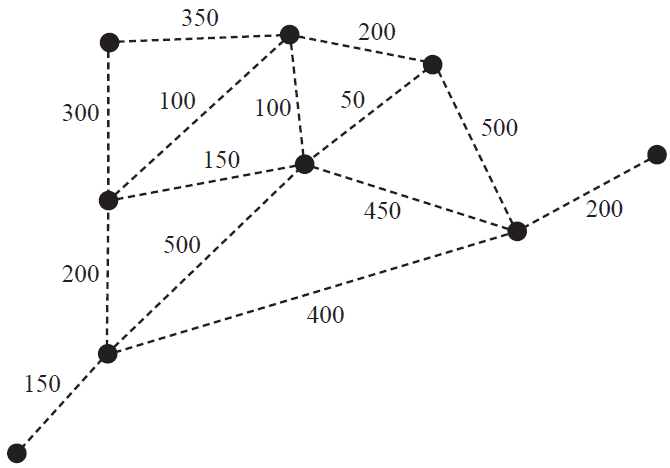
i. Give a mathematical term to describe a graph that represents these cables. 1 mark
ii. Draw in the graph that represents these cables on the diagram below. 1 mark
The rides at the theme park are set up at the beginning of each holiday season.
This project involves activities A to O.
The directed network below shows these activities and their completion times in days.
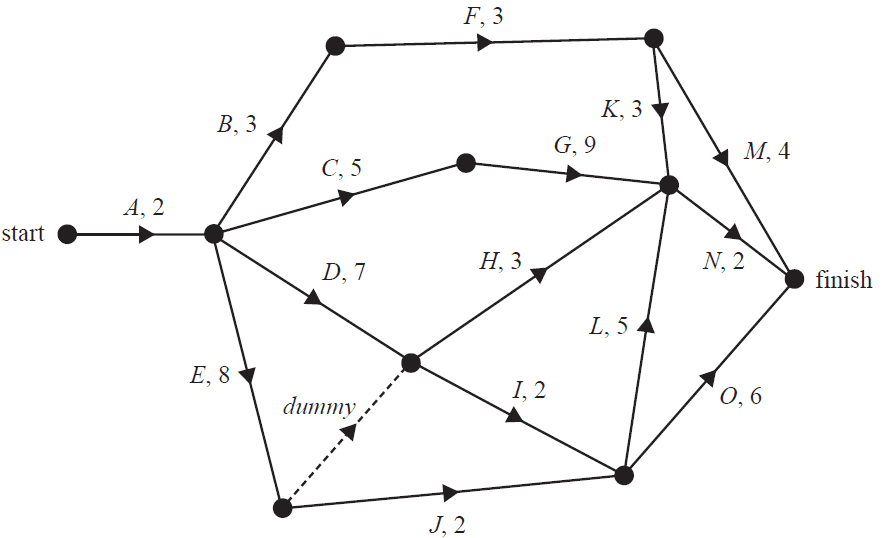
a. Write down the two immediate predecessors of activity I. 1 mark
b. The minimum completion time for the project is 19 days.
i. There are two critical paths. One of the critical paths is A–E–J–L–N.
Write down the other critical path. 1 mark
ii. Determine the float time, in days, for activity F. 1 mark
c. The project could finish earlier if some activities were crashed.
Six activities, B, D, G, I, J and L, can all be reduced by one day.
The cost of this crashing is $1000 per activity.
i. What is the minimum number of days in which the project could now be completed? 1 mark
ii. What is the minimum cost of completing the project in this time? 1 mark
Module 3 – Geometry and measurement
Miki is planning a gap year in Japan.
She will store some of her belongings in a small storage box while she is away.
This small storage box is in the shape of a rectangular prism.
The diagram below shows that the dimensions of the small storage box are 40 cm × 19 cm × 32 cm.
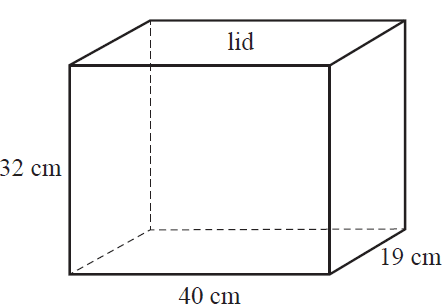
The lid of the small storage box is labelled on the diagram above.
a. i. What is the surface area of the lid, in square centimetres? 1 mark
ii. What is the total outside surface area of this storage box, including the lid and base, in square centimetres? 1 mark
b. Miki has a large storage box that is also a rectangular prism.
The large storage box and the small storage box are similar in shape.
The volume of the large storage box is eight times the volume of the small storage box.
The length of the small storage box is 40 cm.
What is the length of the large storage box, in centimetres? 1 mark
Miki will travel from Melbourne (38° S, 145° E) to Tokyo (36° N, 140° E) on Wednesday, 20 December.
The flight will leave Melbourne at 11.20 am, and will take 10 hours and 40 minutes to reach Tokyo.
The time difference between Melbourne and Tokyo is two hours at that time of year.
a. On what day and at what time will Miki arrive in Tokyo? 1 mark
Miki will travel by train from Tokyo to Nemuro and she will stay in a hostel when she arrives.
The hostel is located 186 m north and 50 m west of the Nemuro railway station.
b. i. What distance will Miki have to walk if she were to walk in a straight line from the Nemuro railway station to the hostel?
Round your answer to the nearest metre. 1 mark
ii. What is the three-figure bearing of the hostel from the Nemuro railway station?
Round your answer to the nearest degree. 1 mark
The city of Nemuro is located 43° N, 145° E.
Assume that the radius of Earth is 6400 km.
c. The small circle of Earth at latitude 43° N is shown in the diagram below.
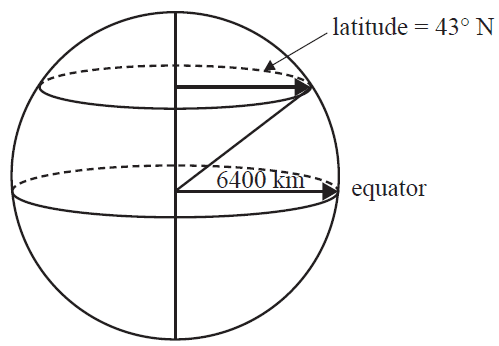
What is the radius of the small circle of Earth at latitude 43° N?
Round your answer to the nearest kilometre. 1 mark
d. Find the shortest great circle distance between Melbourne (38° S, 145° E) and Nemuro (43° N, 145° E).
Round your answer to the nearest kilometre. 1 mark
The hostel buildings are arranged around a grassed area.
The grassed area is shown shaded in the diagram below.
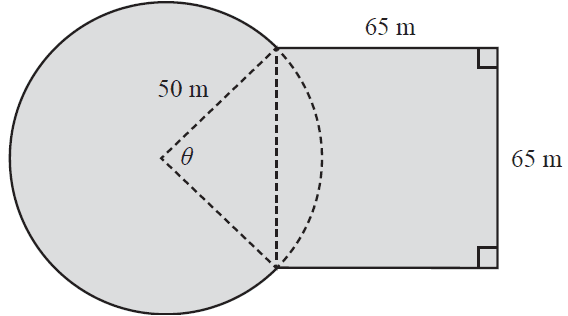
The grassed area is made up of a square overlapping a circle.
The square has side lengths of 65 m.
The circle has a radius of 50 m.
An angle, \(\theta\), is also shown on the diagram.
a. Use the cosine rule to show that the angle \(\theta\), correct to the nearest degree, is equal to 81°. 1 mark
b. What is the perimeter, in metres, of the entire grassed area?
Round your answer to the nearest metre. 1 mark
c. The hostel's management is planning to build a pathway from point A to point B, as shown on the diagram below.
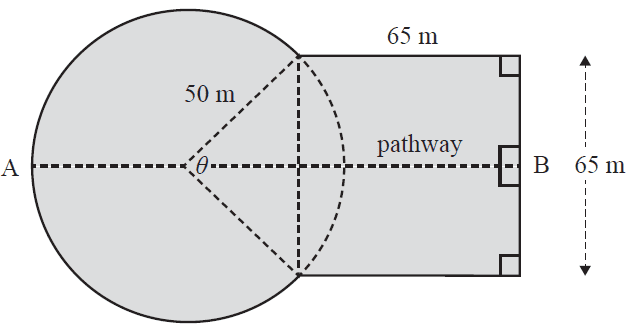
Calculate the length, in metres, of the planned pathway.
Round your answer to the nearest metre. 2 marks
Module 4 – Graphs and relations
The graph below shows the depth of water in a sea bath from 6.00 am to 8.00 pm.
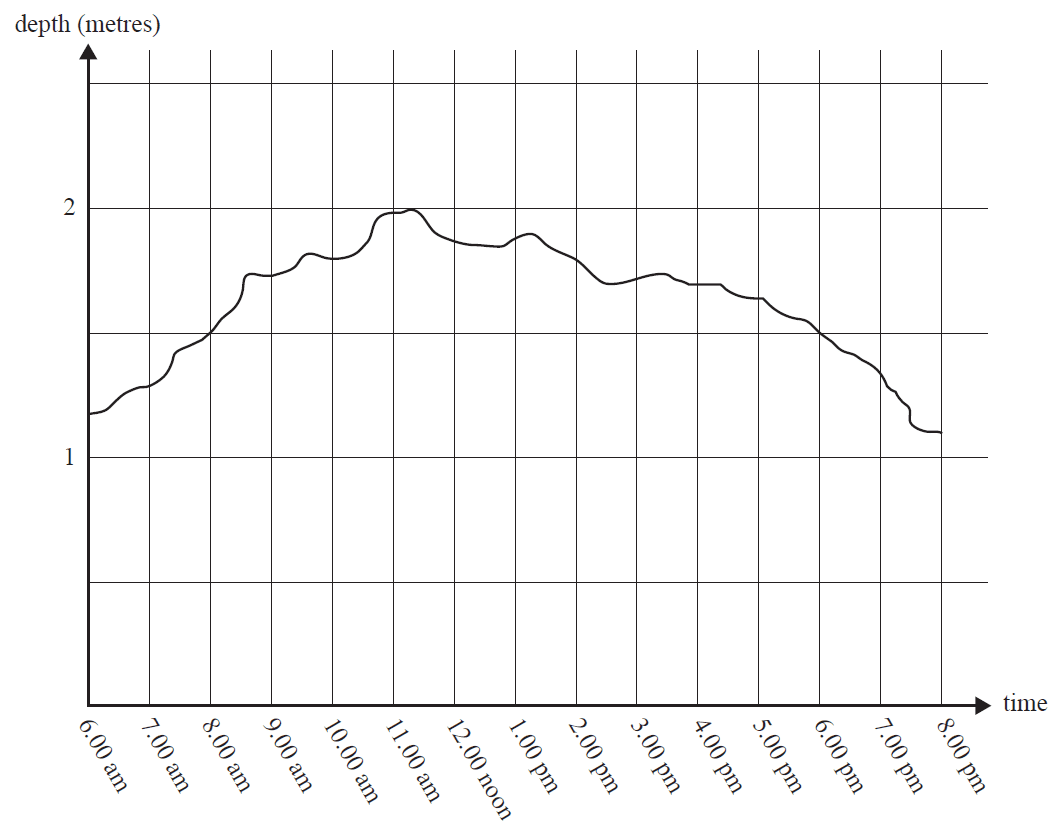
a. What was the maximum depth, in metres, of water in the sea bath? 1 mark
b. The sea bath was open to the public when the depth of water was above 1.5 m.
Between which times was the sea bath open? 1 mark
A swimming race is being held in the ocean next to the sea bath.
From the shore, competitors swim 500 m out to a buoy in the ocean and then return to the shore.
One competitor, Edgar, reaches the buoy after 12.5 minutes and completes the race in 25 minutes.
The graph below shows his distance from shore, in metres, \(t\) minutes after the race begins.
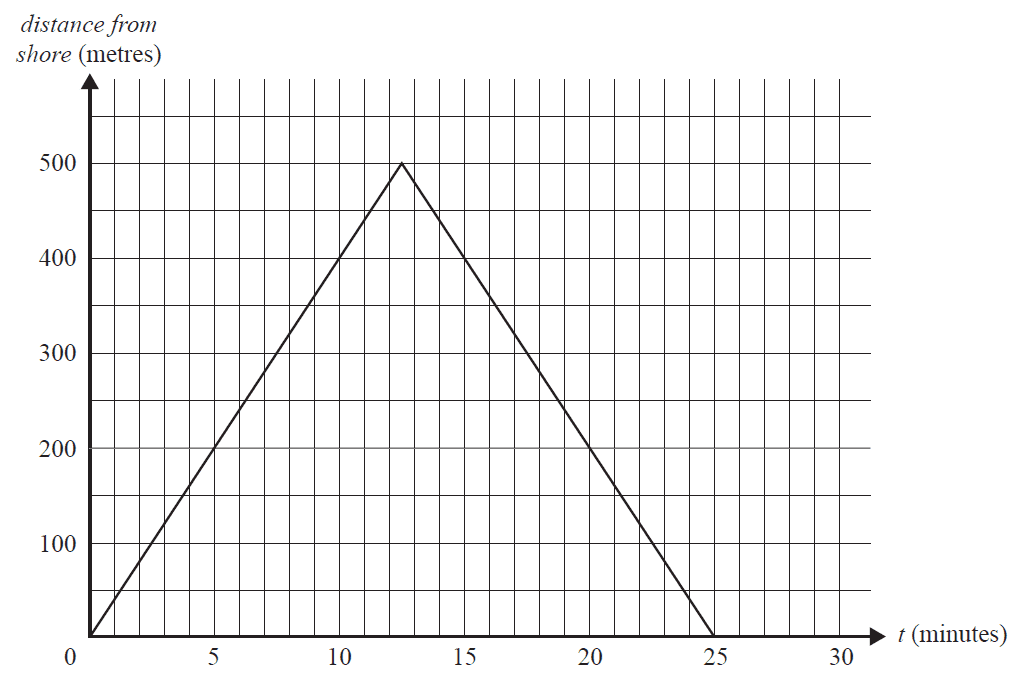
a. What distance, in metres, has Edgar swum after 15 minutes? 1 mark
b. Let \(E\) be Edgar's distance from the shore, in metres, \(t\) minutes after the race begins.
The linear relation that represents his swim out to the buoy is of the form
\(E = kt\), where \(0 < t \le 12.5\)
The slope of the line \(k\) is the speed at which Edgar is swimming, in metres per minute.
Show that \(k = 40\). 1 mark
A second competitor, Zlatko, began the race at the same time as Edgar.
Below is the relation that describes Zlatko's swim, where \(Z\) is his distance from the shore, in metres, \(t\) minutes after the race begins and \(F\) is the time it took Zlatko to finish the race.
\[ Z = \begin{cases} 50t & 0 < t \le 10 \\ -62.5t + 1125 & 10 < t \le F \end{cases} \]c. The graph below again shows the relation representing Edgar’s swim.
Sketch the relation representing Zlatko's swim on the graph below. 2 marks
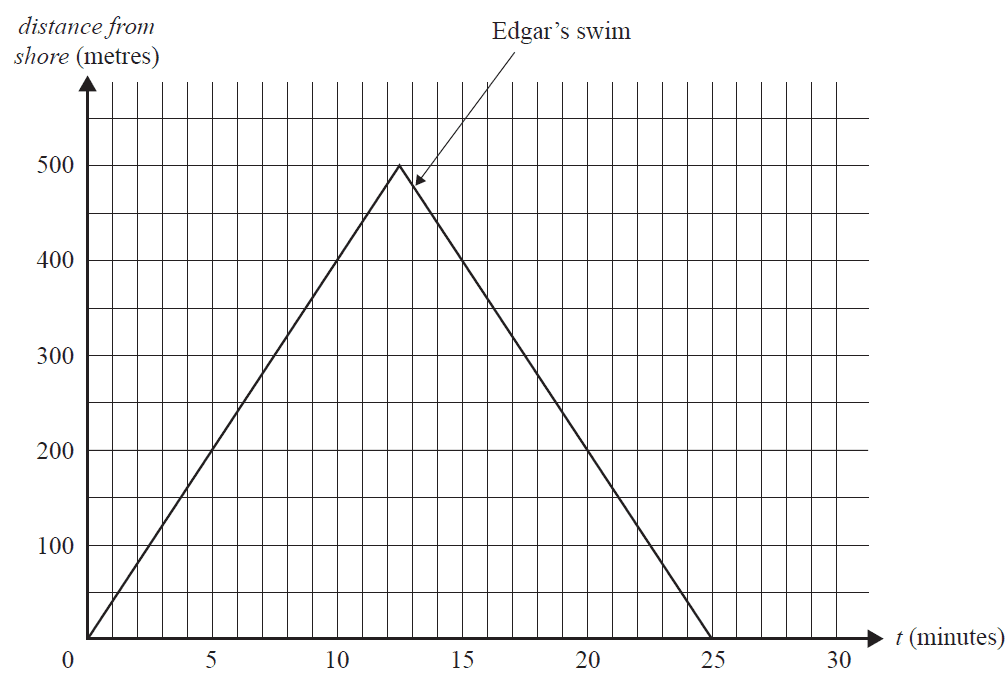
d. How many minutes after the start of the race were Zlatko and Edgar the same distance from the shore?
Round your answer to two decimal places. 1 mark
Lifeguards are required to ensure the safety of swimmers at the sea bath and beach.
Let \(x\) be the number of junior lifeguards required.
Let \(y\) be the number of senior lifeguards required.
The inequality below represents the constraint on the relationship between the number of senior lifeguards required and the number of junior lifeguards required.
Constraint 1 \(y \ge \frac{x}{4}\)
a. If eight junior lifeguards are required, what is the minimum number of senior lifeguards required? 1 mark
There are three other constraints.
Constraint 2 \(x \ge 6\)
Constraint 3 \(y \ge 4\)
Constraint 4 \(x + y \ge 12\)
b. Interpret Constraint 4 in terms of the number of junior lifeguards and senior lifeguards required. 1 mark
The shaded region of the graph below contains the points that satisfy Constraints 1 to 4.
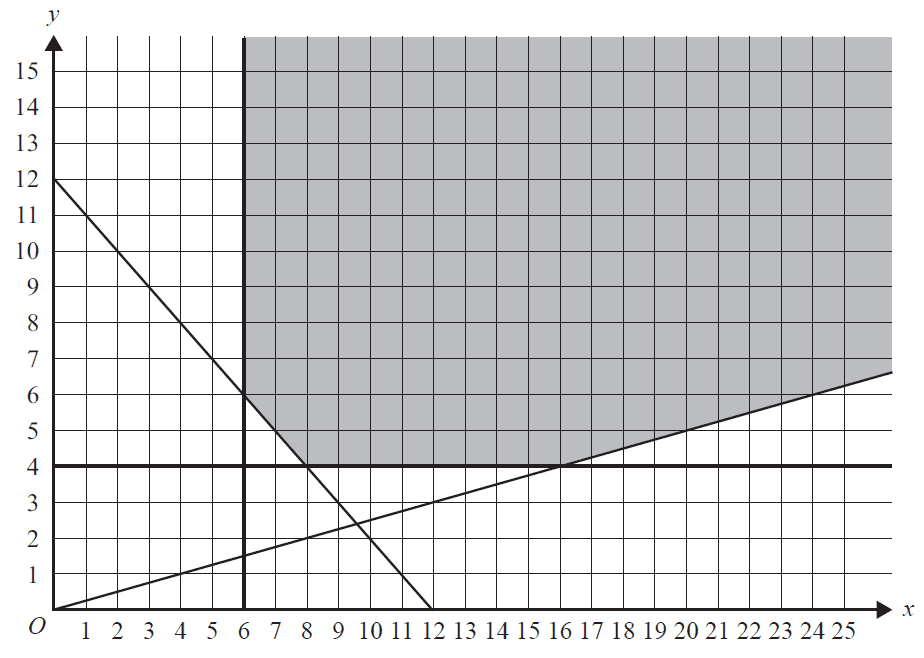
All lifeguards receive a meal allowance per day.
Junior lifeguards receive $15 per day and senior lifeguards receive $25 per day.
The total meal allowance cost per day, \($C\), for the lifeguards is given by
\(C = 15x + 25y\)
c. Determine the minimum total meal allowance cost per day for the lifeguards. 2 marks
d. On rainy days there will be no set minimum number of junior lifeguards or senior lifeguards required, therefore:
- Constraint 2 (\(x \ge 6\)) and Constraint 3 (\(y \ge 4\)) are removed
- Constraint 1 and Constraint 4 are to remain.
Constraint 1 \(y \ge \frac{x}{4}\)
Constraint 4 \(x + y \ge 12\)
The total meal allowance cost per day, \($C\), for the lifeguards remains as
\(C = 15x + 25y\)
How many junior lifeguards and senior lifeguards work on a rainy day if the total meal allowance cost is to be a minimum?
Write your answers in the boxes provided below. 1 mark
| Junior lifeguards | Senior lifeguards |
End of Multiple-Choice Question Book
VCE is a registered trademark of the VCAA. The VCAA does not endorse or make any warranties regarding this study resource. Past VCE exams and related content can be accessed directly at www.vcaa.vic.edu.au
