2017 VCE Further Maths Exam 1
This is the full VCE Further Maths Exam with worked solutions. You can also try Mini-Tests, which are official VCAA exams split into short tests you can do anytime.
Number of marks: 40
Reading time: 15 minutes
Writing time: 1.5 hours
Instructions
• Answer all questions in pencil on your Multiple-Choice Answer Sheet.
• Choose the response that is correct for the question.
• A correct answer scores 1; an incorrect answer scores 0.
• Marks will not be deducted for incorrect answers.
• No marks will be given if more than one answer is completed for any question.
• Unless otherwise indicated, the diagrams in this book are not drawn to scale.
Data analysis
Use the following information to answer Questions 1–3.
The boxplot below shows the distribution of the forearm circumference, in centimetres, of 252 people.
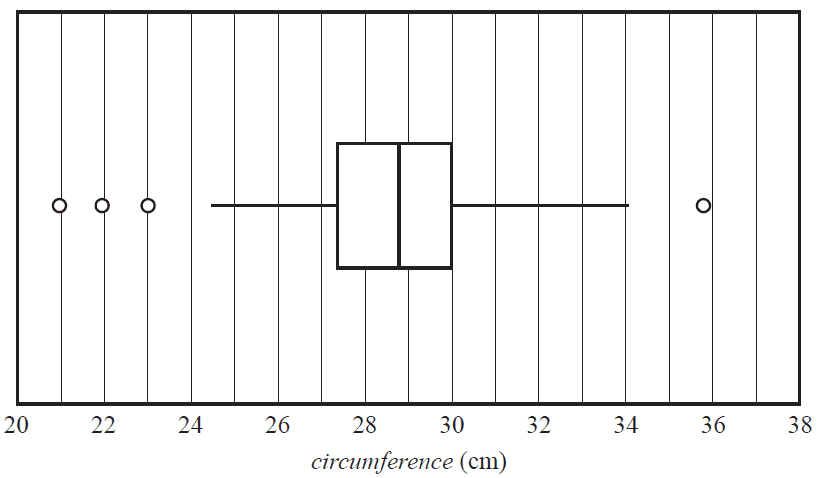
The percentage of these 252 people with a forearm circumference of less than 30 cm is closest to
- A. 15%
- B. 25%
- C. 50%
- D. 75%
- E. 100%
The five-number summary for the forearm circumference of these 252 people is closest to
- A. 21, 27.4, 28.7, 30, 34
- B. 21, 27.4, 28.7, 30, 35.9
- C. 24.5, 27.4, 28.7, 30, 34
- D. 24.5, 27.4, 28.7, 30, 35.9
- E. 24.5, 27.4, 28.7, 30, 36
The table below shows the forearm circumference, in centimetres, of a sample of 10 people selected from this group of 252 people.
| Circumference | 26.0 | 27.8 | 28.4 | 25.9 | 28.3 | 31.5 | 28.2 | 25.9 | 27.9 | 27.8 |
The mean, \(\bar{x}\), and the standard deviation, \(s_x\), of the forearm circumference for this sample of people are closest to
- A. \(\bar{x} = 1.58 \quad s_x = 27.8\)
- B. \(\bar{x} = 1.66 \quad s_x = 27.8\)
- C. \(\bar{x} = 27.8 \quad s_x = 1.58\)
- D. \(\bar{x} = 27.8 \quad s_x = 1.66\)
- E. \(\bar{x} = 27.8 \quad s_x = 2.30\)
The histogram below shows the distribution of the log10(area), with area in square kilometres, of 17 islands.
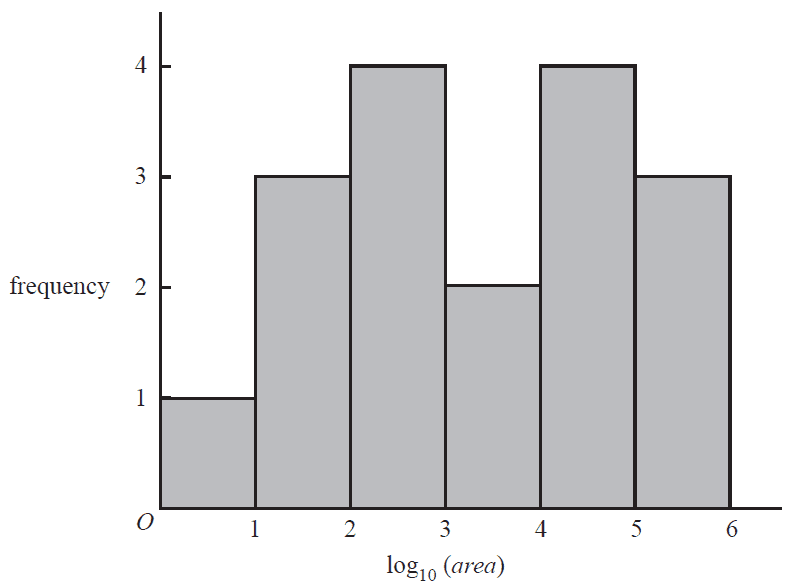
The median area of these islands, in square kilometres, is between
- A. 2 and 3
- B. 3 and 4
- C. 10 and 100
- D. 1000 and 10 000
- E. 10 000 and 100 000
Use the following information to answer Questions 5–7.
A study was conducted to investigate the association between the number of moths caught in a moth trap (less than 250, 250–500, more than 500) and the trap type (sugar, scent, light). The results are summarised in the percentaged segmented bar chart below.
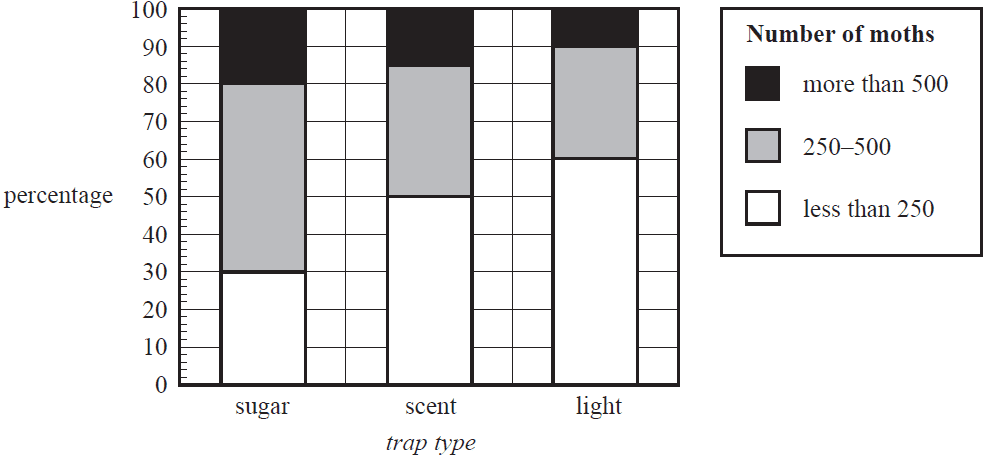
There were 300 sugar traps.
The number of sugar traps that caught less than 250 moths is closest to
- A. 30
- B. 90
- C. 250
- D. 300
- E. 500
The data displayed in the percentaged segmented bar chart supports the contention that there is an association between the number of moths caught in a moth trap and the trap type because
- A. most of the light traps contained less than 250 moths.
- B. 15% of the scent traps contained 500 or more moths.
- C. the percentage of sugar traps containing more than 500 moths is greater than the percentage of scent traps containing less than 500 moths.
- D. 20% of sugar traps contained more than 500 moths while 50% of light traps contained less than 250 moths.
- E. 20% of sugar traps contained more than 500 moths while 10% of light traps contained more than 500 moths.
The variables number of moths (less than 250, 250–500, more than 500) and trap type (sugar, scent, light) are
- A. both nominal variables.
- B. both ordinal variables.
- C. a numerical variable and a categorical variable respectively.
- D. a nominal variable and an ordinal variable respectively.
- E. an ordinal variable and a nominal variable respectively.
Use the following information to answer Questions 8–10.
The scatterplot below shows the wrist circumference and ankle circumference, both in centimetres, of 13 people. A least squares line has been fitted to the scatterplot with ankle circumference as the explanatory variable.
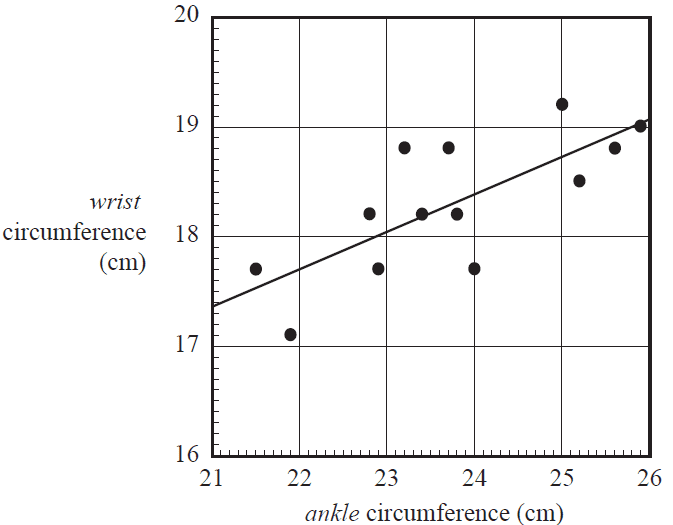
The equation of the least squares line is closest to
- A. ankle = 10.2 + 0.342 × wrist
- B. wrist = 10.2 + 0.342 × ankle
- C. ankle = 17.4 + 0.342 × wrist
- D. wrist = 17.4 + 0.342 × ankle
- E. wrist = 17.4 + 0.731 × ankle
When the least squares line on the scatterplot is used to predict the wrist circumference of the person with an ankle circumference of 24 cm, the residual will be closest to
- A. –0.7
- B. –0.4
- C. –0.1
- D. 0.4
- E. 0.7
The residuals for this least squares line have a mean of 0.02 cm and a standard deviation of 0.4 cm. The value of the residual for one of the data points is found to be –0.3 cm. The standardised value of this residual is
- A. –0.8
- B. –0.7
- C. –0.3
- D. 0.7
- E. 0.8
Which one of the following statistics can never be negative?
- A. the maximum value in a data set
- B. the value of a Pearson correlation coefficient
- C. the value of a moving mean in a smoothed time series
- D. the value of a seasonal index
- E. the value of the slope of a least squares line fitted to a scatterplot
Data collected over a period of 10 years indicated a strong, positive association between the number of stray cats and the number of stray dogs reported each year (\(r = 0.87\)) in a large, regional city.
A positive association was also found between the population of the city and both the number of stray cats (\(r = 0.61\)) and the number of stray dogs (\(r = 0.72\)).
During the time that the data was collected, the population of the city grew from 34 564 to 51 055.
From this information, we can conclude that
- A. if cat owners paid more attention to keeping dogs off their property, the number of stray cats reported would decrease.
- B. the association between the number of stray cats and stray dogs reported cannot be causal because only a correlation of +1 or –1 shows causal relationships.
- C. there is no logical explanation for the association between the number of stray cats and stray dogs reported in the city so it must be a chance occurrence.
- D. because larger populations tend to have both a larger number of stray cats and stray dogs, the association between the number of stray cats and the number of stray dogs can be explained by a common response to a third variable, which is the increasing population size of the city.
- E. more stray cats were reported because people are no longer as careful about keeping their cats properly contained on their property as they were in the past.
Use the following information to answer Questions 13–15.
The wind speed at a city location is measured throughout the day. The time series plot below shows the daily maximum wind speed, in kilometres per hour, over a three-week period.
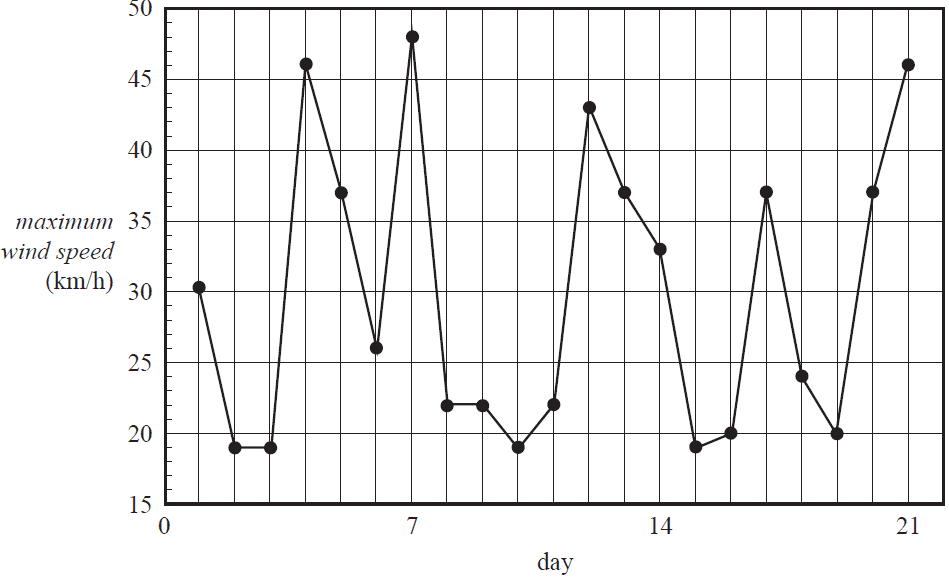
The time series is best described as having
- A. seasonality only.
- B. irregular fluctuations only.
- C. seasonality with irregular fluctuations.
- D. a decreasing trend with irregular fluctuations.
- E. an increasing trend with irregular fluctuations.
The seven-median smoothed maximum wind speed, in kilometres per hour, for day 4 is closest to
- A. 22
- B. 26
- C. 27
- D. 30
- E. 32
The table below shows the daily maximum wind speed, in kilometres per hour, for the days in week 2.
| Day | 8 | 9 | 10 | 11 | 12 | 13 | 14 |
|---|---|---|---|---|---|---|---|
| Maximum wind speed (km/h) | 22 | 22 | 19 | 22 | 43 | 37 | 33 |
A four-point moving mean with centring is used to smooth the time series data above.
The smoothed maximum wind speed, in kilometres per hour, for day 11 is closest to
- A. 22
- B. 24
- C. 26
- D. 28
- E. 30
The seasonal index for the sales of cold drinks in a shop in January is 1.6
To correct the January sales of cold drinks for seasonality, the actual sales should be
- A. reduced by 37.5%
- B. reduced by 40%
- C. reduced by 62.5%
- D. increased by 60%
- E. increased by 62.5%
Recursion and financial modelling
Question 17The value of a reducing balance loan, in dollars, after \(n\) months, \(V_n\), can be modelled by the recurrence relation shown below.
\(V_0 = 26\,000, \quad V_{n+1} = 1.003\,V_n - 400\)
What is the value of this loan after five months?
- A. $24 380.31
- B. $24 706.19
- C. $25 031.10
- D. $25 355.03
- E. $25 678.00
The first five terms of a sequence are 2, 6, 22, 86, 342 ...
The recurrence relation that generates this sequence could be
- A. \(P_0 = 2, \quad P_{n+1} = P_n + 4\)
- B. \(P_0 = 2, \quad P_{n+1} = 2P_n + 2\)
- C. \(P_0 = 2, \quad P_{n+1} = 3P_n\)
- D. \(P_0 = 2, \quad P_{n+1} = 4P_n - 2\)
- E. \(P_0 = 2, \quad P_{n+1} = 5P_n - 4\)
Use the following information to answer Questions 19 and 20.
Shirley would like to purchase a new home. She will establish a loan for $225 000 with interest charged at the rate of 3.6% per annum, compounding monthly.
Each month, Shirley will pay only the interest charged for that month.
After three years, the amount that Shirley will owe is
- A. $73 362
- B. $170 752
- C. $225 000
- D. $239 605
- E. $245 865
Let \(V_n\) be the value of Shirley's loan, in dollars, after \(n\) months.
A recurrence relation that models the value of \(V_n\) is
- A. \(V_0 = 225\,000, \quad V_{n+1} = 1.003\,V_n\)
- B. \(V_0 = 225\,000, \quad V_{n+1} = 1.036\,V_n\)
- C. \(V_0 = 225\,000, \quad V_{n+1} = 1.003\,V_n - 8100\)
- D. \(V_0 = 225\,000, \quad V_{n+1} = 1.003\,V_n - 675\)
- E. \(V_0 = 225\,000, \quad V_{n+1} = 1.036\,V_n - 675\)
A printer was purchased for $680.
After four years the printer has a value of $125.
On average, 1920 pages were printed every year during those four years.
The value of the printer was depreciated using a unit cost method of depreciation.
The depreciation in the value of the printer, per page printed, is closest to
- A. 3 cents.
- B. 4 cents.
- C. 5 cents.
- D. 6 cents.
- E. 7 cents.
Consider the graph below.
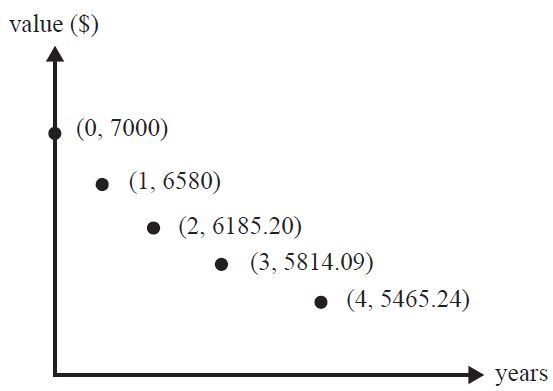
This graph could show the value of
- A. a piano depreciating at a flat rate of 6% per annum.
- B. a car depreciating with a reducing balance rate of 6% per annum.
- C. a compound interest investment earning interest at the rate of 6% per annum.
- D. a perpetuity earning interest at the rate of 6% per annum.
- E. an annuity investment with additional payments of 6% of the initial investment amount per annum.
Four lines of an amortisation table for an annuity investment are shown below.
The interest rate for this investment remains constant, but the payment value may vary.
| Payment number |
Payment | Interest | Principal addition |
Balance of investment |
|---|---|---|---|---|
| 17 | 100.00 | 27.40 | 127.40 | 6977.50 |
| 18 | 100.00 | 27.91 | 127.91 | 7105.41 |
| 19 | 100.00 | 28.42 | 128.42 | 7233.83 |
| 20 | 7500.00 |
The balance of the investment after payment number 20 is $7500.
The value of payment number 20 is closest to
- A. $29
- B. $100
- C. $135
- D. $237
- E. $295
Xavier borrowed $245 000 to pay for a house.
For the first 10 years of the loan, the interest rate was 4.35% per annum, compounding monthly.
Xavier made monthly repayments of $1800.
After 10 years, the interest rate changed.
If Xavier now makes monthly repayments of $2000, he could repay the loan in a further five years.
The new annual interest rate for Xavier’s loan is closest to
- A. 0.35%
- B. 4.1%
- C. 4.5%
- D. 4.8%
- E. 18.7%
Module 1 – Matrices
Question 1Kai has a part-time job.
Each week, he earns money and saves some of this money.
The matrix below shows the amounts earned (\(E\)) and saved (\(S\)), in dollars, in each of three weeks.
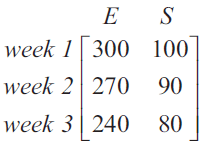
How much did Kai save in week 2?
- A. $80
- B. $90
- C. $100
- D. $170
- E. $270
The matrix below shows how five people, Alan (\(A\)), Bevan (\(B\)), Charlie (\(C\)), Drew (\(D\)) and Esther (\(E\)), can communicate with each other.
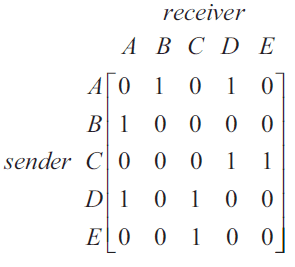
A '1' in the matrix shows that the person named in that row can send a message directly to the person named in that column.
For example, the '1' in row 3 and column 4 shows that Charlie can send a message directly to Drew.
Esther wants to send a message to Bevan.
Which one of the following shows the order of people through which the message is sent?
- A. Esther – Bevan
- B. Esther – Charlie – Bevan
- C. Esther – Charlie – Alan – Bevan
- D. Esther – Charlie – Drew – Bevan
- E. Esther – Charlie – Drew – Alan – Bevan
Which one of the following matrix equations has a unique solution?
- A. \(\begin{bmatrix} 1 & 1 \\ 1 & 1 \end{bmatrix} \begin{bmatrix} x \\ y \end{bmatrix} = \begin{bmatrix} 2 \\ 10 \end{bmatrix}\)
- B. \(\begin{bmatrix} 6 & -6 \\ -4 & 4 \end{bmatrix} \begin{bmatrix} x \\ y \end{bmatrix} = \begin{bmatrix} 60 \\ 36 \end{bmatrix}\)
- C. \(\begin{bmatrix} 8 & -4 \\ 4 & 2 \end{bmatrix} \begin{bmatrix} x \\ y \end{bmatrix} = \begin{bmatrix} 12 \\ 18 \end{bmatrix}\)
- D. \(\begin{bmatrix} 7 & 0 \\ 5 & 0 \end{bmatrix} \begin{bmatrix} x \\ y \end{bmatrix} = \begin{bmatrix} 14 \\ 15 \end{bmatrix}\)
- E. \(\begin{bmatrix} 4 & -2 \\ 6 & -3 \end{bmatrix} \begin{bmatrix} x \\ y \end{bmatrix} = \begin{bmatrix} 36 \\ 24 \end{bmatrix}\)
A permutation matrix, \(P\), can be used to change \(\begin{bmatrix} F \\ E \\ A \\ R \\ S \end{bmatrix}\) into \(\begin{bmatrix} S \\ A \\ F \\ R \\ E \end{bmatrix}\).
Matrix \(P\) is
- A. \(\begin{bmatrix} 0 & 0 & 1 & 0 & 1 \\ 0 & 0 & 1 & 1 & 0 \\ 1 & 1 & 0 & 0 & 0 \\ 0 & 1 & 0 & 0 & 1 \\ 1 & 0 & 0 & 1 & 0 \end{bmatrix}\)
- B. \(\begin{bmatrix} 0 & 0 & 0 & 1 & 0 \\ 0 & 0 & 1 & 0 & 0 \\ 0 & 1 & 0 & 0 & 0 \\ 0 & 0 & 0 & 0 & 1 \\ 1 & 0 & 0 & 0 & 0 \end{bmatrix}\)
- C. \(\begin{bmatrix} 0 & 0 & 0 & 0 & 1 \\ 0 & 0 & 1 & 0 & 0 \\ 1 & 0 & 0 & 0 & 0 \\ 0 & 0 & 0 & 1 & 0 \\ 0 & 1 & 0 & 0 & 0 \end{bmatrix}\)
- D. \(\begin{bmatrix} 1 & 0 & 0 & 0 & 1 \\ 0 & 1 & 1 & 0 & 0 \\ 1 & 0 & 1 & 0 & 0 \\ 0 & 1 & 0 & 1 & 0 \\ 0 & 0 & 0 & 1 & 1 \end{bmatrix}\)
- E. \(\begin{bmatrix} 0 & 0 & 0 & 0 & 1 \\ 0 & 0 & 1 & 0 & 0 \\ 0 & 1 & 0 & 0 & 0 \\ 1 & 0 & 0 & 0 & 0 \\ 0 & 0 & 0 & 1 & 0 \end{bmatrix}\)
Four teams, \(A, B, C\) and \(D\), competed in a round-robin competition where each team played each of the other teams once. There were no draws.
The results are shown in the matrix below.
\( \begin{array}{cc} & \textit{loser} \\ \textit{winner} & \begin{array}{c@{}c} & \begin{array}{@{}cccc@{}} A & B & C & D \end{array} \\ \begin{matrix} A \\ B \\ C \\ D \end{matrix} & \left[ \begin{array}{@{}cccc@{}} 0 & 0 & f & 1 \\ 1 & 0 & 0 & 0 \\ 1 & g & 0 & 1 \\ 0 & 1 & 0 & h \end{array} \right] \end{array} \end{array} \)
A '1' in the matrix shows that the team named in that row defeated the team named in that column.
For example, the '1' in row 2 shows that team \(B\) defeated team \(A\).
In this matrix, the values of \(f, g\) and \(h\) are
- A. \(f = 0, \quad g = 1, \quad h = 0\)
- B. \(f = 0, \quad g = 1, \quad h = 1\)
- C. \(f = 1, \quad g = 0, \quad h = 0\)
- D. \(f = 1, \quad g = 1, \quad h = 0\)
- E. \(f = 1, \quad g = 1, \quad h = 1\)
The table below shows information about two matrices, \(A\) and \(B\).
| Matrix | Order | Rule |
|---|---|---|
| \(A\) | \(3 \times 3\) | \(a_{ij} = 2i + j\) |
| \(B\) | \(3 \times 3\) | \(b_{ij} = i - j\) |
The element in row \(i\) and column \(j\) of matrix \(A\) is \(a_{ij}\).
The element in row \(i\) and column \(j\) of matrix \(B\) is \(b_{ij}\).
The sum \(A + B\) is
- A. \(\begin{bmatrix} 5 & 7 & 9 \\ 8 & 10 & 12 \\ 11 & 13 & 15 \end{bmatrix}\)
- B. \(\begin{bmatrix} 5 & 8 & 11 \\ 7 & 10 & 13 \\ 9 & 12 & 15 \end{bmatrix}\)
- C. \(\begin{bmatrix} 3 & 6 & 9 \\ 3 & 6 & 9 \\ 3 & 6 & 9 \end{bmatrix}\)
- D. \(\begin{bmatrix} 3 & 3 & 3 \\ 6 & 6 & 6 \\ 9 & 9 & 9 \end{bmatrix}\)
- E. \(\begin{bmatrix} 3 & 6 & 3 \\ 6 & 3 & 9 \\ 3 & 9 & 3 \end{bmatrix}\)
At a fish farm:
- young fish (\(Y\)) may eventually grow into juveniles (\(J\)) or they may die (\(D\))
- juveniles (\(J\)) may eventually grow into adults (\(A\)) or they may die (\(D\))
- adults (\(A\)) eventually die (\(D\)).
The initial state of this population, \(F_0\), is shown below.
\( F_0 = \begin{bmatrix} 50\,000 \\ 10\,000 \\ 7000 \\ 0 \end{bmatrix} \begin{matrix} Y \\ J \\ A \\ D \end{matrix} \)
Every month, fish are either sold or bought so that the number of young, juvenile and adult fish in the farm remains constant.
The population of fish in the fish farm after \(n\) months, \(F_n\), can be determined by the recurrence rule
\( F_{n+1} = \begin{bmatrix} 0.65 & 0 & 0 & 0 \\ 0.25 & 0.75 & 0 & 0 \\ 0 & 0.20 & 0.95 & 0 \\ 0.10 & 0.05 & 0.05 & 1 \end{bmatrix} F_n + B \)
where \(B\) is a column matrix that shows the number of young, juvenile and adult fish bought or sold each month and the number of dead fish that are removed.
Each month, the fish farm will
- A. sell 1650 adult fish.
- B. buy 1750 adult fish.
- C. sell 17 500 young fish.
- D. buy 50 000 young fish.
- E. buy 10 000 juvenile fish.
Consider the matrix recurrence relation below.
\( S_0 = \begin{bmatrix} 40 \\ 15 \\ 20 \end{bmatrix}, \quad S_{n+1} = T S_n \quad \text{where } T = \begin{bmatrix} 0.3 & 0.2 & V \\ 0.2 & 0.2 & W \\ X & Y & Z \end{bmatrix} \)
Matrix \(T\) is a regular transition matrix.
Given the above and that \(S_1 = \begin{bmatrix} 29 \\ 13 \\ 33 \end{bmatrix}\), which one of the following expressions is not true?
- A. \(W > Z\)
- B. \(Y > X\)
- C. \(V > Y\)
- D. \(V + W + Z = 1\)
- E. \(X + Y + Z > 1\)
Module 2 – Networks and decision mathematics
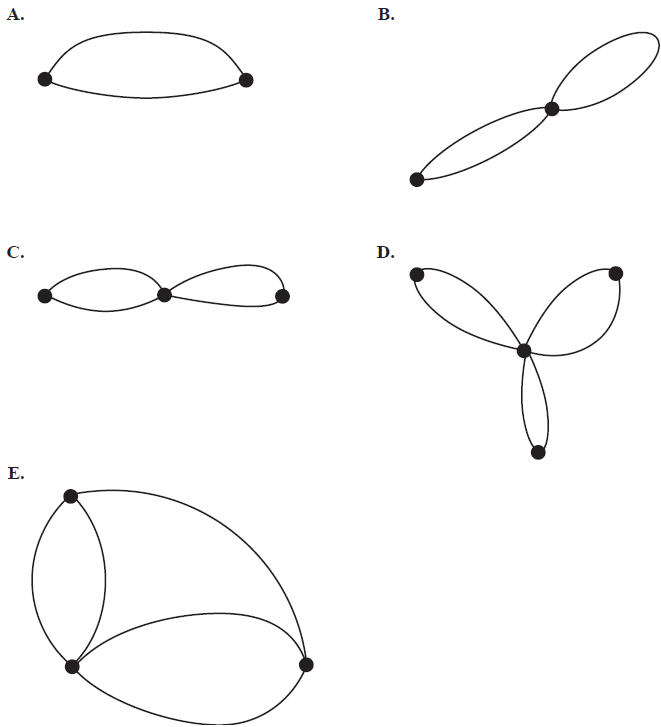
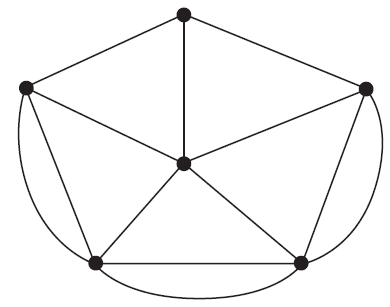
Question 1Which one of the following graphs contains a loop?
Two graphs, labelled Graph 1 and Graph 2, are shown below.
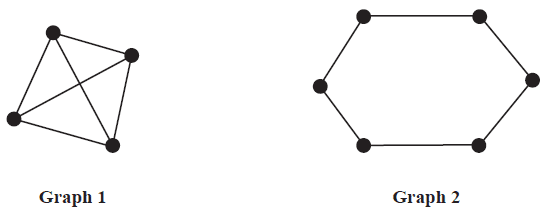
The sum of the degrees of the vertices of Graph 1 is
- A. two less than the sum of the degrees of the vertices of Graph 2.
- B. one less than the sum of the degrees of the vertices of Graph 2.
- C. equal to the sum of the degrees of the vertices of Graph 2.
- D. one more than the sum of the degrees of the vertices of Graph 2.
- E. two more than the sum of the degrees of the vertices of Graph 2.
Consider the following graph.
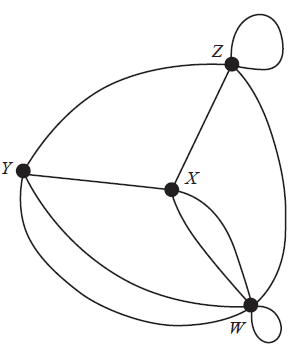
The adjacency matrix for this graph, with some elements missing, is shown below.
\( \begin{array}{c@{}c} & \begin{array}{@{}cccc@{}} W & X & Y & Z \end{array} \\ \begin{matrix} W \\ X \\ Y \\ Z \end{matrix} & \left[ \begin{array}{@{}cccc@{}} 1 & - & - & - \\ - & 0 & - & - \\ - & - & 0 & - \\ - & - & - & 1 \end{array} \right] \end{array} \)
This adjacency matrix contains 16 elements when complete.
Of the 12 missing elements
- A. eight are '1' and four are '2'.
- B. four are '1' and eight are '2'.
- C. six are '1' and six are '2'.
- D. two are '0', six are '1' and four are '2'.
- E. four are '0', four are '1' and four are '2'.
Use the following information to answer Questions 4 and 5.
The directed graph below shows the sequence of activities required to complete a project.
The time to complete each activity, in hours, is also shown.
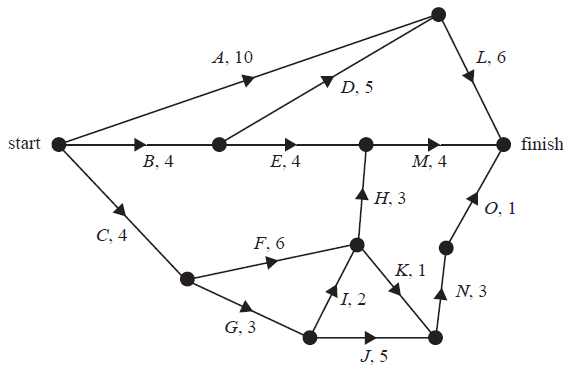
The earliest starting time, in hours, for activity \(N\) is
- A. 3
- B. 10
- C. 11
- D. 12
- E. 13
To complete the project in minimum time, some activities cannot be delayed.
The number of activities that cannot be delayed is
- A. 2
- B. 3
- C. 4
- D. 5
- E. 6
An Eulerian trail for the graph above will be possible if only one edge is removed.
In how many different ways could this be done?
- A. 1
- B. 2
- C. 3
- D. 4
- E. 5
A graph with six vertices has no loops or multiple edges.
Which one of the following statements about this graph is not true?
- A. If the graph is a tree it has five edges.
- B. If the graph is complete it has 15 edges.
- C. If the graph has eight edges it may have an isolated vertex.
- D. If the graph is bipartite it will have a minimum of nine edges.
- E. If the graph has a cycle it will have a minimum of three edges.
The flow of oil through a series of pipelines, in litres per minute, is shown in the network below.
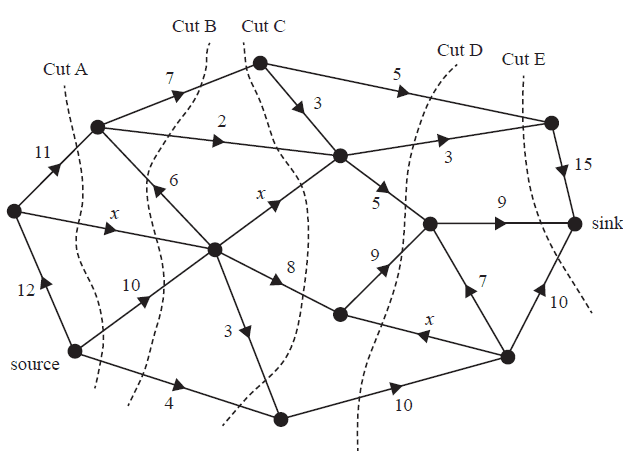
The weightings of three of the edges are labelled \(x\).
Five cuts labelled A–E are shown on the network.
The maximum flow of oil from the source to the sink, in litres per minute, is given by the capacity of
- A. Cut A if \(x = 1\)
- B. Cut B if \(x = 2\)
- C. Cut C if \(x = 2\)
- D. Cut D if \(x = 3\)
- E. Cut E if \(x = 3\)
Module 3 – Geometry and measurement
Question 1A wheel has five spokes equally spaced around a central hub, as shown in the diagram below.
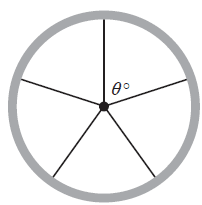
The angle \(\theta\) between two spokes is labelled on the diagram.
What is the angle \(\theta\)?
- A. 5°
- B. 36°
- C. 60°
- D. 72°
- E. 90°
A right-angled triangle, \(XYZ\), has side lengths \(XY = 38.5\) cm and \(YZ = 24.0\) cm, as shown in the diagram below.
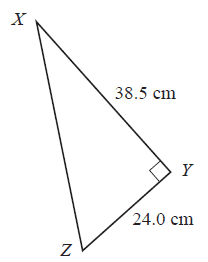
The length of \(XZ\), in centimetres, is closest to
- A. 24.8
- B. 30.1
- C. 38.8
- D. 45.4
- E. 62.5
The locations of four cities are given below.
Adelaide (35° S, 139° E)
Melilla (35° N, 3° W)
Buenos Aires (35° S, 58° W)
Heraklion (35° N, 25° E)
In which order, from first to last, will the sun rise in these cities on New Year’s Day 2018?
- A. Adelaide, Heraklion, Buenos Aires, Melilla
- B. Adelaide, Heraklion, Melilla, Buenos Aires
- C. Heraklion, Adelaide, Melilla, Buenos Aires
- D. Melilla, Adelaide, Heraklion, Buenos Aires
- E. Melilla, Adelaide, Buenos Aires, Heraklion
A grain storage silo in the shape of a cylinder with a conical top is shown in the diagram below.
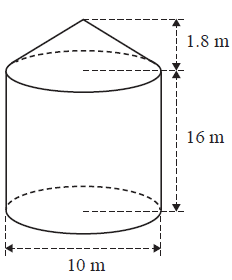
The volume of this silo, in cubic metres, is closest to
- A. 550
- B. 1304
- C. 1327
- D. 1398
- E. 2560
A segment is formed by an angle of 75° in a circle of radius 112 mm.
This segment is shown shaded in the diagram below.
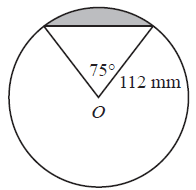
Which one of the following calculations will give the area of the shaded segment?
- A. \(\pi \times 112^2 \times \left(\frac{75}{360}\right)\)
- B. \(\pi \times 112^2 \times \left(\frac{285}{360}\right)\)
- C. \(\pi \times 112^2 \times \left(\frac{75}{360}\right) - \frac{1}{2} \times 112^2 \times \sin(75^\circ)\)
- D. \(\pi \times 112^2 \times \left(\frac{285}{360}\right) - \frac{1}{2} \times 112^2 \times \sin(75^\circ)\)
- E. \(\pi \times 112^2 \times \left(\frac{75}{180}\right) - \frac{1}{2} \times 112^2 \times \sin(75^\circ)\)
A hemispherical bowl of radius 10 cm is shown in the diagram below.
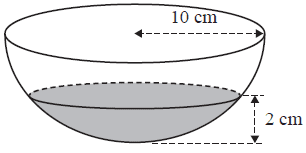
The bowl contains water with a maximum depth of 2 cm.
The radius of the surface of the water, in centimetres, is
- A. 2
- B. 6
- C. 8
- D. 9
- E. 10
A triangle \(ABC\) has:
- one side, \(\overline{AB}\), of length 4 cm
- one side, \(\overline{BC}\), of length 7 cm
- one angle, \(\angle ACB\), of 26°.
Which one of the following angles, correct to the nearest degree, could not be another angle in triangle \(ABC\)?
- A. 24°
- B. 50°
- C. 104°
- D. 130°
- E. 144°
Three circles of radius 50 mm are placed so that they just touch each other.
The region enclosed by the circles is shaded in the diagram below.
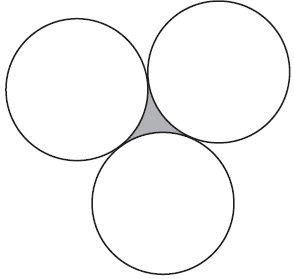
The area of the shaded region, in square millimetres, is closest to
- A. 403
- B. 436
- C. 1309
- D. 2844
- E. 4330
Module 4 – Graphs and relations
Question 1The equation of the line that passes through the points (0, 4) and (2, 4) is
- A. \(x = 4\)
- B. \(y = 4\)
- C. \(y = 4x\)
- D. \(y = 4x + 2\)
- E. \(y = 2x + 4\)
The graph below shows the volume of water in a water tank between 7 am and 5 pm on one day.
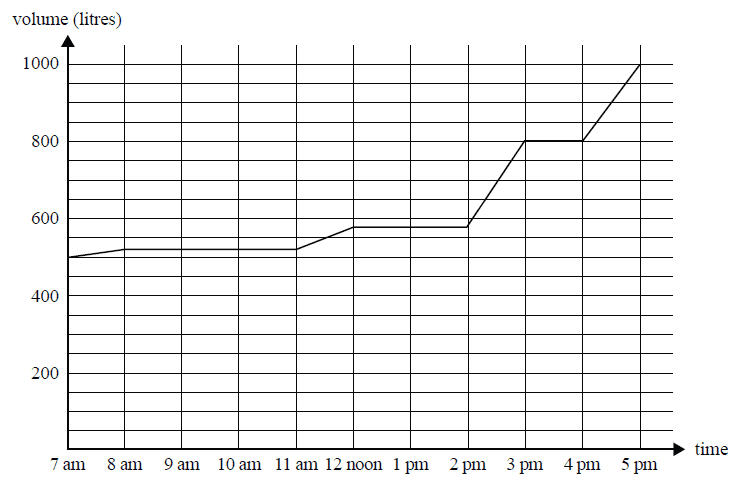
Which one of the following statements is true?
- A. The volume of water in the tank decreases between 8 am and 11 am.
- B. The volume of water in the tank increases at the greatest rate between 4 pm and 5 pm.
- C. The volume of water in the tank is constant between 12 noon and 2 pm.
- D. The tank is filled with water at a constant rate of 100 L per hour.
- E. More water enters the tank during the first five hours than during the last five hours.
The point (5, 100) lies on the graph of \(y = kx^2\), as shown below.
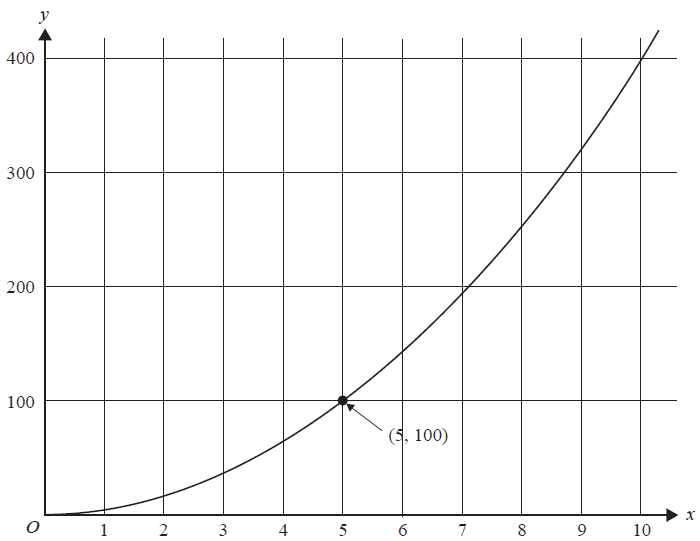
The value of \(k\) is
- A. \(\frac{1}{4}\)
- B. 4
- C. 5
- D. 20
- E. 40
The annual fee for membership of a car club, in dollars, based on years of membership of the club is shown in the step graph below.
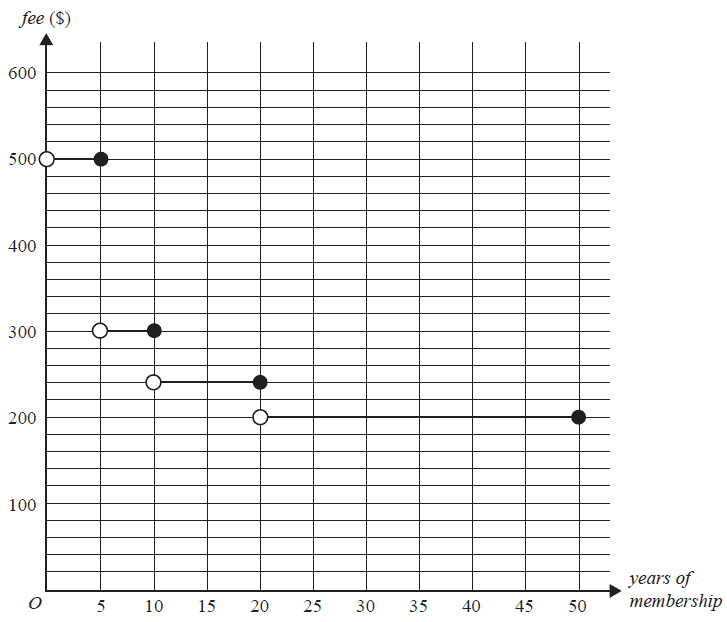
In the Martin family:
- Hayley has been a member of the club for four years
- John has been a member of the club for 20 years
- Sharon has been a member of the club for 25 years.
What is the total fee for membership of the car club for the Martin family?
- A. $200
- B. $600
- C. $720
- D. $900
- E. $940
A childcare centre requires at least one teacher employed for every 15 children enrolled.
Let \(x\) be the number of teachers employed.
Let \(y\) be the number of children enrolled.
Which one of the following is the inequality that represents this situation?
- A. \(y \ge 15x\)
- B. \(y \le \frac{x}{15}\)
- C. \(y \le \frac{15}{x}\)
- D. \(y \le 15x\)
- E. \(y \ge \frac{x}{15}\)
The ticket office at a circus sells adult tickets and child tickets:
- The Payne family bought two adult tickets and three child tickets for $69.50
- The Tran family bought one adult ticket and five child tickets for $78.50
- The Saunders family bought three adult tickets and four child tickets.
What is the total amount spent by the Saunders family?
- A. $83.40
- B. $87.50
- C. $98.00
- D. $101.50
- E. $112.00
Connor makes 200 meat pies to sell at his local market.
The cost, \($C\), of producing \(n\) pies can be determined from the rule below.
\(C = 0.8n + 250\)
Connor sells the first 150 pies at full price and sells the remaining 50 pies at half-price.
To break even, the full price of each pie must be closest to
- A. $1.85
- B. $2.05
- C. $2.35
- D. $2.50
- E. $2.75
The shaded area in the graph below shows the feasible region for a linear programming problem.
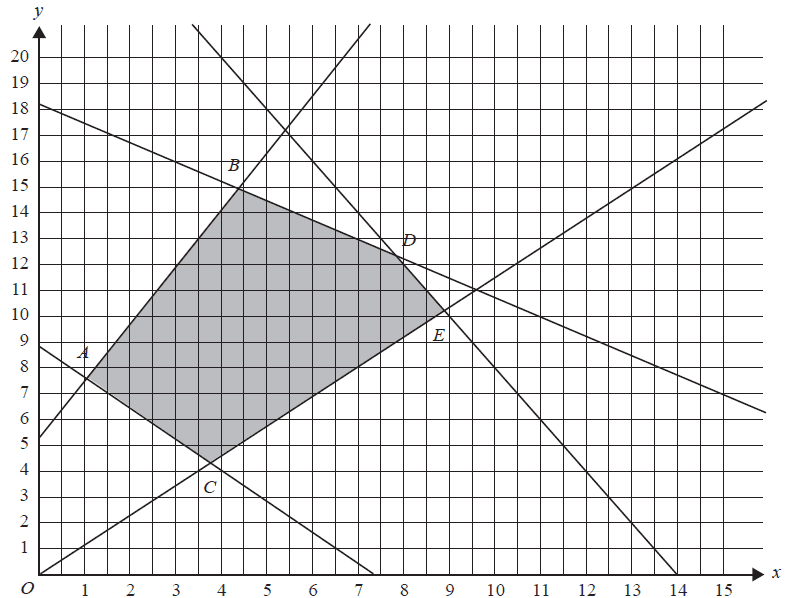
The objective function is given by
\(Z = mx + ny\)
Which one of the following statements is not true?
- A. When \(m = 4\) and \(n = 1\), the minimum value of \(Z\) is at point \(A\).
- B. When \(m = 1\) and \(n = 6\), the maximum value of \(Z\) is at point \(B\).
- C. When \(m = 2\) and \(n = 5\), the minimum value of \(Z\) is at point \(C\).
- D. When \(m = 2\) and \(n = 6\), the maximum value of \(Z\) is at point \(D\).
- E. When \(m = 12\) and \(n = 1\), the maximum value of \(Z\) is at point \(E\).
End of Multiple-Choice Question Book
VCE is a registered trademark of the VCAA. The VCAA does not endorse or make any warranties regarding this study resource. Past VCE exams and related content can be accessed directly at www.vcaa.vic.edu.au
