2016 VCE Further Maths Exam 2
This is the full VCE Further Maths Exam with worked solutions. You can also try Mini-Tests, which are official VCAA exams split into short tests you can do anytime.
Number of marks: 60
Reading time: 15 minutes
Writing time: 1.5 hours
Instructions
• Answer all questions in pencil on your Multiple-Choice Answer Sheet.
• Choose the response that is correct for the question.
• A correct answer scores 1; an incorrect answer scores 0.
• Marks will not be deducted for incorrect answers.
• No marks will be given if more than one answer is completed for any question.
• Unless otherwise indicated, the diagrams in this book are not drawn to scale.
SECTION A – Core
Data analysis
Question 1 (7 marks)The dot plot below shows the distribution of daily rainfall, in millimetres, at a weather station for 30 days in September.
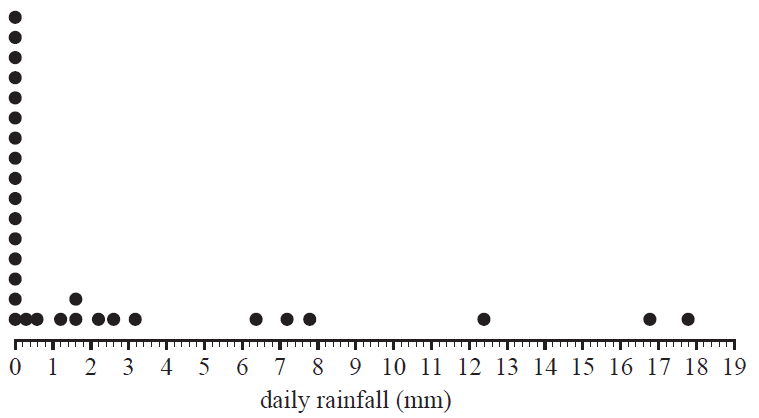
a. Write down the
i. range 1 mark
ii. median. 1 mark
b. Circle the data point on the dot plot above that corresponds to the third quartile (\(Q_3\)). 1 mark
c. Write down
i. the number of days on which no rainfall was recorded 1 mark
ii. the percentage of days on which the daily rainfall exceeded 12 mm. 1 mark
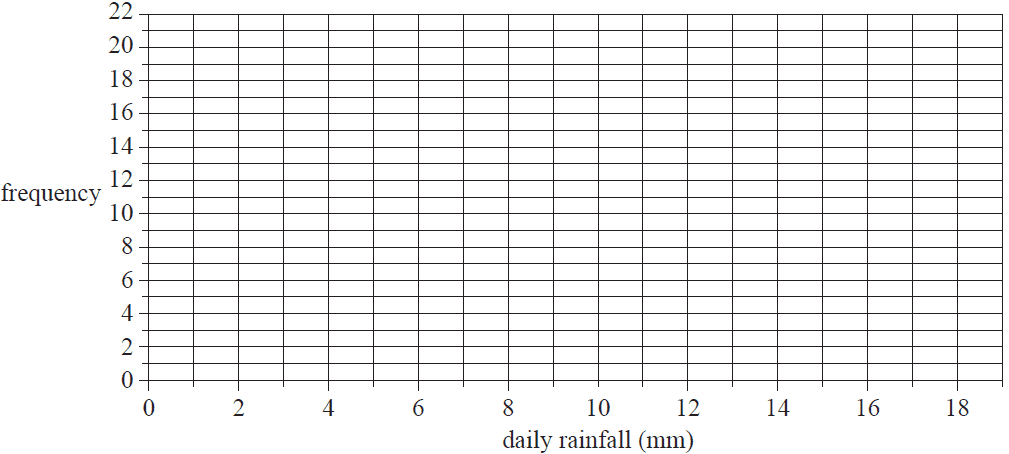
d. Use the grid below to construct a histogram that displays the distribution of daily rainfall for the month of September. Use interval widths of two with the first interval starting at 0. 2 marks
The weather station also records daily maximum temperatures.
a. The five-number summary for the distribution of maximum temperatures for the month of February is displayed in the table below.
| Temperature (°C) | |
|---|---|
| Minimum | 16 |
| \(Q_1\) | 21 |
| Median | 25 |
| \(Q_3\) | 31 |
| Maximum | 38 |
There are no outliers in this distribution.
i. Use the five-number summary above to construct a boxplot on the grid below. 1 mark
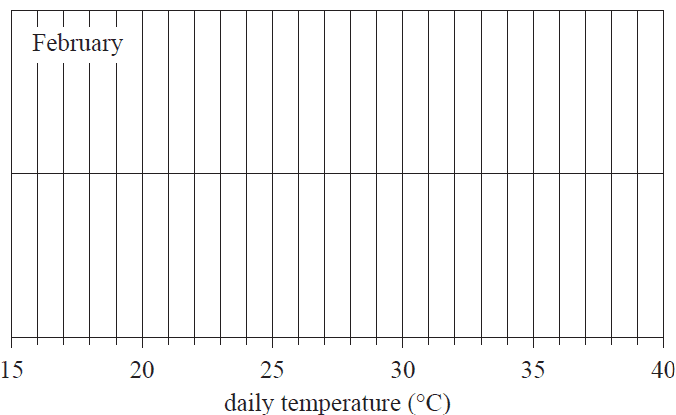
ii. What percentage of days had a maximum temperature of 21°C, or greater, in this particular February? 1 mark
b. The boxplots below display the distribution of maximum daily temperature for the months of May and July.
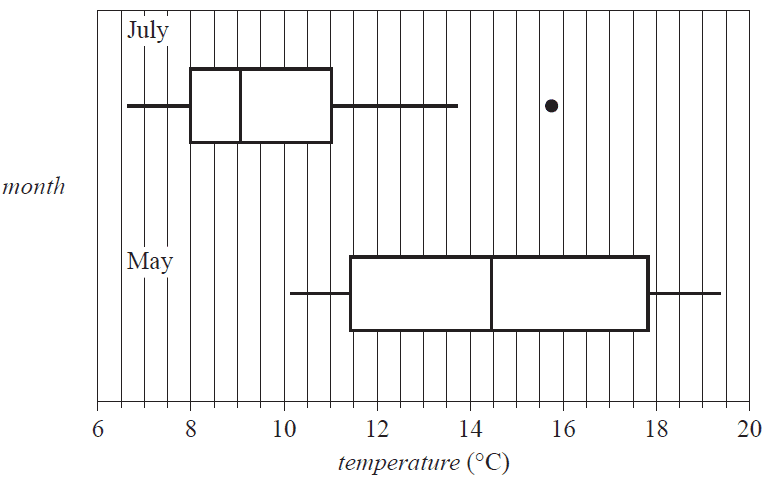
i. Describe the shapes of the distributions of daily temperature (including outliers) for July and for May. 1 mark
July
May
ii. Determine the value of the upper fence for the July boxplot. 1 mark
iii. Using the information from the boxplots, explain why the maximum daily temperature is associated with the month of the year. Quote the values of appropriate statistics in your response. 1 mark
The data in the table below shows a sample of actual temperatures and apparent temperatures recorded at the weather station. A scatterplot of the data is also shown.
The data will be used to investigate the association between the variables apparent temperature and actual temperature.
| Apparent temperature (°C) | Actual temperature (°C) |
|---|---|
| 24.7 | 28.5 |
| 24.3 | 27.6 |
| 24.9 | 27.7 |
| 23.2 | 26.9 |
| 24.2 | 26.6 |
| 22.6 | 25.5 |
| 21.5 | 24.4 |
| 20.6 | 23.8 |
| 19.4 | 22.3 |
| 18.4 | 22.1 |
| 17.6 | 20.9 |
| 18.7 | 21.2 |
| 18.2 | 20.5 |
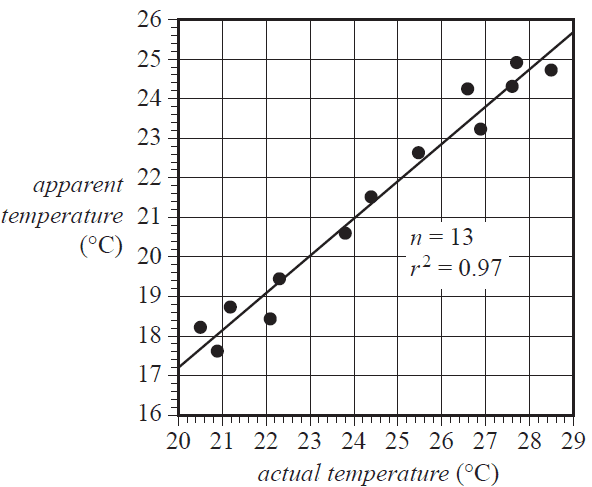
a. Use the scatterplot to describe the association between apparent temperature and actual temperature in terms of strength, direction and form. 1 mark
b. i. Determine the equation of the least squares line that can be used to predict the apparent temperature from the actual temperature. Write the values of the intercept and slope of this least squares line in the appropriate boxes provided below. Round your answers to two significant figures. 3 marks
apparent temperature = + × actual temperature
ii. Interpret the intercept of the least squares line in terms of the variables apparent temperature and actual temperature. 1 mark
c. The coefficient of determination for the association between the variables apparent temperature and actual temperature is 0.97. Interpret the coefficient of determination in terms of these variables. 1 mark
d. The residual plot obtained when the least squares line was fitted to the data is shown below.
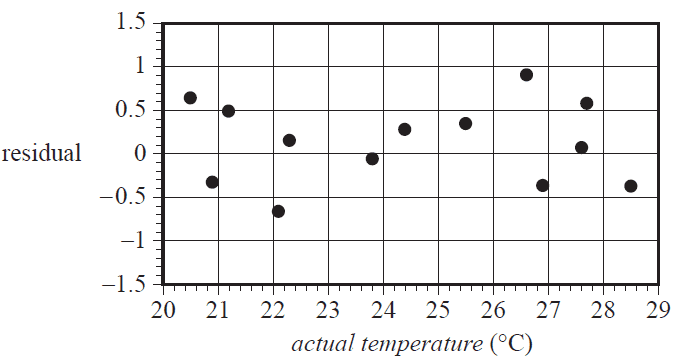
i. A residual plot can be used to test an assumption about the nature of the association between two numerical variables. What is this assumption? 1 mark
ii. Does the residual plot above support this assumption? Explain your answer. 1 mark
The time series plot below shows the minimum rainfall recorded at the weather station each month plotted against the month number (1 = January, 2 = February, and so on).
Rainfall is recorded in millimetres.
The data was collected over a period of one year.
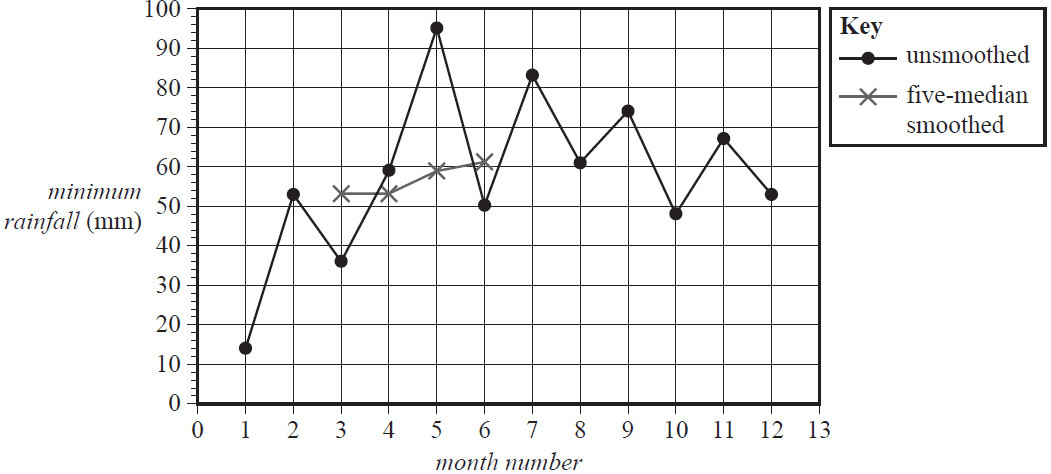
a. Five-median smoothing has been used to smooth the time series plot above. The first four smoothed points are shown as crosses (×). Complete the five-median smoothing by marking smoothed values with crosses (×) on the time series plot above. 2 marks
The maximum daily rainfall each month was also recorded at the weather station.
The table below shows the maximum daily rainfall each month for a period of one year.
| Month | Jan. | Feb. | Mar. | Apr. | May | June | July | Aug. | Sep. | Oct. | Nov. | Dec. |
| Month number | 1 | 2 | 3 | 4 | 5 | 6 | 7 | 8 | 9 | 10 | 11 | 12 |
| Maximum daily rainfall (mm) | 79 | 123 | 100 | 156 | 174 | 186 | 149 | 162 | 124 | 140 | 225 | 119 |
The data in the table has been used to plot maximum daily rainfall against month number in the time series plot below.
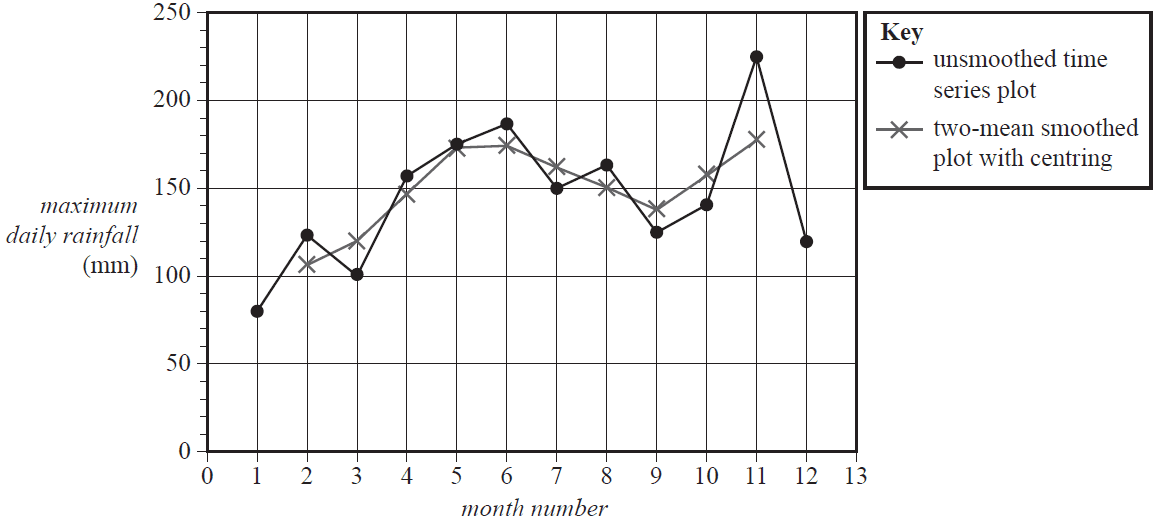
b. Two-mean smoothing with centring has been used to smooth the time series plot above. The smoothed values are marked with crosses (×). Using the data given in the table, show that the two-mean smoothed rainfall centred on October is 157.25 mm. 2 marks
Recursion and financial modelling
Question 5 (5 marks)Ken has opened a savings account to save money to buy a new caravan. The amount of money in the savings account after \(n\) years, \(V_n\), can be modelled by the recurrence relation shown below.
\(V_0 = 15000, \quad V_{n+1} = 1.04 \times V_n\)
a. How much money did Ken initially deposit into the savings account? 1 mark
b. Use recursion to write down calculations that show that the amount of money in Ken's savings account after two years, \(V_2\), will be $16224. 1 mark
c. What is the annual percentage compound interest rate for this savings account? 1 mark
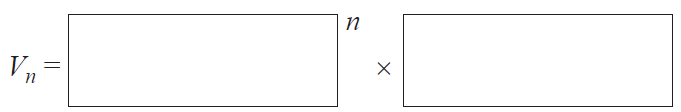
d. The amount of money in the account after \(n\) years, \(V_n\), can also be determined using a rule.
i. Complete the rule below by writing the appropriate numbers in the boxes provided. 1 mark
ii. How much money will be in Ken's savings account after 10 years? 1 mark
Ken's first caravan had a purchase price of $38 000. After eight years, the value of the caravan was $16 000.
a. Show that the average depreciation in the value of the caravan per year was $2750. 1 mark
b. Let \(C_n\) be the value of the caravan \(n\) years after it was purchased. Assume that the value of the caravan has been depreciated using the flat rate method of depreciation. Write down a recurrence relation, in terms of \(C_{n+1}\) and \(C_n\), that models the value of the caravan. 1 mark
c. The caravan has travelled an average of 5000 km in each of the eight years since it was purchased. Assume that the value of the caravan has been depreciated using the unit cost method of depreciation. By how much is the value of the caravan reduced per kilometre travelled? 1 mark
Ken has borrowed $70000 to buy a new caravan. He will be charged interest at the rate of 6.9% per annum, compounding monthly.
a. For the first year (12 months), Ken will make monthly repayments of $800.
i. Find the amount that Ken will owe on his loan after he has made 12 repayments. 1 mark
ii. What is the total interest that Ken will have paid after 12 repayments? 1 mark
b. After three years, Ken will make a lump sum payment of $L in order to reduce the balance of his loan. This lump sum payment will ensure that Ken's loan is fully repaid in a further three years. Ken's repayment amount remains at $800 per month and the interest rate remains at 6.9% per annum, compounding monthly. What is the value of Ken's lump sum payment, $L? Round your answer to the nearest dollar. 2 marks
SECTION B – Modules
Module 1 – Matrices
Question 1 (3 marks)A travel company arranges flight (F), hotel (H), performance (P) and tour (T) bookings. Matrix \(C\) contains the number of each type of booking for a month.
\[ C = \begin{bmatrix} 85 \\ 38 \\ 24 \\ 43 \end{bmatrix} \begin{matrix} F \\ H \\ P \\ T \end{matrix} \]a. Write down the order of matrix \(C\). 1 mark
A booking fee, per person, is collected by the travel company for each type of booking. Matrix \(G\) contains the booking fees, in dollars, per booking.
\[ G = \begin{array}{c@{}c} \begin{array}{@{}cccc@{}} F & H & P & T \end{array} \\ \left[ \begin{array}{@{}cccc@{}} 40 & 25 & 15 & 30 \end{array} \right] \end{array} \]b. i. Calculate the matrix product \(J = G \times C\). 1 mark
ii. What does matrix \(J\) represent? 1 mark
The travel company has five employees, Amara (A), Ben (B), Cheng (C), Dana (D) and Elka (E). The company allows each employee to send a direct message to another employee only as shown in the communication matrix \(G\) below. The matrix \(G^2\) is also shown below.
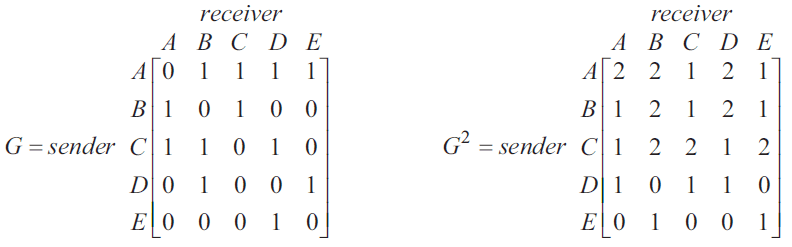
The '1' in row E, column D of matrix \(G\) indicates that Elka (sender) can send a direct message to Dana (receiver).
The '0' in row E, column C of matrix \(G\) indicates that Elka cannot send a direct message to Cheng.
a. To whom can Dana send a direct message? 1 mark
b. Cheng needs to send a message to Elka, but cannot do this directly. Write down the names of the employees who can send the message from Cheng directly to Elka. 1 mark
The travel company is studying the choice between air (A), land (L), sea (S) or no (N) travel by some of its customers each year. Matrix \(T\), shown below, contains the percentages of customers who are expected to change their choice of travel from year to year.
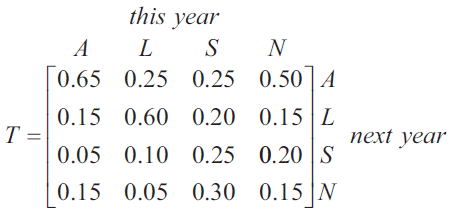
Let \(S_n\) be the matrix that shows the number of customers who choose each type of travel \(n\) years after 2014. Matrix \(S_0\) below shows the number of customers who chose each type of travel in 2014.
\[ S_0 = \begin{bmatrix} 520 \\ 320 \\ 80 \\ 80 \end{bmatrix} \begin{matrix} A \\ L \\ S \\ N \end{matrix} \]
Matrix \(S_1\) below shows the number of customers who chose each type of travel in 2015.
\[ S_1 = TS_0 = \begin{bmatrix} 478 \\ d \\ e \\ f \end{bmatrix} \begin{matrix} A \\ L \\ S \\ N \end{matrix} \]a. Write the values missing from matrix \(S_1\) (\(d, e, f\)) in the boxes provided below. 1 mark
\(d = \) \(e = \) \(f = \)
b. Write a calculation that shows that 478 customers were expected to choose air travel in 2015. 1 mark
c. Consider the customers who chose sea travel in 2014. How many of these customers were expected to choose sea travel in 2015? 1 mark
d. Consider the customers who were expected to choose air travel in 2015. What percentage of these customers had also chosen air travel in 2014? Round your answer to the nearest whole number. 1 mark
e. In 2016, the number of customers studied was increased to 1360. Matrix \(R_{2016}\), shown below, contains the number of these customers who chose each type of travel in 2016.
The company intends to increase the number of customers in the study in 2017 and in 2018. The matrix that contains the number of customers who are expected to choose each type of travel in 2017 (\(R_{2017}\)) and 2018 (\(R_{2018}\)) can be determined using the matrix equations shown below.
\(R_{2017} = TR_{2016} + B \quad R_{2018} = TR_{2017} + B\)
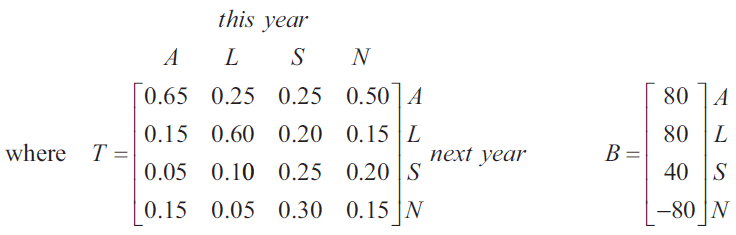
i. The element in the fourth row of matrix \(B\) is -80. Explain this number in the context of selecting customers for the studies in 2017 and 2018. 1 mark
ii. Determine the number of customers who are expected to choose sea travel in 2018. Round your answer to the nearest whole number. 2 marks
Module 2 – Networks and decision mathematics
Question 1 (3 marks)A map of the roads connecting five suburbs of a city, Alooma (A), Beachton (B), Campville (C), Dovenest (D) and Easyside (E), is shown below.
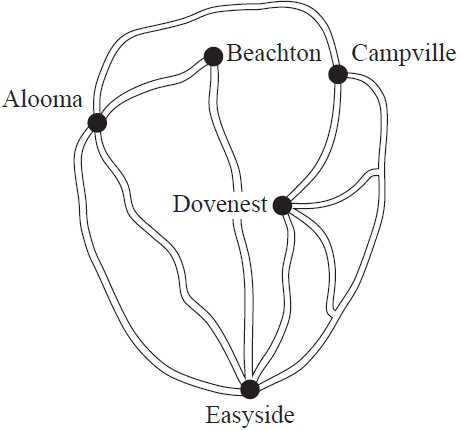
a. Starting at Beachton, which two suburbs can be driven to using only one road? 1 mark
A graph that represents the map of the roads is shown below.
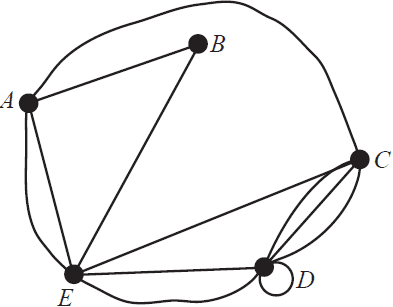
One of the edges that connects to vertex E is missing from the graph.
b. i. Add the missing edge to the graph above. 1 mark
ii. Explain what the loop at D represents in terms of a driver who is departing from Dovenest. 1 mark
The suburb of Alooma has a skateboard park with seven ramps. The ramps are shown as vertices T, U, V, W, X, Y and Z on the graph below.
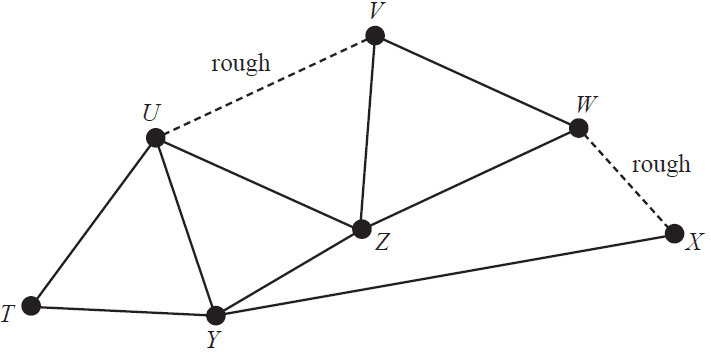
The tracks between ramps U and V and between ramps W and X are rough, as shown on the graph above.
a. Nathan begins skating at ramp W and follows an Eulerian trail. At which ramp does Nathan finish? 1 mark
b. Zoe begins skating at ramp X and follows a Hamiltonian path. The path she chooses does not include the two rough tracks. Write down a path that Zoe could take from start to finish. 1 mark
c. Birra can skate over any of the tracks, including the rough tracks. He begins skating at ramp X and will complete a Hamiltonian cycle. In how many ways could he do this? 1 mark
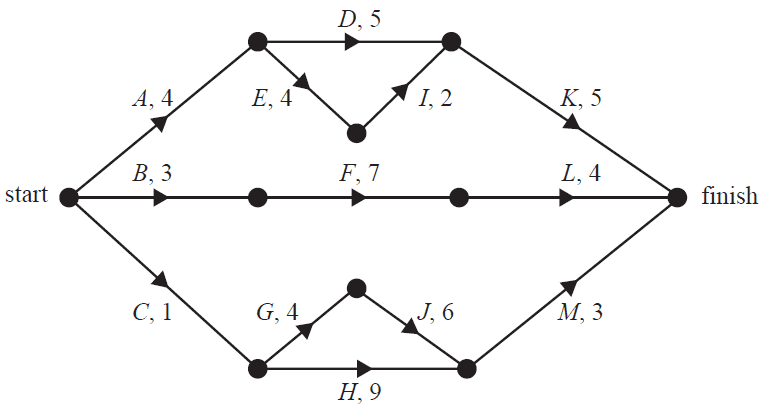
A new skateboard park is to be built in Beachton. This project involves 13 activities, A to M. The directed network below shows these activities and their completion times in days.
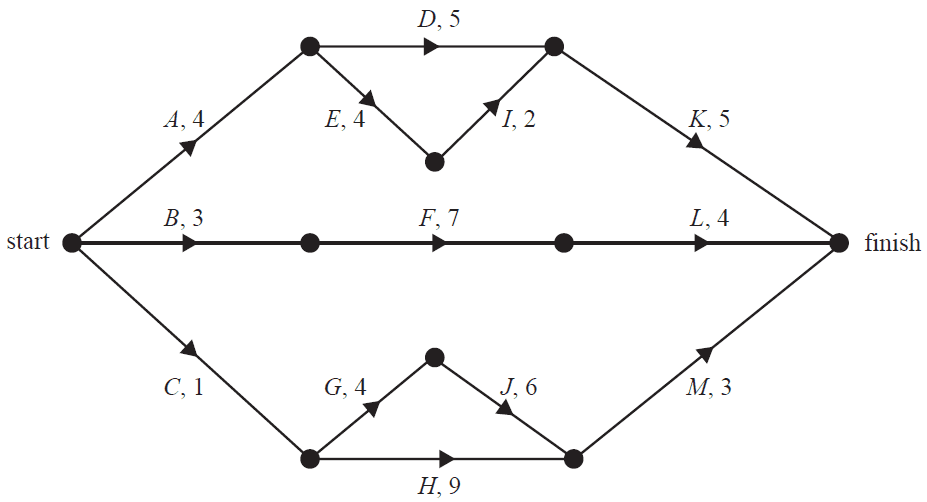
a. Determine the earliest start time for activity M. 1 mark
b. The minimum completion time for the skateboard park is 15 days. Write down the critical path for this project. 1 mark
c. Which activity has a float time of two days? 1 mark
d. The completion times for activities E, F, G, I and J can each be reduced by one day. The cost of reducing the completion time by one day for these activities is shown in the table below.
| Activity | Cost ($) |
|---|---|
| E | 3000 |
| F | 1000 |
| G | 5000 |
| I | 2000 |
| J | 4000 |
What is the minimum cost to complete the project in the shortest time possible? 1 mark
e. The skateboard park project on page 22 will be repeated at Campville, but with the addition of one extra activity. The new activity, N, will take six days to complete and has a float time of one day. Activity N will finish at the same time as the project.
i. Add activity N to the network below. 1 mark
ii. What is the latest start time for activity N? 1 mark
Module 3 – Geometry and measurement
Question 1 (2 marks)A golf ball is spherical in shape and has a radius of 21.4 mm, as shown in the diagram below.
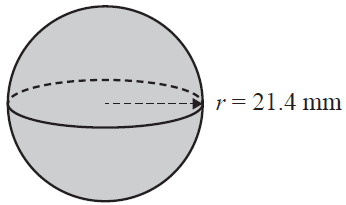
Assume that the surface of the golf ball is smooth.
a. What is the surface area of the golf ball shown? Round your answer to the nearest square millimetre. 1 mark
b. Golf balls are sold in a rectangular box that contains five identical golf balls, as shown in the diagram below.
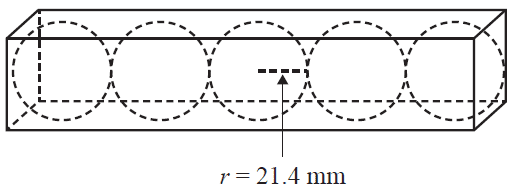
What is the minimum length, in millimetres, of the box? 1 mark
Salena practises golf at a driving range by hitting golf balls from point T. The first ball that Salena hits travels directly north, landing at point A. The second ball that Salena hits travels 50 m on a bearing of 030°, landing at point B. The diagram below shows the positions of the two balls after they have landed.
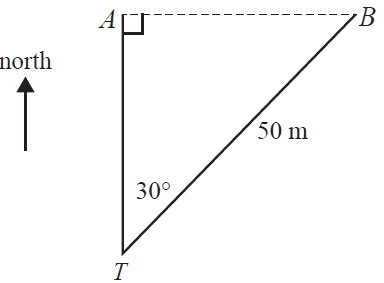
a. How far apart, in metres, are the two golf balls? 1 mark
b. A fence is positioned at the end of the driving range. The fence is 16.8 m high and is 200 m from the point T.
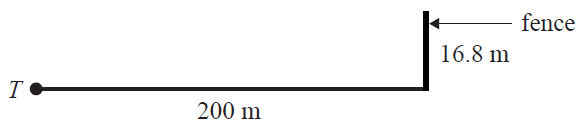
What is the angle of elevation from T to the top of the fence? Round your answer to the nearest degree. 1 mark
A golf tournament is played in St Andrews, Scotland, at location 56° N, 3° W.
a. Assume that the radius of Earth is 6400 km. Find the shortest great circle distance to the equator from St Andrews. Round your answer to the nearest kilometre. 1 mark
b. The tournament begins on Thursday at 6.32 am in St Andrews, Scotland. Many people in Melbourne will watch the tournament live on television. Assume that the time difference between Melbourne (38° S, 145° E) and St Andrews (56° N, 3° W) is 10 hours. On what day and at what time will the tournament begin in Melbourne? 1 mark
During a game of golf, Salena hits a ball twice, from P to Q and then from Q to R. The path of the ball after each hit is shown in the diagram below.
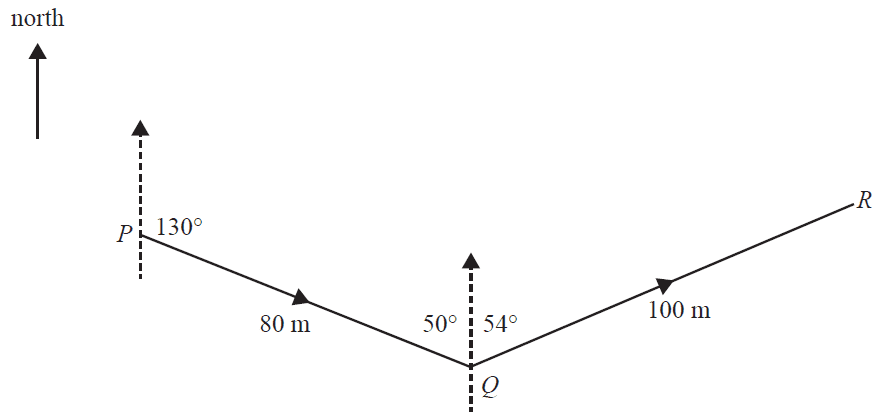
After Salena's first hit, the ball travelled 80 m on a bearing of 130° from point P to point Q. After Salena's second hit, the ball travelled 100 m on a bearing of 054° from point Q to point R.
a. Another ball is hit and travels directly from P to R. Use the cosine rule to find the distance travelled by this ball. Round your answer to the nearest metre. 2 marks
b. What is the bearing of R from P? Round your answer to the nearest degree. 1 mark
A golf course has a sprinkler system that waters the grass in the shape of a sector, as shown in the diagram below.
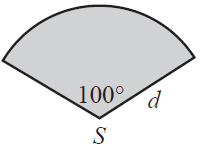
A sprinkler is positioned at point S and can turn through an angle of 100°. The shaded area on the diagram shows the area of grass that is watered by the sprinkler.
a. If 147.5 m² of grass is watered, what is the maximum distance, \(d\) metres, that the water reaches from S? Round your answer to the nearest metre. 1 mark
b. Another sprinkler can water a larger area of grass. This sprinkler will water a section of grass as shown in the diagram below.
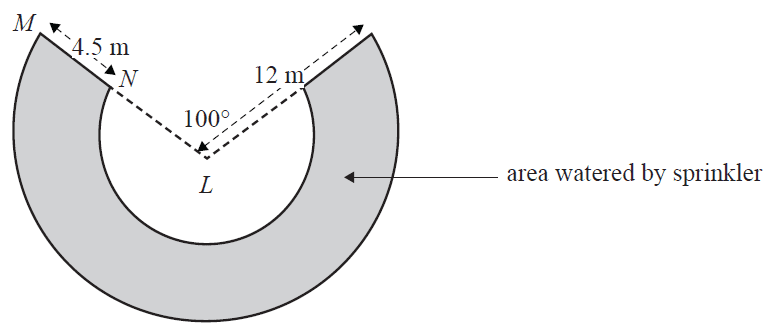
The section of grass that is watered is 4.5 m wide at all points. Water can reach a maximum of 12 m from the sprinkler at L. What is the area of grass that this sprinkler will water? Round your answer to the nearest square metre. 2 marks
Module 4 – Graphs and relations
Question 1 (4 marks)Maria is a hockey player. She is paid a bonus that depends on the number of goals that she scores in a season. The graph below shows the value of Maria's bonus against the number of goals that she scores in a season.
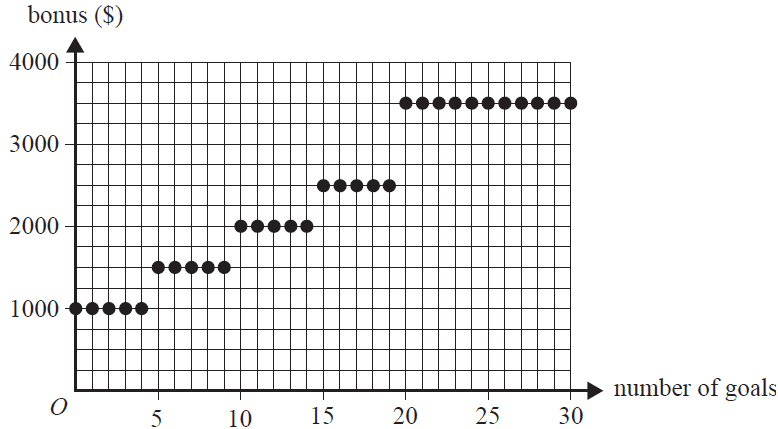
a. What is the value of Maria's bonus if she scores seven goals in a season? 1 mark
b. What is the least number of goals that Maria must score in a season to receive a bonus of $2500? 1 mark
Another player, Bianca, is paid a bonus of $125 for every goal that she scores in a season.
c. What is the value of Bianca's bonus if she scores eight goals in a season? 1 mark
d. At the end of the season, both players have scored the same number of goals and receive the same bonus amount. How many goals did Maria and Bianca each score in the season? 1 mark
The bonus money is provided by a company that manufactures and sells hockey balls. The cost, in dollars, of manufacturing a certain number of balls can be found using the equation
cost = 1200 + 1.5 × number of balls
a. How many balls would be manufactured if the cost is $1650? 1 mark
b. On the grid below, sketch the graph of the relationship between the manufacturing cost and the number of balls manufactured. 1 mark
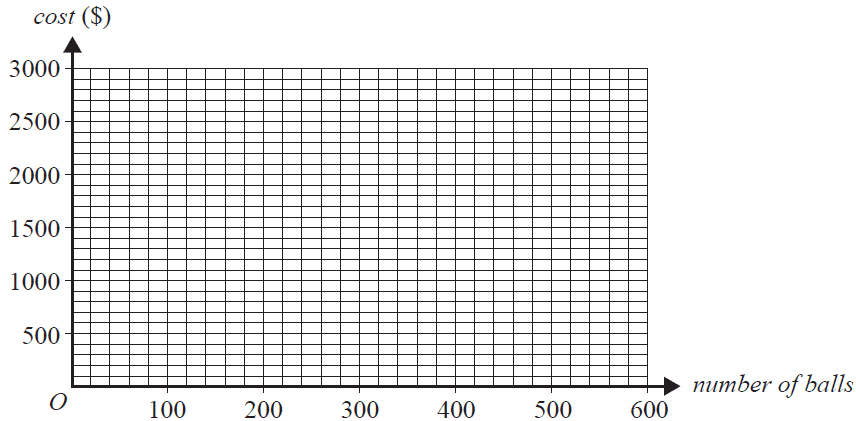
c. The company will break even on the sale of hockey balls when it manufactures and sells 200 hockey balls. Find the selling price of one hockey ball. 1 mark
The company also produces two types of hockey stick, the 'Flick' and the 'Jink'. Let \(x\) be the number of Flick hockey sticks that are produced each month. Let \(y\) be the number of Jink hockey sticks that are produced each month. Each month, up to 500 hockey sticks in total can be produced. The inequalities below represent constraints on the number of each hockey stick that can be produced each month.
| Constraint 1 | \(x \ge 0\) | Constraint 2 | \(y \ge 0\) |
| Constraint 3 | \(x + y \le 500\) | Constraint 4 | \(y \le 2x\) |
a. Interpret Constraint 4 in terms of the number of Flick hockey sticks and the number of Jink hockey sticks produced each month. 1 mark
There is another constraint, Constraint 5, on the number of each hockey stick that can be produced each month. Constraint 5 is bounded by Line A, shown on the graph below.
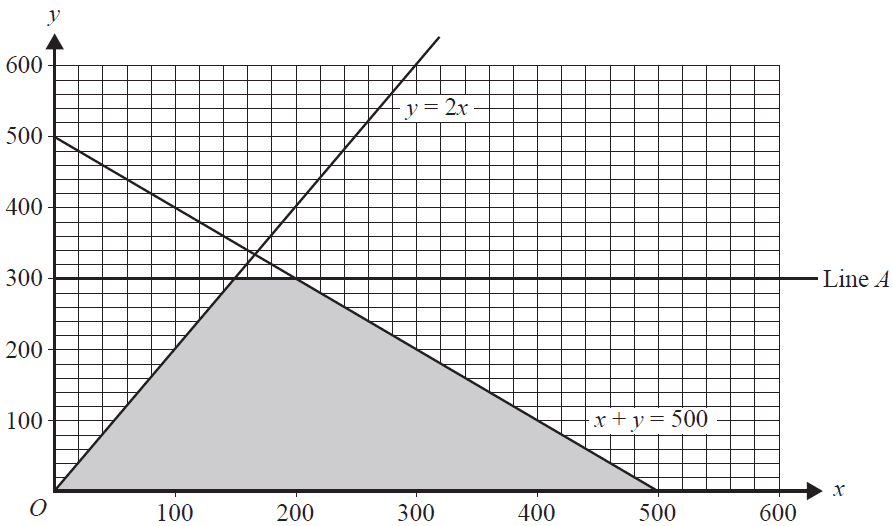
The shaded region of the graph contains the points that satisfy constraints 1 to 5.
b. Write down the inequality that represents Constraint 5. 1 mark
The profit, \(P\), that the company makes from the sale of the hockey sticks is given by
\(P = 62x + 86y\)
c. Find the maximum profit that the company can make from the sale of the hockey sticks. 1 mark
d. The company wants to change the selling price of the Flick and Jink hockey sticks in order to increase its maximum profit to $42000. All of the constraints on the numbers of Flick and Jink hockey sticks that can be produced each month remain the same. The profit, \(Q\), that is made from the sale of hockey sticks is now given by
\(Q = mx + ny\)
The profit made on the Flick hockey sticks is \(m\) dollars per hockey stick. The profit made on the Jink hockey sticks is \(n\) dollars per hockey stick. The maximum profit of $42000 is made by selling 400 Flick hockey sticks and 100 Jink hockey sticks. What are the values of \(m\) and \(n\)? 2 marks
End of Multiple-Choice Question Book
VCE is a registered trademark of the VCAA. The VCAA does not endorse or make any warranties regarding this study resource. Past VCE exams and related content can be accessed directly at www.vcaa.vic.edu.au
