2016 VCE Further Maths Exam 1
This is the full VCE Further Maths Exam with worked solutions. You can also try Mini-Tests, which are official VCAA exams split into short tests you can do anytime.
Number of marks: 40
Reading time: 15 minutes
Writing time: 1.5 hours
Instructions
• Answer all questions in pencil on your Multiple-Choice Answer Sheet.
• Choose the response that is correct for the question.
• A correct answer scores 1; an incorrect answer scores 0.
• Marks will not be deducted for incorrect answers.
• No marks will be given if more than one answer is completed for any question.
• Unless otherwise indicated, the diagrams in this book are not drawn to scale.
SECTION A – Core
Data analysis
Use the following information to answer Questions 1 and 2.
The blood pressure (low, normal, high) and the age (under 50 years, 50 years or over) of 110 adults were recorded. The results are displayed in the two-way frequency table below.
| Age | ||
|---|---|---|
| Blood pressure | Under 50 years | 50 years or over |
| low | 15 | 5 |
| normal | 32 | 24 |
| high | 11 | 23 |
| Total | 58 | 52 |
The percentage of adults under 50 years of age who have high blood pressure is closest to
- A. 11%
- B. 19%
- C. 26%
- D. 44%
- E. 58%
The variables blood pressure (low, normal, high) and age (under 50 years, 50 years or over) are
- A. both nominal variables.
- B. both ordinal variables.
- C. a nominal variable and an ordinal variable respectively.
- D. an ordinal variable and a nominal variable respectively.
- E. a continuous variable and an ordinal variable respectively.
The stem plot below displays 30 temperatures recorded at a weather station.
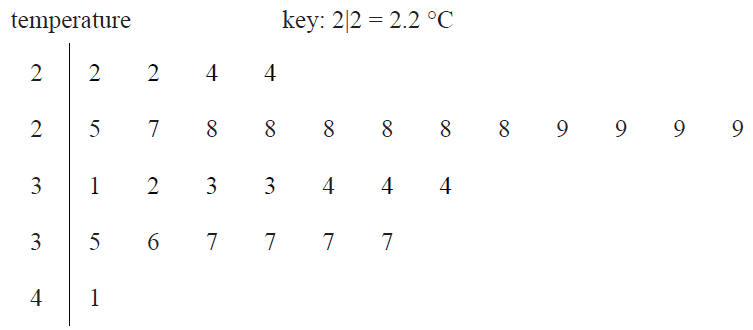
The modal temperature is
- A. 2.8 °C
- B. 2.9 °C
- C. 3.7 °C
- D. 8.0 °C
- E. 9.0 °C
Use the following information to answer Questions 4 and 5.
The weights of male players in a basketball competition are approximately normally distributed with a mean of 78.6 kg and a standard deviation of 9.3 kg.
Question 4There are 456 male players in the competition.
The expected number of male players in the competition with weights above 60 kg is closest to
- A. 3
- B. 11
- C. 23
- D. 433
- E. 445
Brett and Sanjeeva both play in the basketball competition.
When the weights of all players in the competition are considered, Brett has a standardised weight of \(z = -0.96\) and Sanjeeva has a standardised weight of \(z = -0.26\)
Which one of the following statements is not true?
- A. Brett and Sanjeeva are both below the mean weight for players in the basketball competition.
- B. Sanjeeva weighs more than Brett.
- C. If Sanjeeva increases his weight by 2 kg, he would be above the mean weight for players in the basketball competition.
- D. Brett weighs more than 68 kg.
- E. More than 50% of the players in the basketball competition weigh more than Sanjeeva.
The histogram below shows the distribution of the number of billionaires per million people for 53 countries.
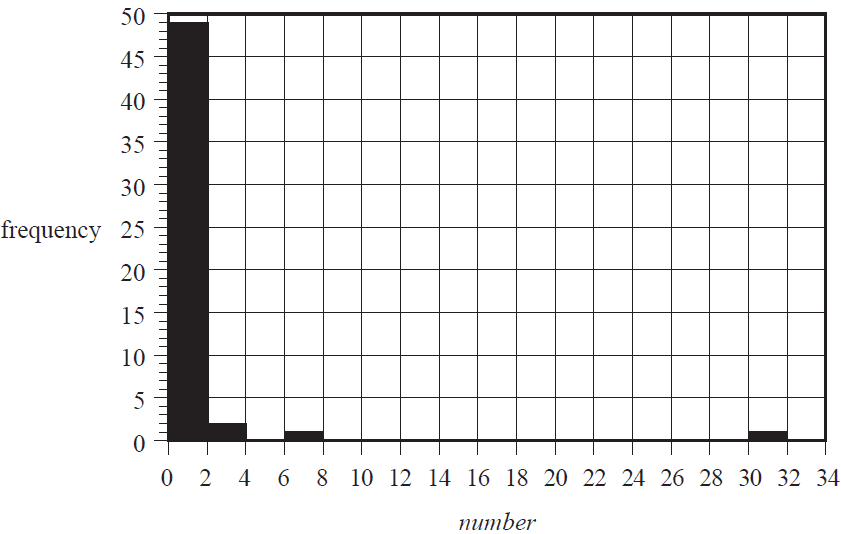
Using this histogram, the percentage of these 53 countries with less than two billionaires per million people is closest to
- A. 49%
- B. 53%
- C. 89%
- D. 92%
- E. 98%
The histogram below shows the distribution of the number of billionaires per million people for the same 53 countries as in Question 6, but this time plotted on a log10 scale.
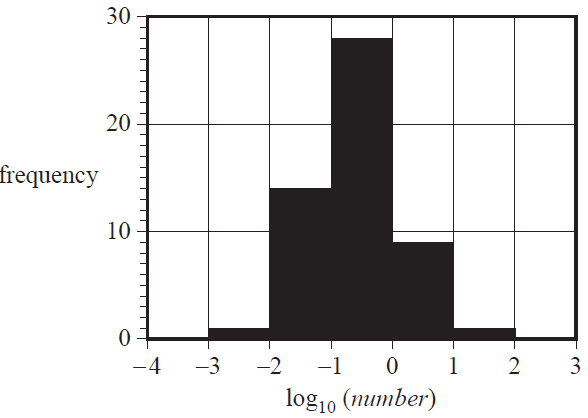
Based on this histogram, the number of countries with one or more billionaires per million people is
- A. 1
- B. 3
- C. 8
- D. 9
- E. 10
Parallel boxplots would be an appropriate graphical tool to investigate the association between the monthly median rainfall, in millimetres, and the
- A. monthly median wind speed, in kilometres per hour.
- B. monthly median temperature, in degrees Celsius.
- C. month of the year (January, February, March, etc.).
- D. monthly sunshine time, in hours.
- E. annual rainfall, in millimetres.
Use the following information to answer Questions 9 and 10.
The scatterplot below shows life expectancy in years (life expectancy) plotted against the Human Development Index (HDI) for a large number of countries in 2011.
A least squares line has been fitted to the data and the resulting residual plot is also shown.
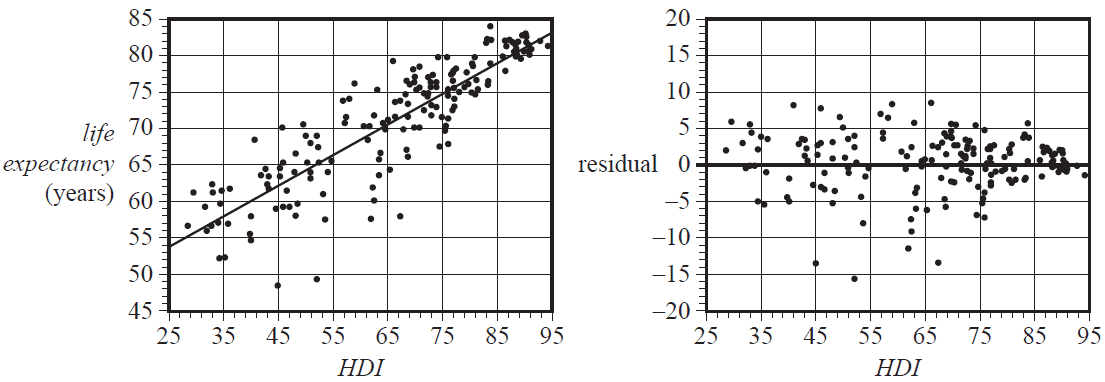
The equation of this least squares line is
life expectancy = 43.0 + 0.422 × HDI
The coefficient of determination is \(r^2 = 0.875\)
Given the information above, which one of the following statements is not true?
- A. The value of the correlation coefficient is close to 0.94
- B. 12.5% of the variation in life expectancy is not explained by the variation in the Human Development Index.
- C. On average, life expectancy increases by 43.0 years for each 10-point increase in the Human Development Index.
- D. Ignoring any outliers, the association between life expectancy and the Human Development Index can be described as strong, positive and linear.
- E. Using the least squares line to predict the life expectancy in a country with a Human Development Index of 75 is an example of interpolation.
In 2011, life expectancy in Australia was 81.8 years and the Human Development Index was 92.9
When the least squares line is used to predict life expectancy in Australia, the residual is closest to
- A. –0.6
- B. –0.4
- C. 0.4
- D. 11.1
- E. 42.6
The table below gives the Human Development Index (HDI) and the mean number of children per woman (children) for 14 countries in 2007.
A scatterplot of the data is also shown.
| HDI | Children |
|---|---|
| 27.3 | 7.6 |
| 31.3 | 6.1 |
| 39.5 | 4.9 |
| 41.6 | 3.9 |
| 44.0 | 3.8 |
| 50.8 | 4.3 |
| 52.3 | 2.7 |
| 62.5 | 3.0 |
| 69.1 | 2.4 |
| 74.6 | 2.1 |
| 78.9 | 1.9 |
| 85.6 | 1.8 |
| 92.0 | 1.9 |
| 83.4 | 1.6 |
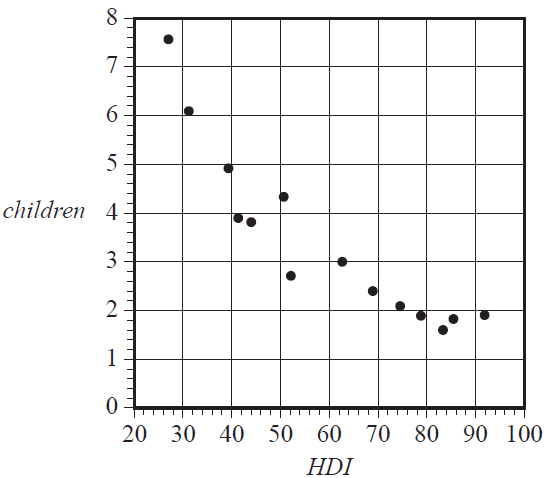
The scatterplot is non-linear.
A log transformation applied to the variable children can be used to linearise the scatterplot.
With HDI as the explanatory variable, the equation of the least squares line fitted to the linearised data is closest to
- A. log(children) = 1.1 – 0.0095 × HDI
- B. children = 1.1 – 0.0095 × log(HDI)
- C. log(children) = 8.0 – 0.77 × HDI
- D. children = 8.0 – 0.77 × log(HDI)
- E. log(children) = 21 – 10 × HDI
There is a strong positive association between a country’s Human Development Index and its carbon dioxide emissions.
From this information, it can be concluded that
- A. increasing a country’s carbon dioxide emissions will increase the Human Development Index of the country.
- B. decreasing a country’s carbon dioxide emissions will increase the Human Development Index of the country.
- C. this association must be a chance occurrence and can be safely ignored.
- D. countries that have higher human development indices tend to have higher levels of carbon dioxide emissions.
- E. countries that have higher human development indices tend to have lower levels of carbon dioxide emissions.
Consider the time series plot below.
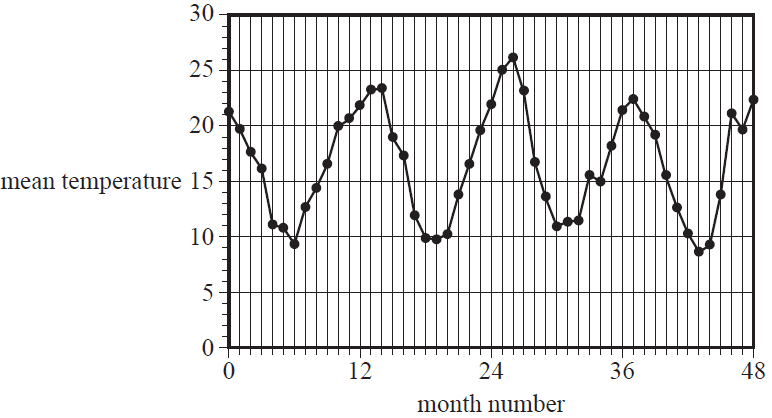
The pattern in the time series plot shown above is best described as having
- A. irregular fluctuations only.
- B. an increasing trend with irregular fluctuations.
- C. seasonality with irregular fluctuations.
- D. seasonality with an increasing trend and irregular fluctuations.
- E. seasonality with a decreasing trend and irregular fluctuations.
Use the following information to answer Questions 14–16.
The table below shows the long-term average of the number of meals served each day at a restaurant. Also shown is the daily seasonal index for Monday through to Friday.
| Day of the week | |||||||
|---|---|---|---|---|---|---|---|
| Monday | Tuesday | Wednesday | Thursday | Friday | Saturday | Sunday | |
| Long-term average | 89 | 93 | 110 | 132 | 145 | 190 | 160 |
| Seasonal index | 0.68 | 0.71 | 0.84 | 1.01 | 1.10 | ||
The seasonal index for Wednesday is 0.84
This tells us that, on average, the number of meals served on a Wednesday is
- A. 16% less than the daily average.
- B. 84% less than the daily average.
- C. the same as the daily average.
- D. 16% more than the daily average.
- E. 84% more than the daily average.
Last Tuesday, 108 meals were served in the restaurant.
The deseasonalised number of meals served last Tuesday was closest to
- A. 93
- B. 100
- C. 110
- D. 131
- E. 152
The seasonal index for Saturday is closest to
- A. 1.22
- B. 1.31
- C. 1.38
- D. 1.45
- E. 1.49
Recursion and financial modelling
Question 17Consider the recurrence relation below.
\(A_0 = 2, \quad A_{n+1} = 3A_n + 1\)
The first four terms of this recurrence relation are
- A. 0, 2, 7, 22 ...
- B. 1, 2, 7, 22 ...
- C. 2, 5, 16, 49 ...
- D. 2, 7, 18, 54 ...
- E. 2, 7, 22, 67 ...
The value of an annuity, \(V_n\), after \(n\) monthly payments of $555 have been made, can be determined using the recurrence relation
\(V_0 = 100\,000, \quad V_{n+1} = 1.0025 V_n - 555\)
The value of the annuity after five payments have been made is closest to
- A. $97 225
- B. $98 158
- C. $98 467
- D. $98 775
- E. $110 224
The purchase price of a car was $26 000.
Using the reducing balance method, the value of the car is depreciated by 8% each year.
A recurrence relation that can be used to determine the value of the car after \(n\) years, \(C_n\), is
- A. \(C_0 = 26\,000, \quad C_{n+1} = 0.92 C_n\)
- B. \(C_0 = 26\,000, \quad C_{n+1} = 1.08 C_n\)
- C. \(C_0 = 26\,000, \quad C_{n+1} = C_n + 8\)
- D. \(C_0 = 26\,000, \quad C_{n+1} = C_n - 8\)
- E. \(C_0 = 26\,000, \quad C_{n+1} = 0.92 C_n - 8\)
Consider the recurrence relation below.
\(V_0 = 10\,000, \quad V_{n+1} = 1.04 V_n + 500\)
This recurrence relation could be used to model
- A. a reducing balance depreciation of an asset initially valued at $10 000.
- B. a reducing balance loan with periodic repayments of $500.
- C. a perpetuity with periodic payments of $500 from the annuity.
- D. an annuity investment with periodic additions of $500 made to the investment.
- E. an interest-only loan of $10 000.
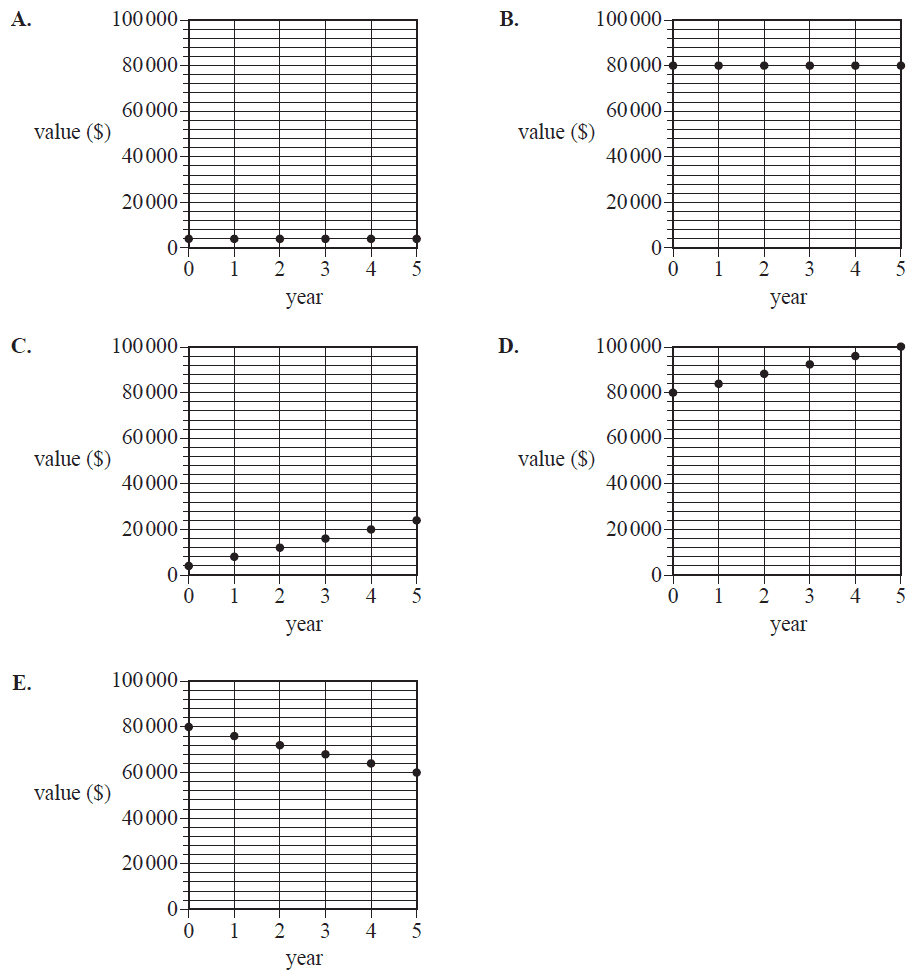
Juanita invests $80 000 in a perpetuity that will provide $4000 per year to fund a scholarship at a university.
The graph that shows the value of this perpetuity over a period of five years is
The first three lines of an amortisation table for a reducing balance home loan are shown below.
The interest rate for this home loan is 4.8% per annum compounding monthly.
The loan is to be repaid with monthly payments of $1500.
| Payment number | Payment | Interest | Principal reduction | Balance of loan |
|---|---|---|---|---|
| 0 | 0 | 0.00 | 0.00 | 250 000.00 |
| 1 | 1500 | 1000.00 | 500.00 | 249 500.00 |
| 2 | 1500 |
The amount of payment number 2 that goes towards reducing the principal of the loan is
- A. $486
- B. $502
- C. $504
- D. $996
- E. $998
Sarah invests $5000 in a savings account that pays interest at the rate of 3.9% per annum compounding quarterly. At the end of each quarter, immediately after the interest has been paid, she adds $200 to her investment.
After two years, the value of her investment will be closest to
- A. $5805
- B. $6600
- C. $7004
- D. $7059
- E. $9285
Mai invests in an annuity that earns interest at the rate of 5.2% per annum compounding monthly.
Monthly payments are received from the annuity.
The balance of the annuity will be $130 784.93 after five years.
The balance of the annuity will be $66 992.27 after 10 years.
The monthly payment that Mai receives from the annuity is closest to
- A. $1270
- B. $1400
- C. $1500
- D. $2480
- E. $3460
SECTION B – Modules
Module 1 – Matrices
Question 1The transpose of \(\begin{bmatrix} 2 & 7 & 10 \\ 13 & 19 & 8 \end{bmatrix}\) is
- A. \(\begin{bmatrix} 13 & 19 & 8 \\ 2 & 7 & 10 \end{bmatrix}\)
- B. \(\begin{bmatrix} 10 & 7 & 2 \\ 8 & 19 & 13 \end{bmatrix}\)
- C. \(\begin{bmatrix} 2 & 13 \\ 7 & 19 \\ 10 & 8 \end{bmatrix}\)
- D. \(\begin{bmatrix} 13 & 2 \\ 19 & 7 \\ 8 & 10 \end{bmatrix}\)
- E. \(\begin{bmatrix} 8 & 10 \\ 19 & 7 \\ 13 & 2 \end{bmatrix}\)
The matrix product \(\begin{bmatrix} 0 & 0 & 0 & 1 & 0 \\ 0 & 0 & 1 & 0 & 0 \\ 1 & 0 & 0 & 0 & 0 \\ 0 & 1 & 0 & 0 & 0 \\ 0 & 0 & 0 & 0 & 1 \end{bmatrix} \times \begin{bmatrix} L \\ E \\ A \\ P \\ S \end{bmatrix}\) is equal to
- A. \(\begin{bmatrix} L \\ A \\ P \\ S \\ E \end{bmatrix}\)
- B. \(\begin{bmatrix} L \\ E \\ A \\ P \\ S \end{bmatrix}\)
- C. \(\begin{bmatrix} P \\ L \\ E \\ A \\ S \end{bmatrix}\)
- D. \(\begin{bmatrix} P \\ A \\ L \\ E \\ S \end{bmatrix}\)
- E. \(\begin{bmatrix} P \\ E \\ A \\ L \\ S \end{bmatrix}\)
The matrix equation below represents a pair of simultaneous linear equations.
\(\begin{bmatrix} 12 & 9 \\ m & 3 \end{bmatrix} \begin{bmatrix} x \\ y \end{bmatrix} = \begin{bmatrix} 6 \\ 6 \end{bmatrix}\)
These simultaneous linear equations have no unique solution when \(m\) is equal to
- A. –4
- B. –3
- C. 0
- D. 3
- E. 4
The table below shows the number of each type of coin saved in a moneybox.
| Coin | 5 cent | 10 cent | 20 cent | 50 cent |
|---|---|---|---|---|
| Number | 15 | 32 | 48 | 24 |
The matrix product that displays the total number of coins and the total value of these coins is
- A. \([5 \quad 10 \quad 20 \quad 50] \begin{bmatrix} 15 \\ 32 \\ 48 \\ 24 \end{bmatrix}\)
- B. \([15 \quad 32 \quad 48 \quad 24] \begin{bmatrix} 1 & 5 \\ 1 & 10 \\ 1 & 20 \\ 1 & 50 \end{bmatrix}\)
- C. \([5 \quad 10 \quad 20 \quad 50] \begin{bmatrix} 1 & 15 \\ 1 & 32 \\ 1 & 48 \\ 1 & 24 \end{bmatrix}\)
- D. \([15 \quad 32 \quad 48 \quad 24] \begin{bmatrix} 5 \\ 10 \\ 20 \\ 50 \end{bmatrix}\)
- E. \(\begin{bmatrix} 5 & 10 & 20 & 50 \\ 15 & 32 & 48 & 24 \end{bmatrix} \begin{bmatrix} 1 \\ 1 \\ 1 \\ 1 \end{bmatrix}\)
Let \(M = \begin{bmatrix} 1 & 2 & 3 & 4 \\ 3 & 4 & 5 & 6 \end{bmatrix}\)
The element in row \(i\) and column \(j\) of \(M\) is \(m_{ij}\).
The elements of \(M\) are determined by the rule
- A. \(m_{ij} = i + j - 1\)
- B. \(m_{ij} = 2i - j + 1\)
- C. \(m_{ij} = 2i + j - 2\)
- D. \(m_{ij} = i + 2j - 2\)
- E. \(m_{ij} = i + j + 1\)
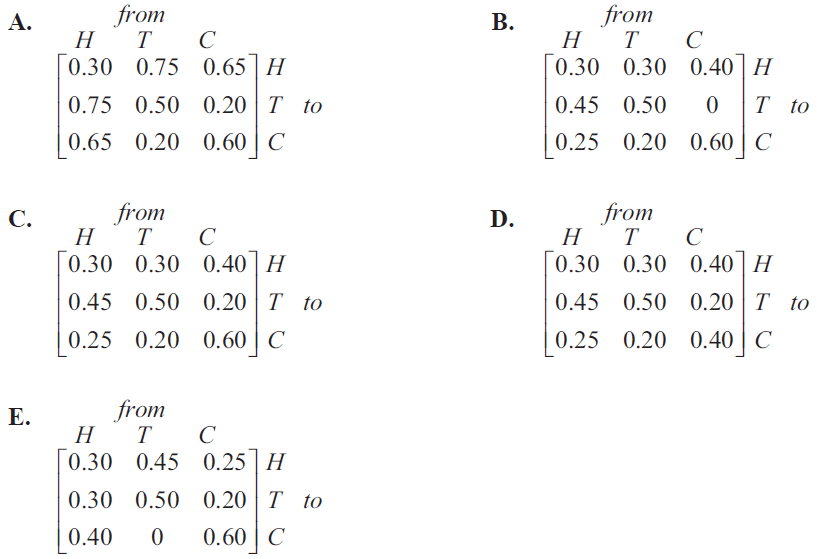
Families in a country town were asked about their annual holidays.
Every year, these families choose between staying at home (\(H\)), travelling (\(T\)) and camping (\(C\)).
The transition diagram below shows the way families in the town change their holiday preferences from year to year.
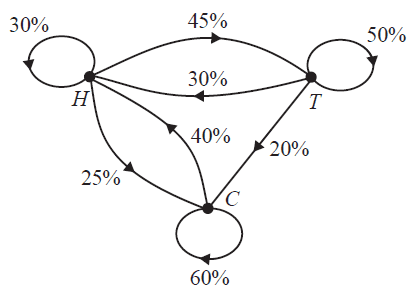
A transition matrix that provides the same information as the transition diagram is
Each week, the 300 students at a primary school choose art (\(A\)), music (\(M\)) or sport (\(S\)) as an afternoon activity.
The transition matrix below shows how the students’ choices change from week to week.
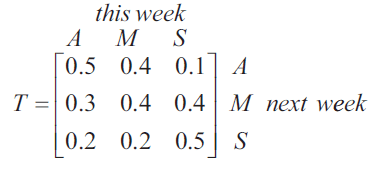
Based on the information above, it can be concluded that, in the long term
- A. no student will choose sport.
- B. all students will choose to stay in the same activity each week.
- C. all students will have chosen to change their activity at least once.
- D. more students will choose to do music than sport.
- E. the number of students choosing to do art and music will be the same.
The matrix below shows the result of each match between four teams, \(A, B, C\) and \(D\), in a bowling tournament. Each team played each other team once and there were no draws.
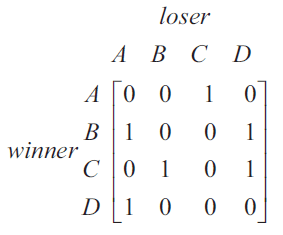
In this tournament, each team was given a ranking that was determined by calculating the sum of its one-step and two-step dominances. The team with the highest sum was ranked number one (1). The team with the second-highest sum was ranked number two (2), and so on.
Using this method, team \(C\) was ranked number one (1).
Team \(A\) would have been ranked number one (1) if the winner of one match had lost instead.
That match was between teams
- A. \(A\) and \(B\).
- B. \(A\) and \(D\).
- C. \(B\) and \(C\).
- D. \(B\) and \(D\).
- E. \(C\) and \(D\).
Module 2 – Networks and decision mathematics
Question 1Lee, Mandy, Nola, Oscar and Pieter are each to be allocated one particular task at work.
The bipartite graph below shows which task(s), 1–5, each person is able to complete.
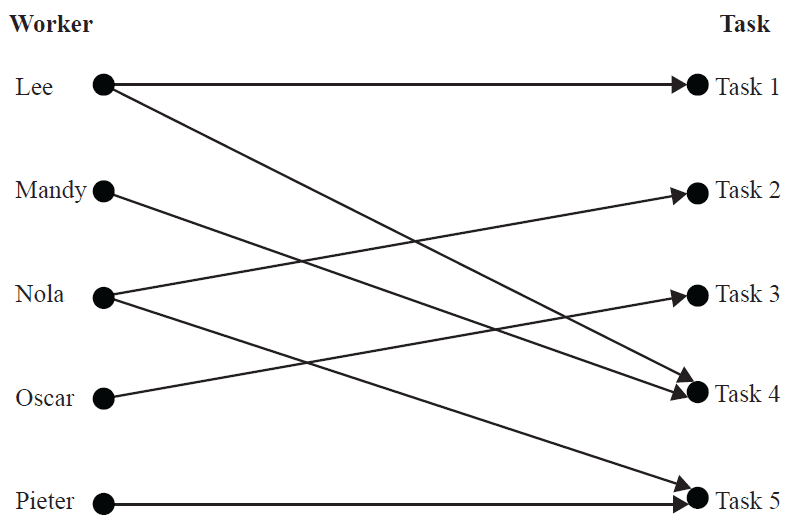
Each person completes a different task.
Task 4 must be completed by
- A. Lee.
- B. Mandy.
- C. Nola.
- D. Oscar.
- E. Pieter.
The following directed graph shows the flow of water, in litres per minute, in a system of pipes connecting the source to the sink.
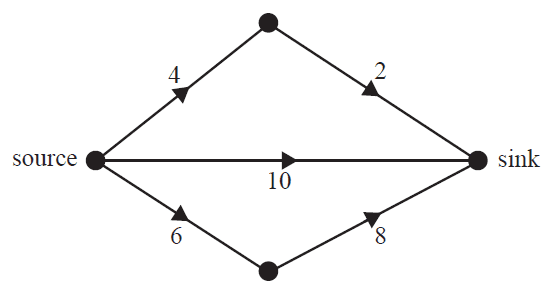
The maximum flow, in litres per minute, from the source to the sink is
- A. 10
- B. 14
- C. 18
- D. 20
- E. 22
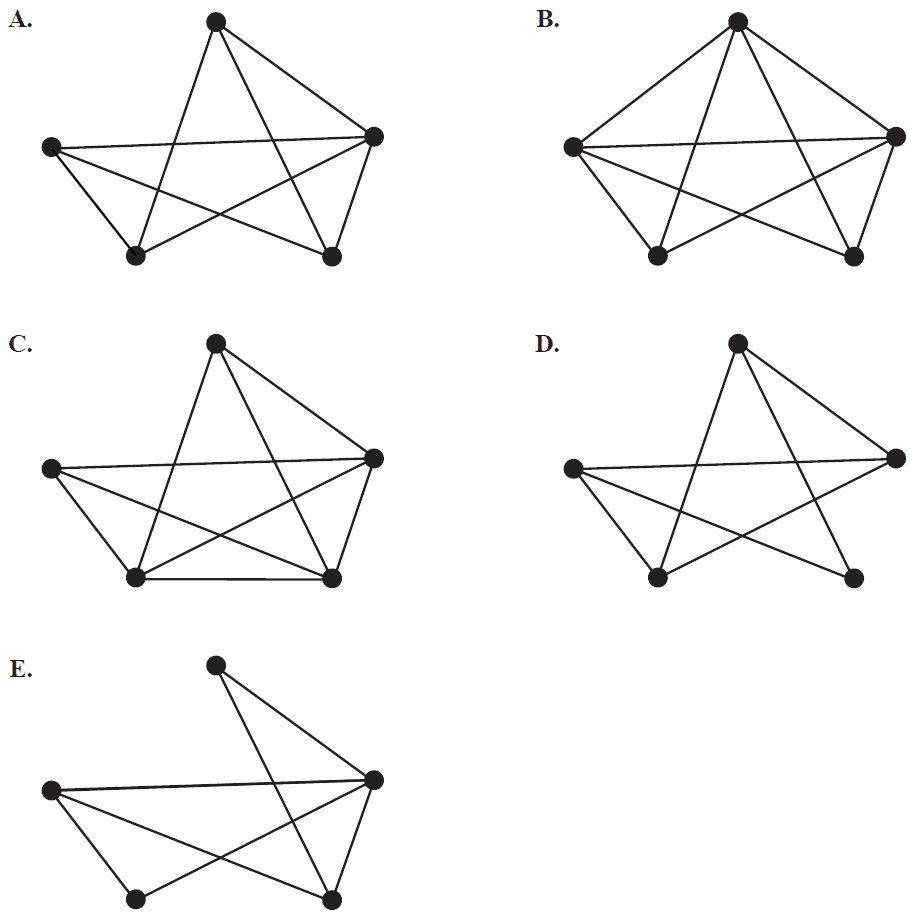
The following graph with five vertices is a complete graph.
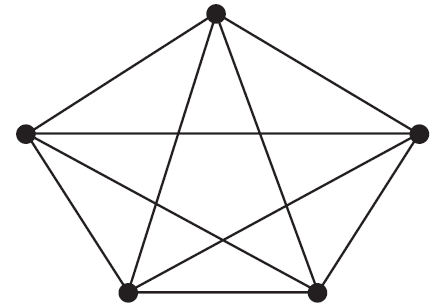
Edges are removed so that the graph will have the minimum number of edges to remain connected.
The number of edges that are removed is
- A. 4
- B. 5
- C. 6
- D. 9
- E. 10
The minimum spanning tree for the network below includes the edge with weight labelled \(k\).
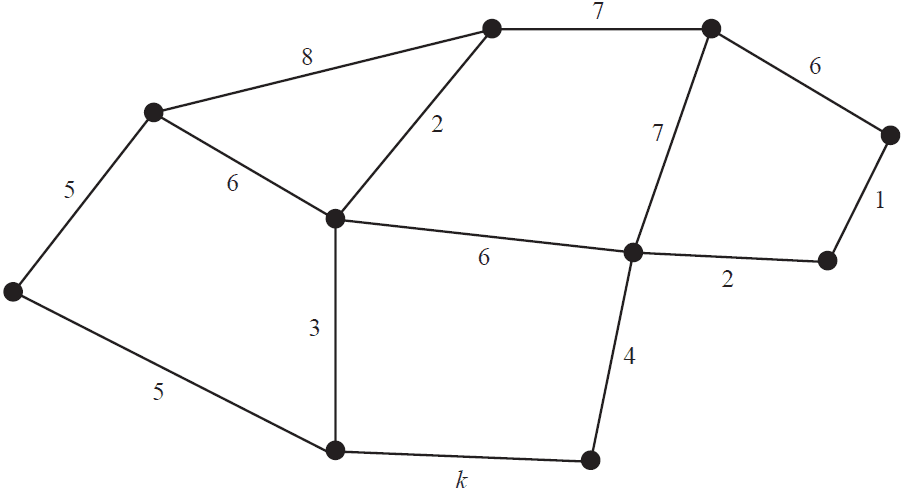
The total weight of all edges for the minimum spanning tree is 33.
The value of \(k\) is
- A. 1
- B. 2
- C. 3
- D. 4
- E. 5
Consider the planar graph below.
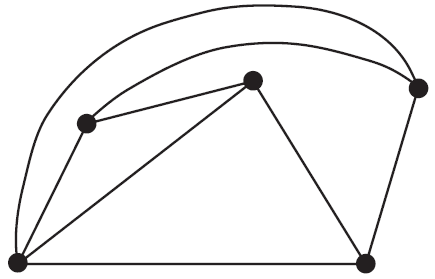
Which one of the following graphs can be redrawn as the planar graph above?
Use the following information to answer Questions 6 and 7.
The directed graph below shows the sequence of activities required to complete a project.
All times are in hours.
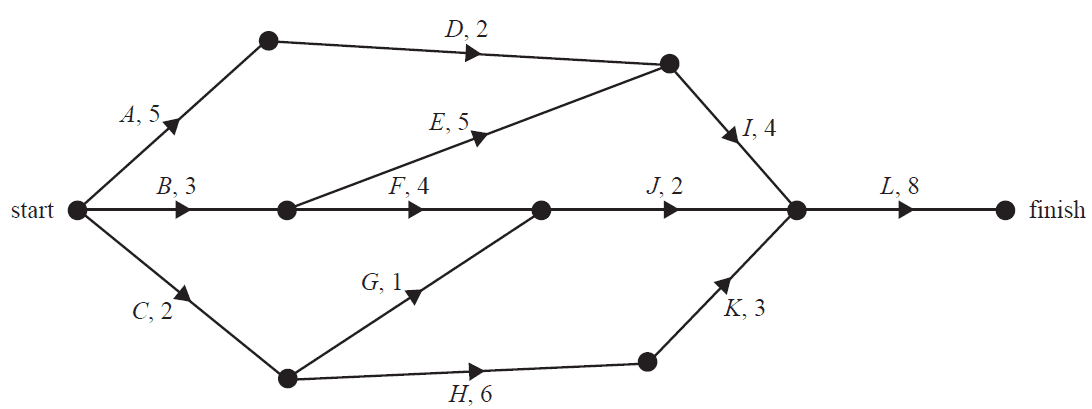
The number of activities that have exactly two immediate predecessors is
- A. 0
- B. 1
- C. 2
- D. 3
- E. 4
There is one critical path for this project.
Three critical paths would exist if the duration of activity
- A. \(I\) were reduced by two hours.
- B. \(E\) were reduced by one hour.
- C. \(G\) were increased by six hours.
- D. \(K\) were increased by two hours.
- E. \(F\) were increased by two hours.
Five children, Alan, Brianna, Chamath, Deidre and Ewen, are each to be assigned a different job by their teacher. The table below shows the time, in minutes, that each child would take to complete each of the five jobs.
| Alan | Brianna | Chamath | Deidre | Ewen | |
|---|---|---|---|---|---|
| Job 1 | 5 | 8 | 5 | 8 | 7 |
| Job 2 | 5 | 7 | 6 | 7 | 4 |
| Job 3 | 9 | 5 | 7 | 5 | 9 |
| Job 4 | 7 | 7 | 9 | 8 | 5 |
| Job 5 | 4 | 4 | 4 | 4 | 3 |
The teacher wants to allocate the jobs so as to minimise the total time taken to complete the five jobs.
In doing so, she finds that two allocations are possible.
If each child starts their allocated job at the same time, then the first child to finish could be either
- A. Alan or Brianna.
- B. Brianna or Deidre.
- C. Chamath or Deidre.
- D. Chamath or Ewen.
- E. Deidre or Ewen.
Module 3 – Geometry and measurement
Question 1Consider the diagram below.
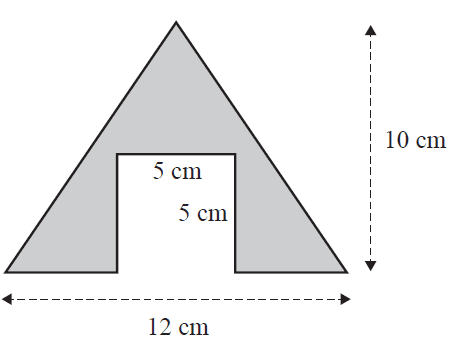
The shaded area, in square centimetres, is
- A. 35
- B. 45
- C. 60
- D. 85
- E. 95
Triangle \(ABC\) is similar to triangle \(DEF\).
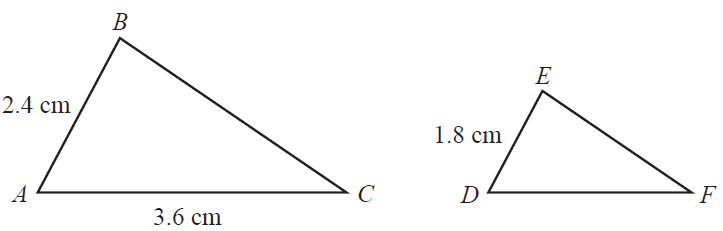
The length of \(DF\), in centimetres, is
- A. 0.9
- B. 1.2
- C. 1.8
- D. 2.7
- E. 3.6
The diagram above shows the position of three cities, \(A, B\) and \(C\).
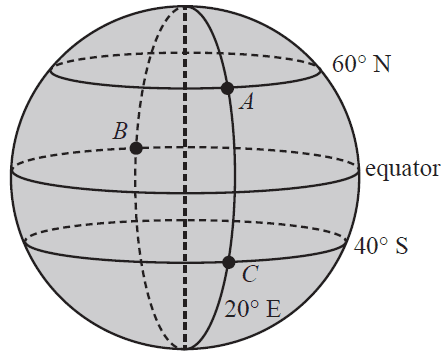
According to the diagram
- A. \(A\) is located on a longitude of 60° N
- B. \(B\) is located on a longitude of 20° E
- C. \(C\) is located on a longitude of 40° S
- D. \(A\) and \(B\) are located on the same line of longitude
- E. \(A\) and \(C\) are located on the same line of longitude
All towns in the state of Victoria are in the same time zone.
Mallacoota (38° S, 150° E) and Portland (38° S, 142° E) are two coastal towns in the state of Victoria.
On one day in January, the sun rose in Mallacoota at 6.03 am.
Assuming that 15° of longitude equates to a one-hour time difference, the time that the sun was expected to rise in Portland is
- A. 5.31 am.
- B. 5.55 am.
- C. 6.03 am.
- D. 6.11 am.
- E. 6.35 am.
A water tank in the shape of a cylinder with a hemispherical top is shown below.
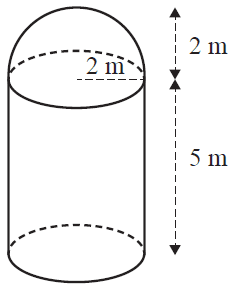
The volume of water that this tank can hold, in cubic metres, is closest to
- A. 80
- B. 88
- C. 96
- D. 105
- E. 121
Marcus is on the opposite side of a large lake from a horse and its stable. The stable is 150 m directly east of the horse. Marcus is on a bearing of 170° from the horse and on a bearing of 205° from the stable.
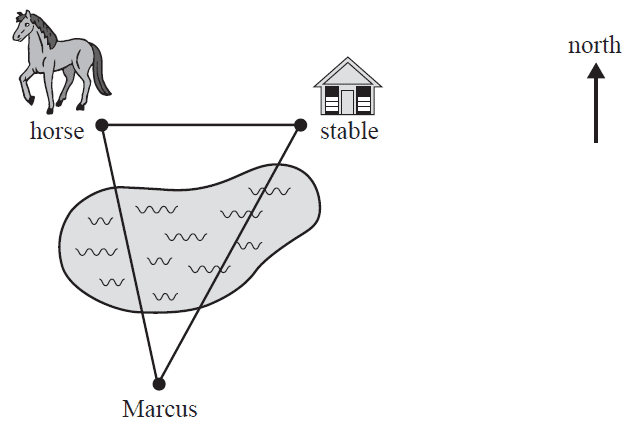
The straight-line distance, in metres, between Marcus and the horse is closest to
- A. 45
- B. 61
- C. 95
- D. 192
- E. 237
The diagram below shows a rectangular-based right pyramid, \(ABCDE\).
In this pyramid, \(AB = DC = 24\) cm, \(AD = BC = 10\) cm and \(AE = BE = CE = DE = 28\) cm.
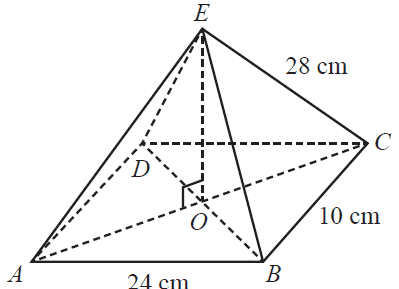
The height, \(OE\), of the pyramid, in centimetres, is closest to
- A. 10.4
- B. 13.0
- C. 24.8
- D. 25.3
- E. 30.9
A string of seven flags consisting of equilateral triangles in two sizes is hanging at the end of a racetrack, as shown in the diagram below.
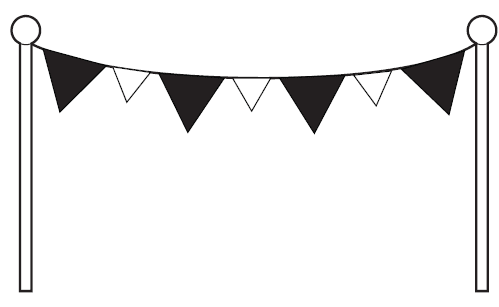
The edge length of each black flag is twice the edge length of each white flag.
For this string of seven flags, the total area of the black flags would be
- A. two times the total area of the white flags.
- B. four times the total area of the white flags.
- C. \(\frac{4}{3}\) times the total area of the white flags.
- D. \(\frac{16}{3}\) times the total area of the white flags.
- E. \(\frac{16}{9}\) times the total area of the white flags.
Module 4 – Graphs and relations
Question 1The graph below shows the temperature, in degrees Celsius, between 6 am and 6 pm on a given day.
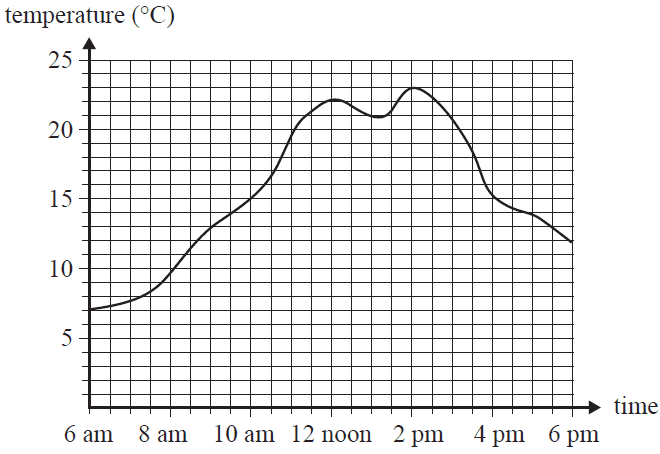
From 2 pm to 6 pm, the temperature decreased by
- A. 4 °C
- B. 11 °C
- C. 12 °C
- D. 15 °C
- E. 23 °C
A phone company charges a fixed, monthly line rental fee of $28 and $0.25 per call.
Let \(n\) be the number of calls that are made in a month.
Let \(C\) be the monthly phone bill, in dollars.
The equation for the relationship between the monthly phone bill, in dollars, and the number of calls is
- A. \(C = 28 + 0.25n\)
- B. \(C = 28n + 0.25\)
- C. \(C = n + 28.25\)
- D. \(C = 28(n + 0.25)\)
- E. \(C = 0.25(n + 28)\)
The graph below shows a straight line that passes through the points (6, 6) and (8, 9).
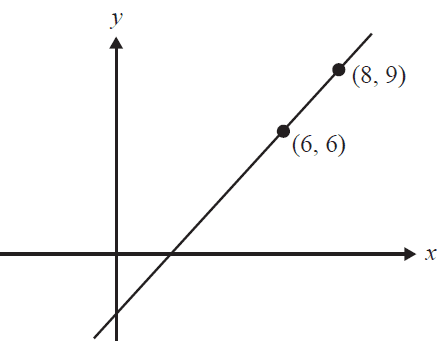
The coordinates of the point where the line crosses the x-axis are
- A. (–3, 0)
- B. (1, 0)
- C. (1.5, 0)
- D. (2, 0)
- E. (4, 0)
The point (3, –2) satisfies the inequality
- A. \(y \ge 0\)
- B. \(y \ge \frac{2}{3}x\)
- C. \(-2 < x < 3\)
- D. \(y < 5 - x\)
- E. \(y > x - 5\)
The feasible region for a linear programming problem is shaded in the diagram below.
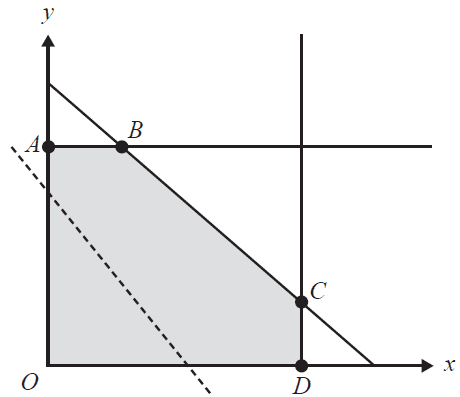
The equation of the objective function for this problem is of the form
\(P = ax + by\), where \(a > 0\) and \(b > 0\)
The dotted line in the diagram has the same slope as the objective function for this problem.
The maximum value of the objective function can be determined by calculating its value at
- A. point \(A\).
- B. point \(B\).
- C. point \(C\).
- D. point \(D\).
- E. any point along line segment \(BC\).
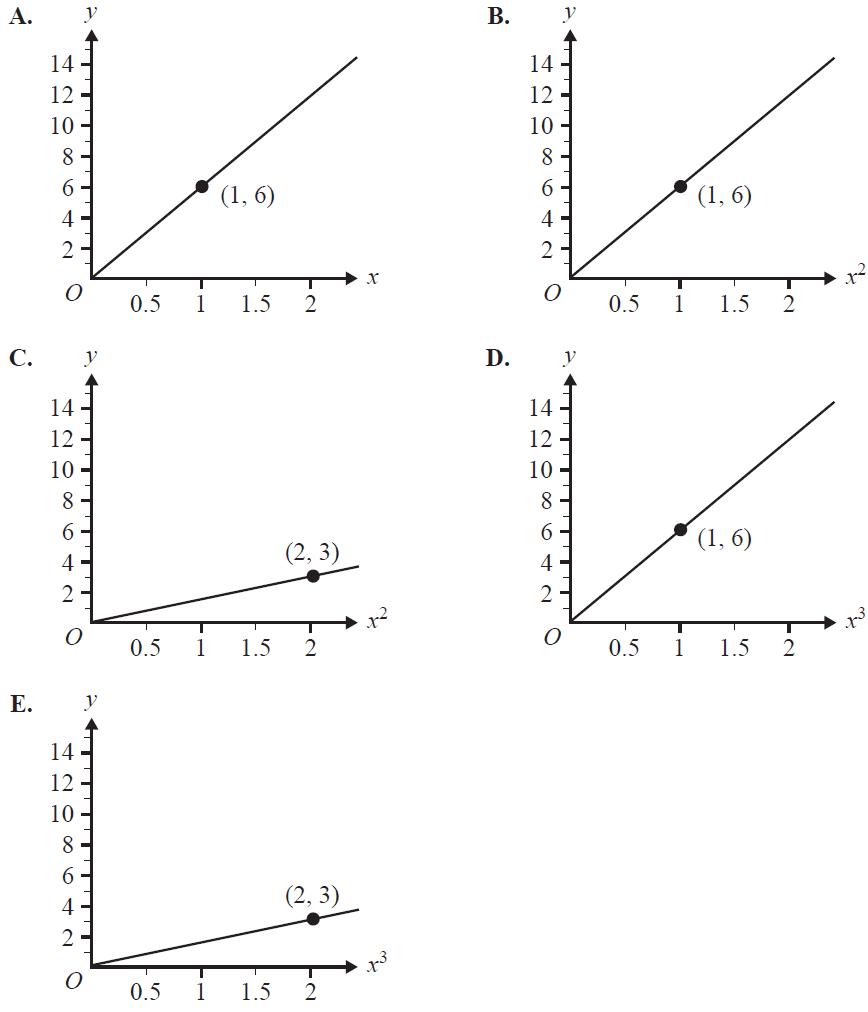
The point (2, 12) lies on the graph of \(y = kx^n\), as shown below.
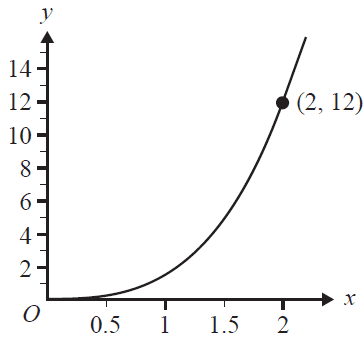
Another graph that represents this relationship between \(y\) and \(x\) could be
Simon grows cucumbers and zucchinis.
Let \(x\) be the number of cucumbers that are grown.
Let \(y\) be the number of zucchinis that are grown.
For every two cucumbers that are grown, Simon grows at least three zucchinis.
An inequality that represents this situation is
- A. \(y \ge \frac{x}{2} + 3\)
- B. \(y \ge \frac{x}{3} + 2\)
- C. \(y \le \frac{x}{3} + 2\)
- D. \(y \ge \frac{2x}{3}\)
- E. \(y \ge \frac{3x}{2}\)
Megan walks from her house to a shop that is 800 m away.
The equation for the relationship between the distance, in metres, that Megan is from her house \(t\) minutes after leaving is
\(\textit{distance} = \begin{cases} 100t & 0 \le t \le 6 \\ 600 & 6 < t \le a \\ kt & a < t \le 10 \end{cases}\)
If Megan reaches the shop 10 minutes after leaving her house, the value of \(a\) is
- A. 7.0
- B. 7.5
- C. 8.0
- D. 8.5
- E. 9.0
End of Multiple-Choice Question Book
VCE is a registered trademark of the VCAA. The VCAA does not endorse or make any warranties regarding this study resource. Past VCE exams and related content can be accessed directly at www.vcaa.vic.edu.au
