QCAA Maths Methods Paper 2 Statistics Mini Test 2
External Assessment Paper 2 — Technology-active
Number of marks: 9
Perusal time: 1 minute
Writing time: 15 minutes
Section 2
Instructions
• Write using black or blue pen.
• Questions worth more than one mark require mathematical reasoning and/or working to be shown to support answers.
• If you need more space for a response, use the additional pages at the back of this book.
– On the additional pages, write the question number you are responding to.
– Cancel any incorrect response by ruling a single diagonal line through your work.
– Write the page number of your alternative/additional response, i.e. See page …
– If you do not do this, your original response will be marked.
• This section has nine questions and is worth 45 marks.
At council meetings in a particular town, new proposals are only discussed if more than 80% of the community are in favour of the proposal.
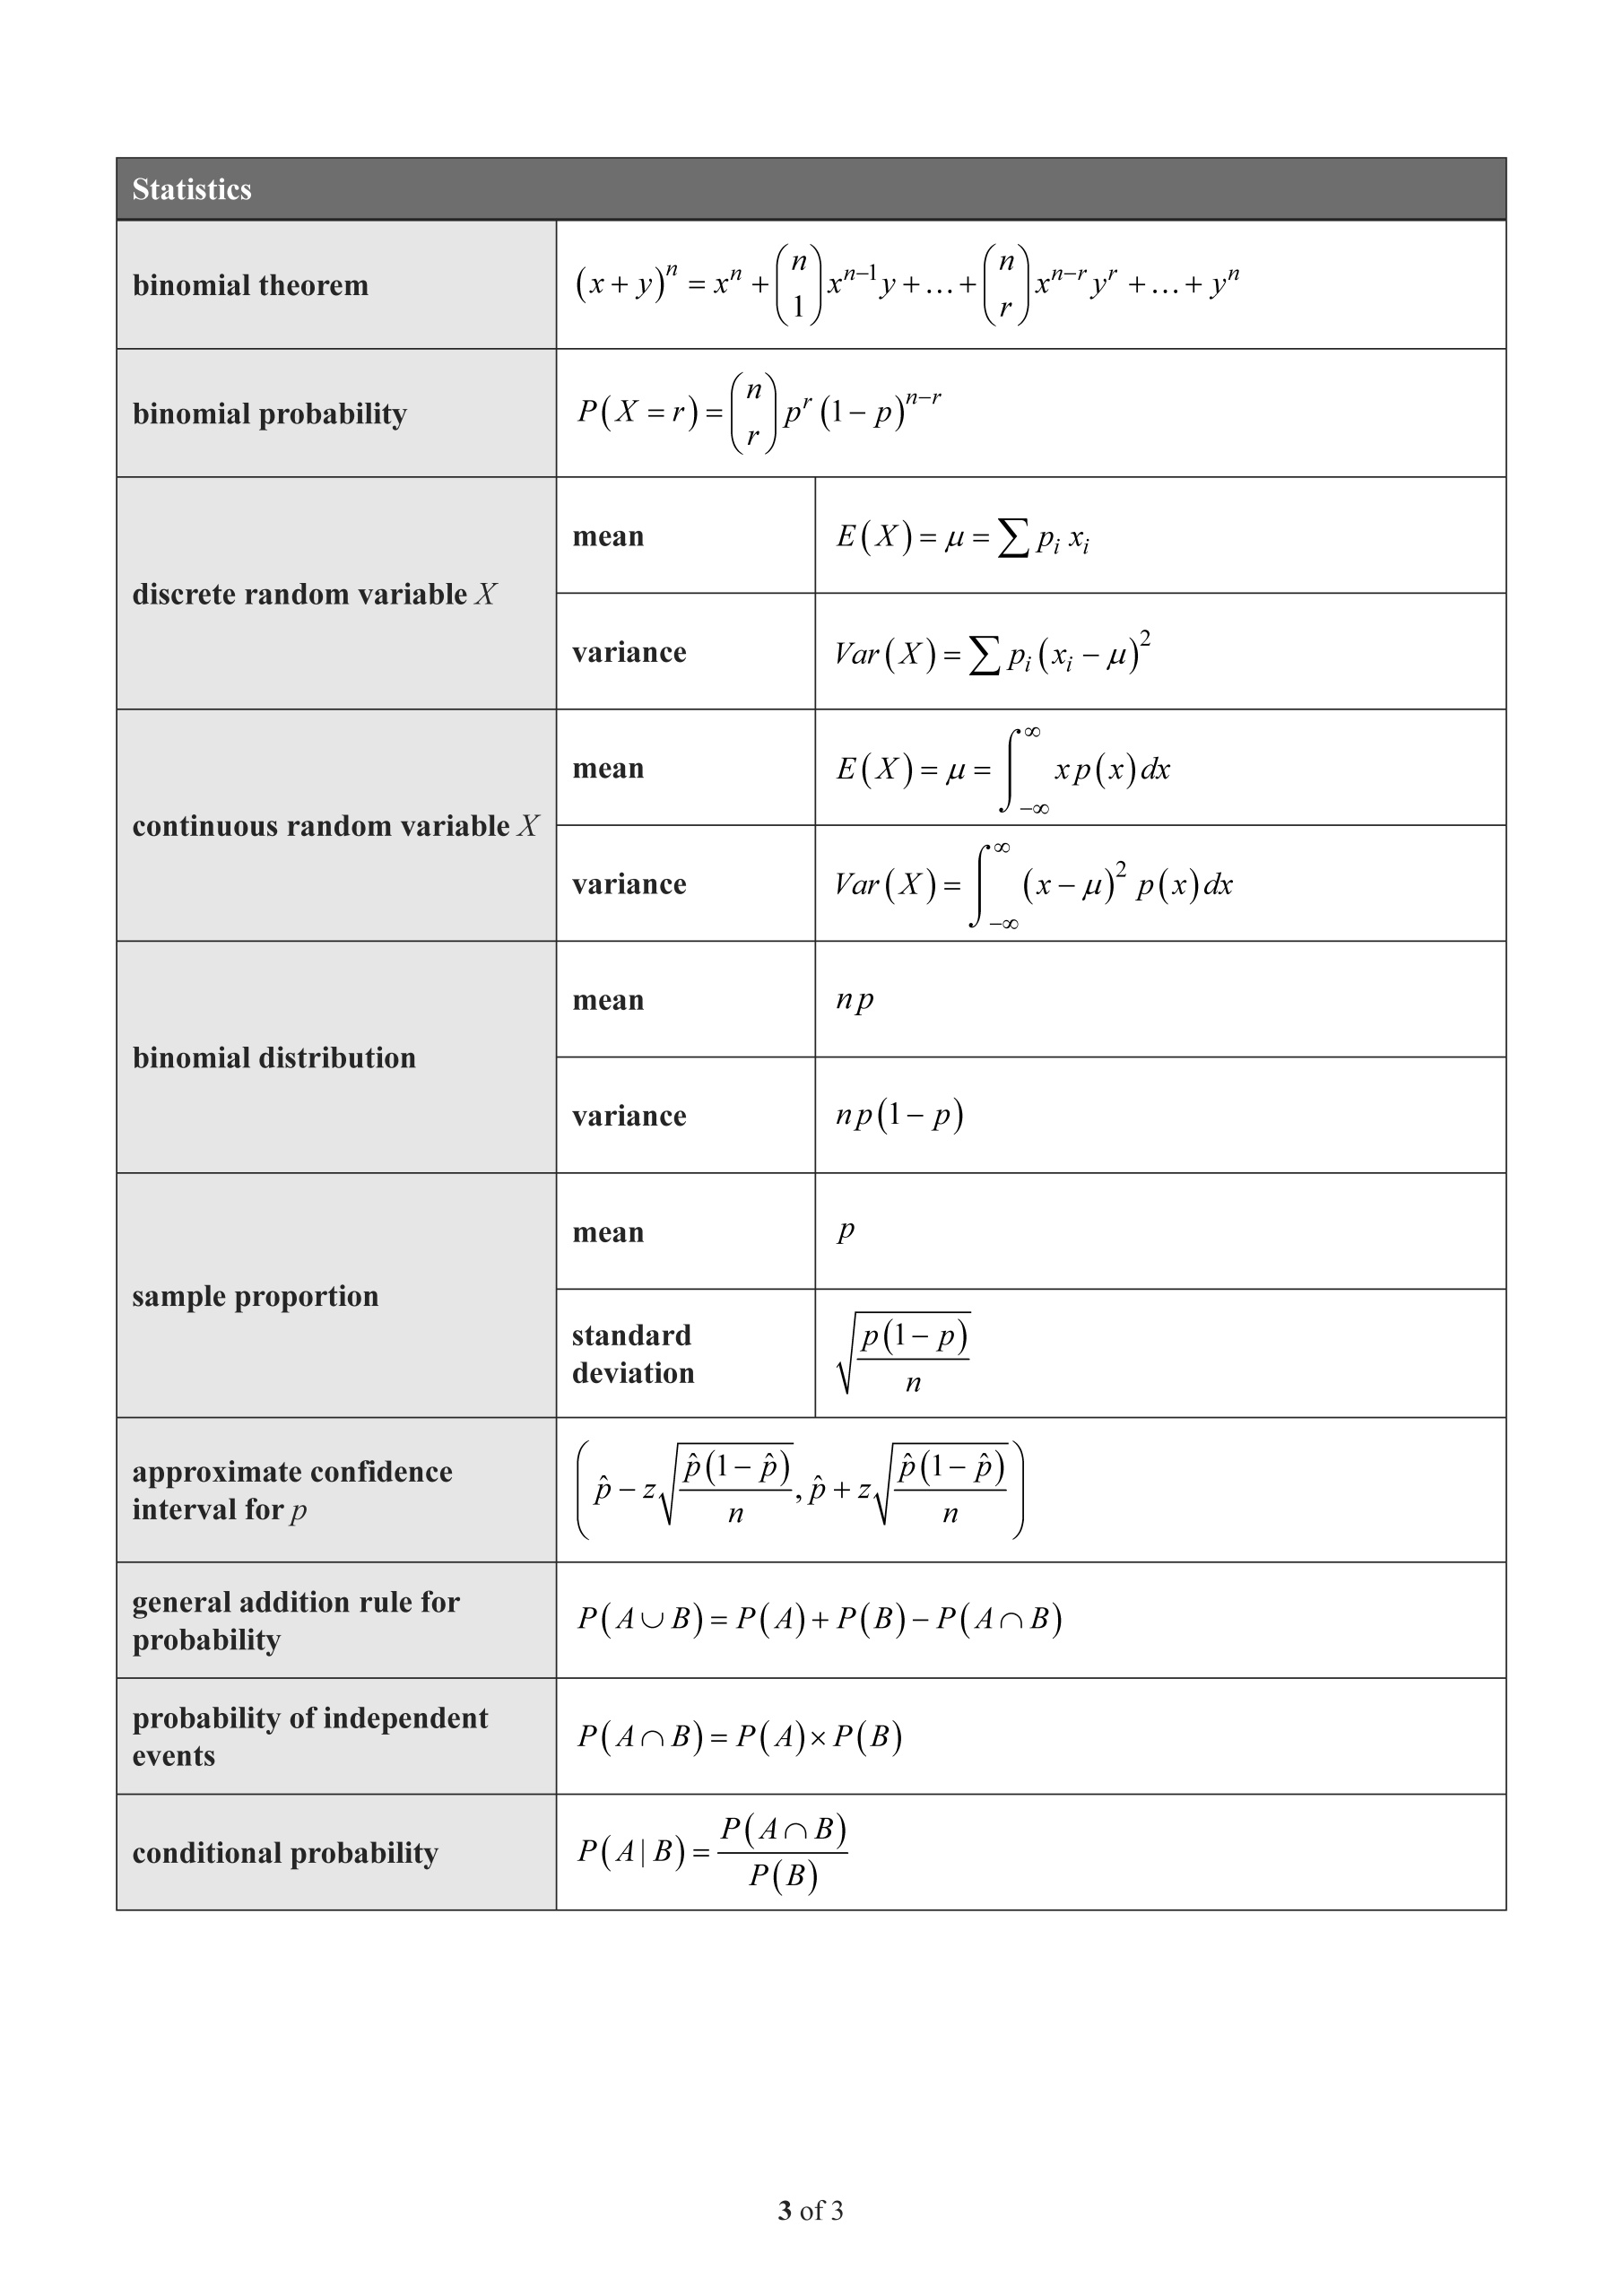
To discover community opinion on a new bus route proposal, the council conducted several surveys, each with a sample size of 120. The distribution of the sample proportions from the surveys had a standard deviation of 0.04.
Make a justified decision as to whether the new bus route proposal would be discussed at a council meeting.
Assuming the approximate normality of sample proportions (\(\hat{p}_1\) and \(\hat{p}_2\)) and based on two independent samples, the approximate confidence interval for the difference of two proportions is given by
\[ \left( \hat{p}_1 - \hat{p}_2 - z\sqrt{\frac{\hat{p}_1(1-\hat{p}_1)}{n_1} + \frac{\hat{p}_2(1-\hat{p}_2)}{n_2}}, \hat{p}_1 - \hat{p}_2 + z\sqrt{\frac{\hat{p}_1(1-\hat{p}_1)}{n_1} + \frac{\hat{p}_2(1-\hat{p}_2)}{n_2}} \right) \]If the approximate confidence interval for the difference between two proportions does not contain 0, this provides evidence that the two proportions are not equal.
The data in the table shows the observed frequencies of two drink preferences for independent samples of people who live in Town A and Town B.
| Town | Tea | Coffee | Total |
|---|---|---|---|
| A | 111 | 105 | 216 |
| B | 150 | 107 | 257 |
Using the approximate 99% confidence interval for the difference of two proportions, determine if there is evidence to conclude that drink preference is associated with the town where the person lives.
END OF PAPER


