QCAA Maths Methods Paper 1 Statistics Mini Test 1
External Assessment Paper 1 — Technology-free
Number of marks: 10
Perusal time: 1 minute
Writing time: 15 minutes
Section 1
Instructions
• This section has 10 questions and is worth 10 marks.
• Use a 2B pencil to fill in the A, B, C or D answer bubble completely.
• Choose the best answer for Questions 1 10.
• If you change your mind or make a mistake, use an eraser to remove your response and fill in the new answer bubble completely.
Twenty families are selected to participate in a lifestyle study related to family size. The number of children in these families is uniformly distributed as shown.
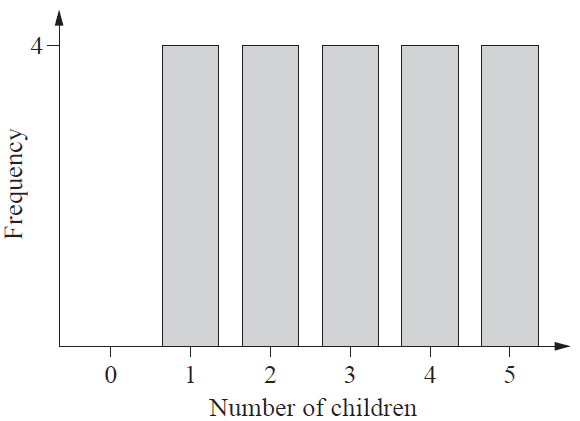
A random sample of five families is chosen from this group, without replacement. A possible mean number of children in the sample is
- (A) 5.0
- (B) 2.0
- (C) 1.0
- (D) 0.0
A sample of size \(n\) can be used to obtain a sample proportion \(\hat{p}\). An approximate margin of error for the population proportion can be obtained using the formula
\[E = z\sqrt{\frac{\hat{p}(1-\hat{p})}{n}}\]If the level of confidence is increased from 95% to 99%, then
- (A) the associated \(z\)-value would decrease, so \(E\) would increase.
- (B) the associated \(z\)-value would increase, so \(E\) would increase.
- (C) the associated \(z\)-value would decrease, so \(E\) would decrease.
- (D) the associated \(z\)-value would increase, so \(E\) would decrease.
A sample of size \(n\) was used to estimate a population proportion. An approximate margin of error of 3% was calculated using \(z = 1.96\). Given the sample proportion was 0.6, determine \(n\).
- (A) \(n = \frac{\left(\frac{0.03}{1.96}\right)^2}{0.24}\)
- (B) \(n = \frac{0.24}{\left(\frac{0.03}{1.96}\right)^2}\)
- (C) \(n = \frac{\left(\frac{0.03}{1.96}\right)^2}{2.4}\)
- (D) \(n = \frac{2.4}{\left(\frac{0.03}{1.96}\right)^2}\)
A survey plans to draw conclusions based on a random sample of 1% of Queensland's adult population. To be regarded as a random sample, every
- (A) adult in the population will be placed in an alphabetical list and every 100th person will be selected for the sample.
- (B) adult in the population can choose to participate until the sample size has been reached.
- (C) subgroup within the population will be represented in a similar proportion in the sample.
- (D) adult in the population will have an equal chance of being selected for the sample.
In a survey, 80 respondents exercised daily, while 120 did not. When calculating the approximate 95% confidence interval for the proportion of people who exercise daily, the margin of error is
- (A) \(1.96\sqrt{\frac{0.4(1-0.4)}{200}}\)
- (B) \(0.95\sqrt{\frac{0.4(1-0.4)}{200}}\)
- (C) \(1.96\sqrt{\frac{0.67(1-0.67)}{120}}\)
- (D) \(0.95\sqrt{\frac{0.67(1-0.67)}{120}}\)
Two types of material (A and B) are being tested for their ability to withstand different temperatures. A random selection of both materials was subjected to extreme temperature changes and then classified according to their condition after they were removed from the testing facility. The results are shown in the table.
| Material | |||
|---|---|---|---|
| A | B | Total | |
| Broke completely | 25 | 43 | 68 |
| Showed defects | 35 | 38 | 73 |
| Remained intact | 35 | 24 | 59 |
| Total | 95 | 105 | 200 |
An approximate 95% confidence interval for the probability that material A will break completely or show defects is given by
\[ \left( c - 1.96\sqrt{\frac{c(1-c)}{n}}, c + 1.96\sqrt{\frac{c(1-c)}{n}} \right) \]The values of \(c\) and \(n\) are
- (A) \(\frac{60}{95}\) and 95
- (B) \(\frac{60}{200}\) and 95
- (C) \(\frac{140}{200}\) and 95
- (D) \(\frac{60}{200}\) and 200
Section 2
Instructions
• Write using black or blue pen.
• Questions worth more than one mark require mathematical reasoning and/or working to be shown to support answers.
• If you need more space for a response, use the additional pages at the back of this book.
– On the additional pages, write the question number you are responding to.
– Cancel any incorrect response by ruling a single diagonal line through your work.
– Write the page number of your alternative/additional response, i.e. See page …
– If you do not do this, your original response will be marked.
• This section has nine questions and is worth 45 marks.
A firm aims to have 95% confidence in estimating the proportion of office workers who respond to an email in less than an hour to within \(\pm 0.05\).
A survey has never been undertaken before, so no past data is available.
The firm believes that if the proportion is 0.5, then this will result in the largest variability in the sample proportion.
Based on this, determine the sample size needed using the approximate value of \(z = 2\) for the 95% confidence interval.
Justify the choice of 0.5 for the proportion.
END OF PAPER