2024 QCE Maths Methods Paper 1 Mini Test 4
External Assessment Paper 1 — Technology-free
Number of marks: 10
Perusal time: 1 minute
Writing time: 15 minutes
Section 1
Instructions
• This section has 10 questions and is worth 10 marks.
• Use a 2B pencil to fill in the A, B, C or D answer bubble completely.
• Choose the best answer for Questions 1 10.
• If you change your mind or make a mistake, use an eraser to remove your response and fill in the new answer bubble completely.
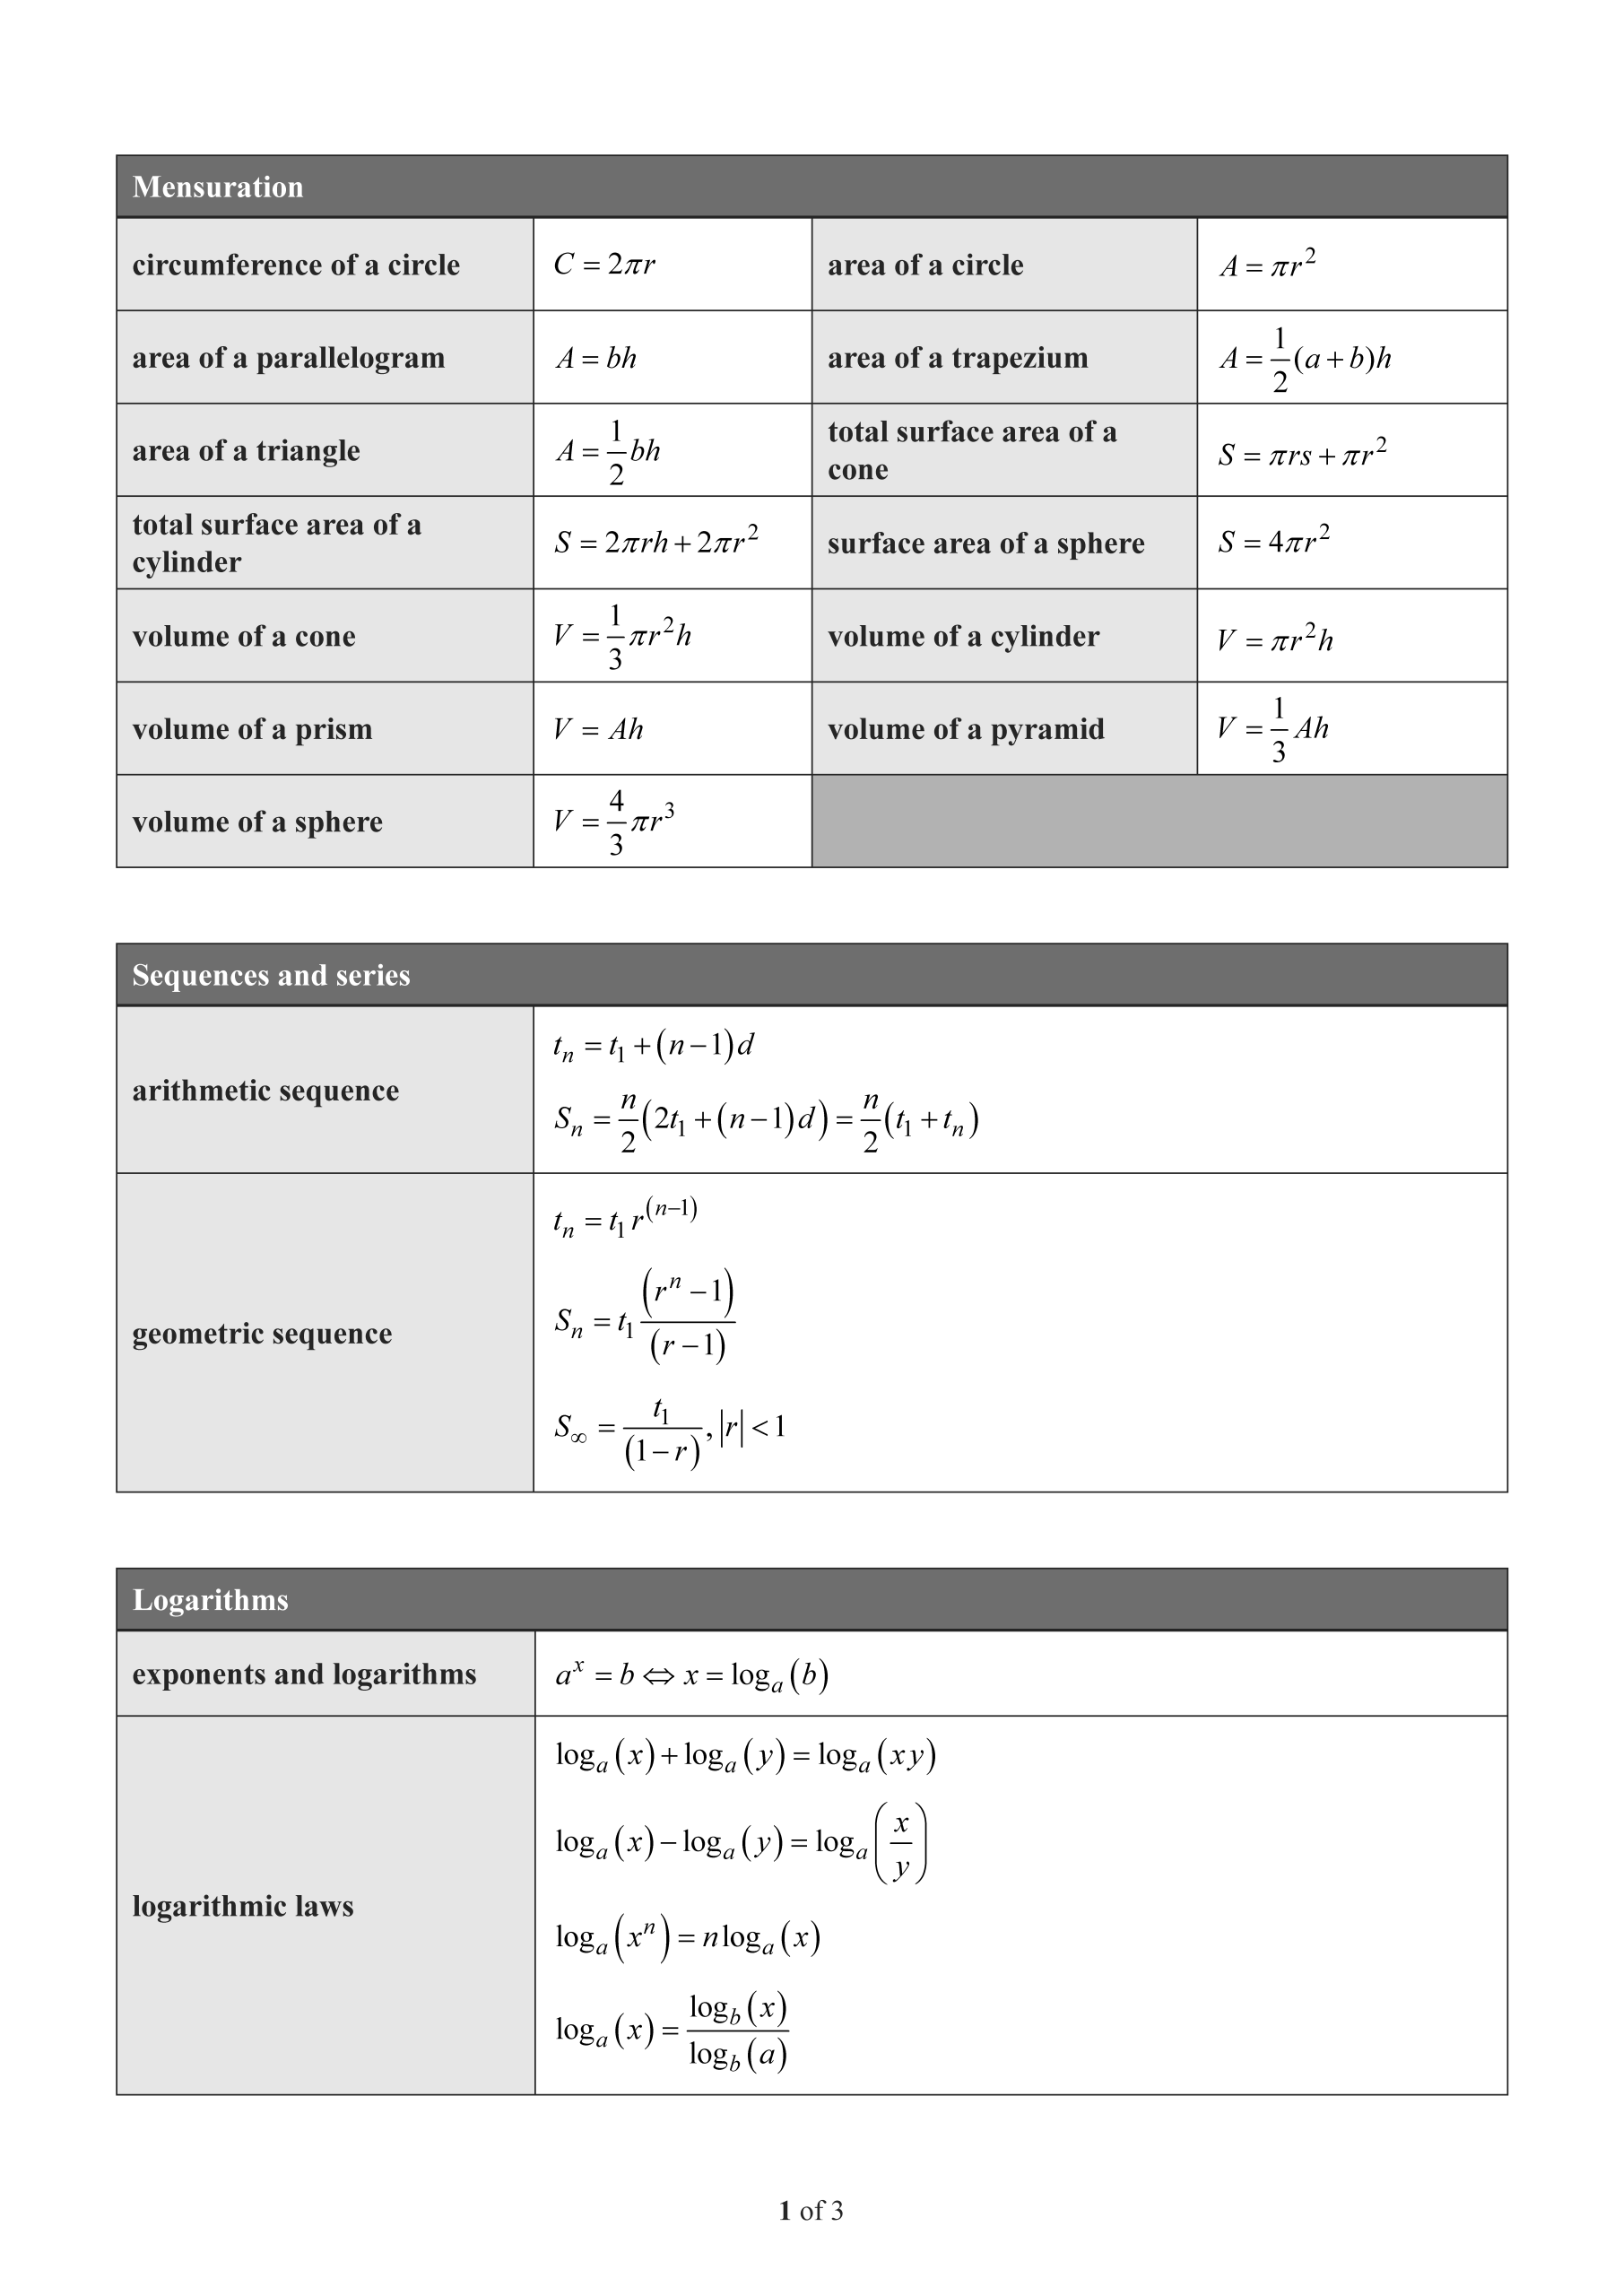
Given that \(\log_{10} 6 = 0.778\), determine the value of \(\log_{10} 600\).
- (A) 77.800
- (B) 10.778
- (C) 2.778
- (D) 1.556
Section 2
Instructions
• Write using black or blue pen.
• Questions worth more than one mark require mathematical reasoning and/or working to be shown to support answers.
• If you need more space for a response, use the additional pages at the back of this book.
– On the additional pages, write the question number you are responding to.
– Cancel any incorrect response by ruling a single diagonal line through your work.
– Write the page number of your alternative/additional response, i.e. See page …
– If you do not do this, your original response will be marked.
• This section has nine questions and is worth 45 marks.
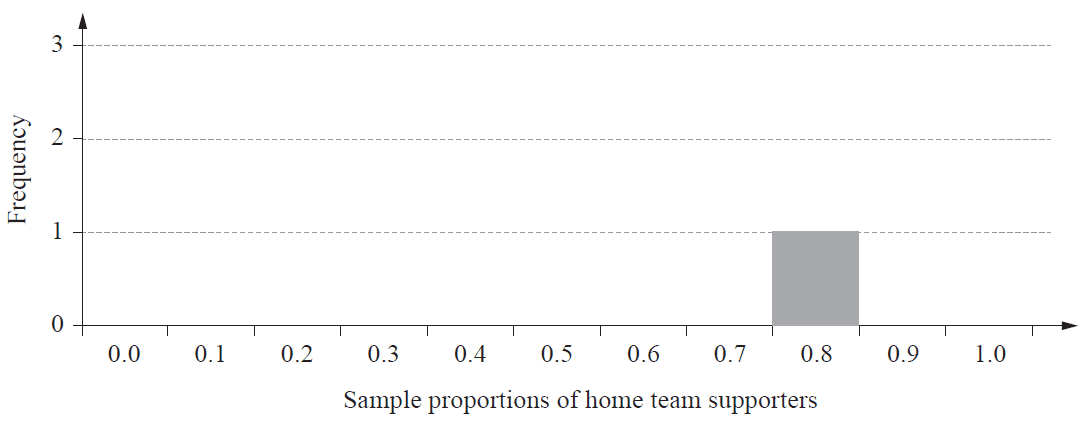
At a particular game at a local sporting venue, 60% of spectators support the home team and the remainder support the away team.
A researcher asked six groups of 10 spectators which team they supported. Each spectator was recorded as either H (supports home team) or A (supports away team). The results were:
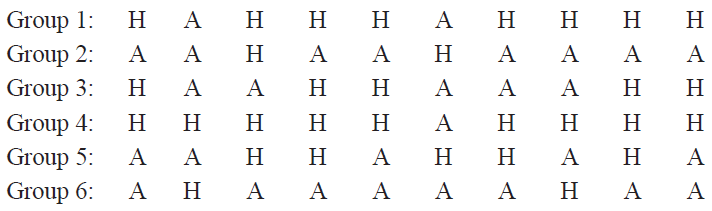
a) The researcher would like to see the distribution of the sample proportions of home team supporters obtained by entering the information into a column graph. The sample proportion for group 1 is shown.
Complete the column graph by including the sample proportions for the remaining five groups. [3 marks]
Note: If you make a mistake in the diagram, cancel it by ruling a single diagonal line through your work and use the additional response space at the back of this QUESTION and response book.
b) If the researcher had interviewed more groups, each containing 100 spectators, describe two ways the distribution of the resulting sample proportions would be expected to differ from the distribution shown in QUESTION 14a). [2 marks]
A survey was conducted to understand whether people support a new policy.
Using a \(z\)-score of 2, the approximate confidence interval for the population proportion of people who support the policy was calculated as
\[ \left( \frac{3}{10}, \frac{7}{10} \right) \]a) Determine the margin of error. [1 mark]
b) Determine the number of people surveyed. [3 marks]
END OF PAPER