QCAA Maths Methods 2020 Exam 2 with solutions
Number of marks: 60
Perusal time: 5 minutes
Writing time: 90 minutes
Section 1
Instructions
• This section has 10 questions and is worth 10 marks.
• Use a 2B pencil to fill in the A, B, C or D answer bubble completely.
• Choose the best answer for Questions 1 10.
• If you change your mind or make a mistake, use an eraser to remove your response and fill in the new answer bubble completely.
The limit of \(\frac{12^h - 1}{h}\) as \(h\) approaches 0 is closest to
- (A) 0.0
- (B) 1.0
- (C) 2.5
- (D) 3.0
The pH of a substance is a measure of its acidity and is given by the formula pH = \(-\log_{10}[H^+]\) where \([H^+]\) is the concentration of hydrogen ions in moles per litre. If a solution has a pH equal to 0.2, the concentration of hydrogen ions in moles per litre is closest to
- (A) 0.32
- (B) 0.63
- (C) 0.70
- (D) 1.58
Let \(R\) be the region enclosed by the graph of \(y = xe^x\), the x-axis, and the lines \(x = -1\) and \(x = 1\).
The area of \(R\) is closest to
- (A) 0.74
- (B) 1.26
- (C) 2.35
- (D) 3.09
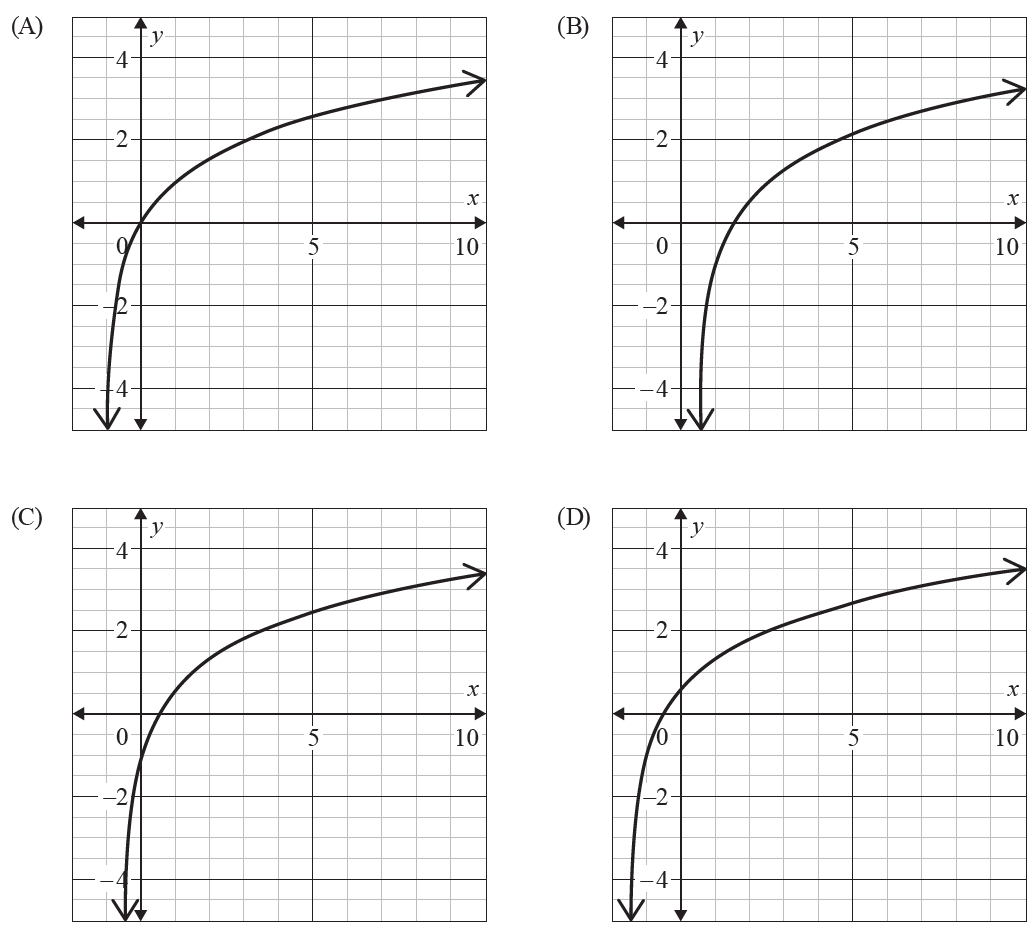
Consider the function \(f(x) = \log_p(x + q)\) where \(p > 1\) and \(0 < q < 1\).
Which of the following could be the graph of \(f(x)\)?
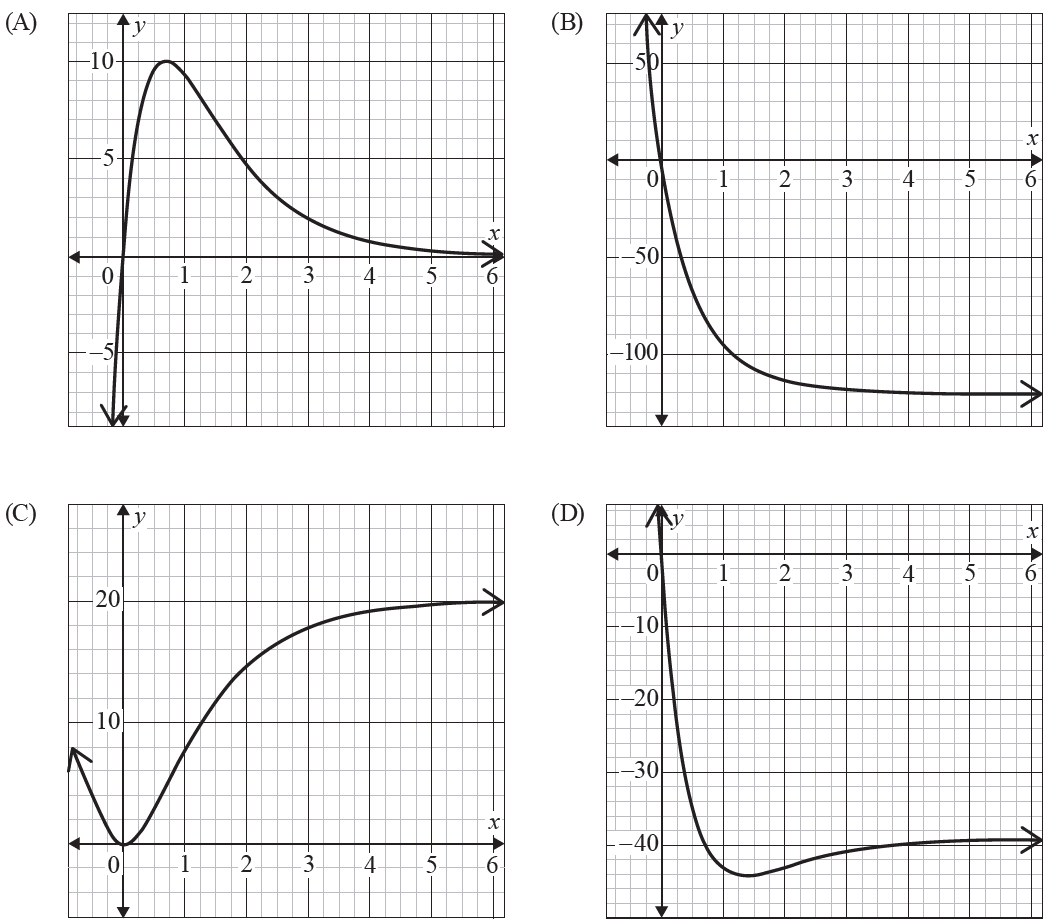
An object moves in a straight line with a velocity \(v\) given by
\[ v(t) = 40(e^{-t} - e^{-2t}) \text{ m s}^{-1} \text{ where } t \ge 0 \]The object is at the origin initially. The displacement-time graph in the first 6 seconds is
Oil is leaking from a tanker at the rate of \(r(t) = 9000e^{-0.2t}\) litres per hour, where \(t\) is in hours.
Determine how much oil leaks from the tanker (to the nearest litre) from time \(t = 0\) to time \(t = 10\).
- (A) 38 910 litres
- (B) 8756 litres
- (C) 7782 litres
- (D) 1556 litres
The records of a shoe manufacturer show that 10% of shoes made are defective.
Assuming independence, the probability of getting 2 defective shoes in a batch of 20 is
- (A) 0.1937
- (B) 0.2852
- (C) 0.3917
- (D) 0.6083
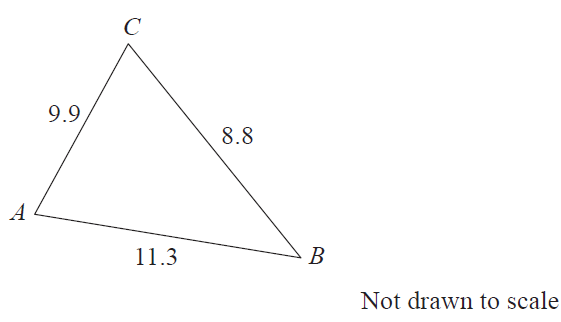
Determine the size of angle \(A\) in the triangle.
- (A) 48.5°
- (B) 61.4°
- (C) 118.6°
- (D) 131.5°
The displacement of a particle (in metres) at time \(t\) (in seconds) is represented by the function
\[ s(t) = t \ln(t) - t, \quad 0 < t < 4 \]Determine the approximate acceleration of the particle at time \(t = 3\).
- (A) 0.66 m s\(^{-2}\)
- (B) 0.33 m s\(^{-2}\)
- (C) -0.33 m s\(^{-2}\)
- (D) -0.66 m s\(^{-2}\)
The approximate value of \(x\) where the graph of the function \(y = x^3 + 6x^2 + 7x - 2\cos(x)\) changes concavity is
- (A) -3.26
- (B) -2.85
- (C) -2.20
- (D) -1.89
Section 2
Instructions
• Write using black or blue pen.
• Questions worth more than one mark require mathematical reasoning and/or working to be shown to support answers.
• If you need more space for a response, use the additional pages at the back of this book.
– On the additional pages, write the question number you are responding to.
– Cancel any incorrect response by ruling a single diagonal line through your work.
– Write the page number of your alternative/additional response, i.e. See page …
– If you do not do this, your original response will be marked.
• This section has nine questions and is worth 45 marks.
A sugar company samples the packets of sugar it produces and finds that 5% of packets are underweight. Consider a batch of 20 packets.
a) Determine how many packets of sugar the company can expect to be underweight in a batch of 20 packets. [1 mark]
b) Determine the variance of the batch. [1 mark]
c) Determine the probability that at most one of the packets of sugar in the batch is underweight. [2 marks]
The rates of change in population for two cities are given by
City A: \( A'(t) = \frac{45}{t+1} \)
City B: \( B'(t) = 105e^{0.03t} \)
where \(t\) is the number of years since 2018 and both \(A'(t)\) and \(B'(t)\) are measured in people per year. At the beginning of 2018, City A had a population of 5000, and City B had a population of 3500.
a) Determine the population models for both cities. [3 marks]
b) Use the information in 12a) to predict the population of City B at the beginning of 2028. [1 mark]
c) Use the information in 12a) to predict the year in which the population of both cities will be the same. [3 marks]
An online retailer claims that 90% of all orders are shipped within 12 hours of being received. On a particular day, 121 orders were received and 102 orders were shipped within 12 hours.
a) State the sample proportion of orders shipped within 12 hours. [1 mark]
The distribution of the sample proportion of all orders that are shipped within 12 hours of being received on any day is approximately normal.
b) Assuming the online retailer’s claim is true, find the probability that, in a random sample of 121, less than 85% of all orders are shipped within 12 hours. [3 marks]
c) Use the result from 13b) to evaluate the reasonableness of the online retailer’s claim. [2 marks]
Let \(X\) denote the time in minutes between the arrival of trains at a station. The cumulative distribution function of \(X\) is defined by
\[ F(x) = \begin{cases} 2 - \frac{10}{x}, & 5 \le x \le 10 \\ 0, & \text{otherwise} \end{cases} \]a) Determine the probability density function of \(X\). [3 marks]
b) Determine the probability that \(5 < X < 7\). [1 mark]
c) Determine the mean time between the arrival of trains at the station. [2 marks]
A field is divided into five sections as shown. The width of each section is 1 metre. The perpendicular height, in metres, of each section is given in the diagram. The area of the field was approximated using the trapezoidal rule and found to be 11.12 m\(^2\).
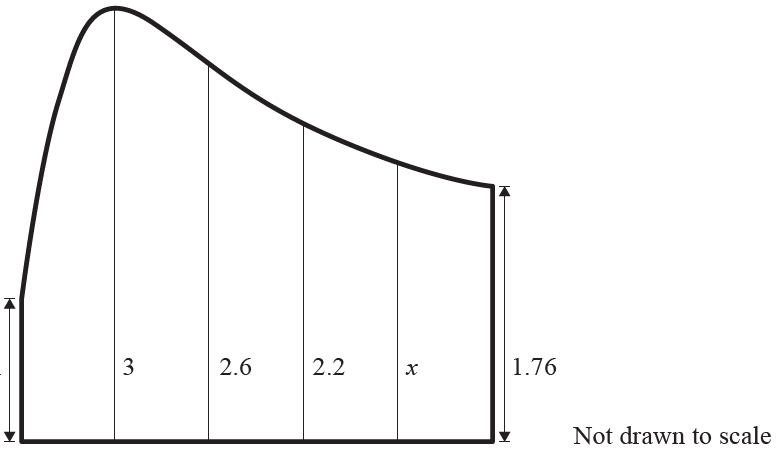
a) Determine the height marked \(x\) on the diagram. [2 marks]
b) Determine the area of the field, given the shape of the field is modelled by the function
\[ f(x) = \frac{4x}{x^2+1} + 1, \quad 0 \le x \le 5 \] [1 mark]Bottles of soft drink should contain a volume with a mean of 591 mL, but some variation is expected. Any bottle at or below the 20th percentile of the volume distribution is rejected. A percentile is a measure in statistics that shows the values below which a given percentage of observations occur.
Thirty-five per cent of the bottles contain 593 mL or more of soft drink.
Assuming the volumes are normally distributed, determine the smallest volume (in mL) that will be accepted.
In a survey of 326 lecturers, 303 said that on at least one occasion a mobile phone had rung in a lecture they were giving.
Determine the sample size required to conduct a follow-up survey that provides 95% confidence that this one-point estimate is correct to within ± 0.02 of the population proportion.
The diagram shows the quadrilateral \(ABCD\).
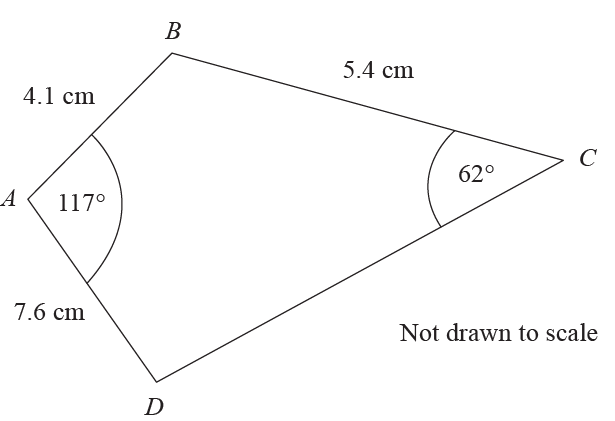
Determine the perimeter of the quadrilateral.
Consider the following information when completing this question.
The length of a curve \( y = f(x) \) over the interval \( [a,b] \) = \( \int_a^b \sqrt{1 + \left(\frac{dy}{dx}\right)^2} \, dx \)
You are driving along a road with a vertical distance above sea level \(D\) (in metres) given by the function
\[ D(x) = 300 + \ln(x^2 - 3x + e) \]where \(x\) is the horizontal distance from an initial point of measurement (in kilometres) at sea level. Assume that if \(x\) is positive you are east of the initial point of measurement and if \(x\) is negative you are west of the initial point of measurement.
You start your drive along the road at a horizontal distance of 10 kilometres west of the initial point of measurement and drive until you are at a horizontal distance of 10 kilometres east of the initial point.
Determine the time you spend driving downhill, if you drive downhill at an average speed of 40 km/h.
Assuming the approximate normality of sample proportions (\(\hat{p}_1\) and \(\hat{p}_2\)) and based on two independent samples, the approximate confidence interval for the difference of two proportions is given by
\[ \left( \hat{p}_1 - \hat{p}_2 - z\sqrt{\frac{\hat{p}_1(1-\hat{p}_1)}{n_1} + \frac{\hat{p}_2(1-\hat{p}_2)}{n_2}}, \hat{p}_1 - \hat{p}_2 + z\sqrt{\frac{\hat{p}_1(1-\hat{p}_1)}{n_1} + \frac{\hat{p}_2(1-\hat{p}_2)}{n_2}} \right) \]If the approximate confidence interval for the difference between two proportions does not contain 0, this provides evidence that the two proportions are not equal.
The data in the table shows the observed frequencies of two drink preferences for independent samples of people who live in Town A and Town B.
| Town | Tea | Coffee | Total |
|---|---|---|---|
| A | 111 | 105 | 216 |
| B | 150 | 107 | 257 |
Using the approximate 99% confidence interval for the difference of two proportions, determine if there is evidence to conclude that drink preference is associated with the town where the person lives.
END OF PAPER
QCE is a registered trademark of the QCAA. The QCAA does not endorse or make any warranties regarding this study resource. Past QCE exams and related content can be accessed directly at www.qcaa.qld.edu.au/