VCE General Maths Data Analysis 2016 Mini Test 1
VCAA General Maths Exam 2
This is the full VCE General Maths Exam with worked solutions. You can also try Mini-Tests, which are official VCAA exams split into short tests you can do anytime.
Number of marks: 5
Reading time: 1 minute
Writing time: 7 minutes
Instructions
• Answer all questions in the spaces provided.
• Write your responses in English.
• In all questions where a numerical answer is required, you should only round your answer when instructed to do so.
• Unless otherwise indicated, the diagrams in this book are not drawn to scale.
Data analysis - 2016 - Exam 2 (Part 1)
The weather station also records daily maximum temperatures.
a. The five-number summary for the distribution of maximum temperatures for the month of February is displayed in the table below.
| Temperature (°C) | |
|---|---|
| Minimum | 16 |
| \(Q_1\) | 21 |
| Median | 25 |
| \(Q_3\) | 31 |
| Maximum | 38 |
There are no outliers in this distribution.
i. Use the five-number summary above to construct a boxplot on the grid below. 1 mark
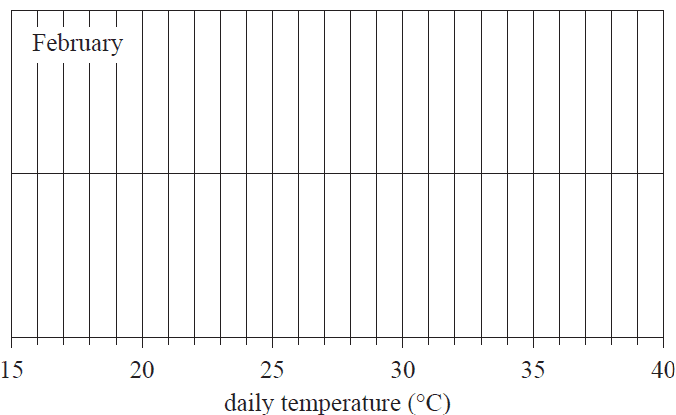
ii. What percentage of days had a maximum temperature of 21°C, or greater, in this particular February? 1 mark
b. The boxplots below display the distribution of maximum daily temperature for the months of May and July.
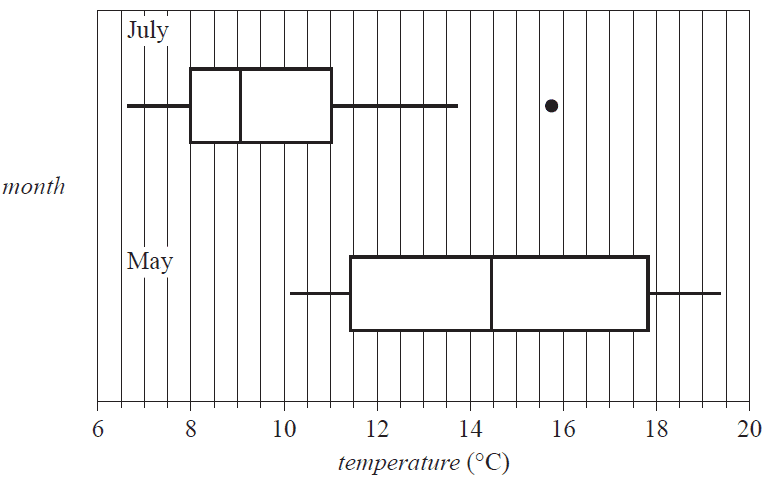
i. Describe the shapes of the distributions of daily temperature (including outliers) for July and for May. 1 mark
July
May
ii. Determine the value of the upper fence for the July boxplot. 1 mark
iii. Using the information from the boxplots, explain why the maximum daily temperature is associated with the month of the year. Quote the values of appropriate statistics in your response. 1 mark
End of Multiple-Choice Question Book
VCE is a registered trademark of the VCAA. The VCAA does not endorse or make any warranties regarding this study resource. Past VCE exams and related content can be accessed directly at www.vcaa.vic.edu.au
