VCE General Maths Data Analysis 2018 Mini Test 2
VCAA General Maths Exam 2
This is the full VCE General Maths Exam with worked solutions. You can also try Mini-Tests, which are official VCAA exams split into short tests you can do anytime.
Number of marks: 7
Reading time: 2 minutes
Writing time: 10 minutes
Instructions
• Answer all questions in the spaces provided.
• Write your responses in English.
• In all questions where a numerical answer is required, you should only round your answer when instructed to do so.
• Unless otherwise indicated, the diagrams in this book are not drawn to scale.
Data analysis - 2018 - Exam 2 (Part 2)
The congestion level in a city can also be recorded as the percentage increase in travel time due to traffic congestion in peak periods (compared to non-peak periods).
This is called the percentage congestion level.
The percentage congestion levels for the morning and evening peak periods for 19 large cities are plotted on the scatterplot below.
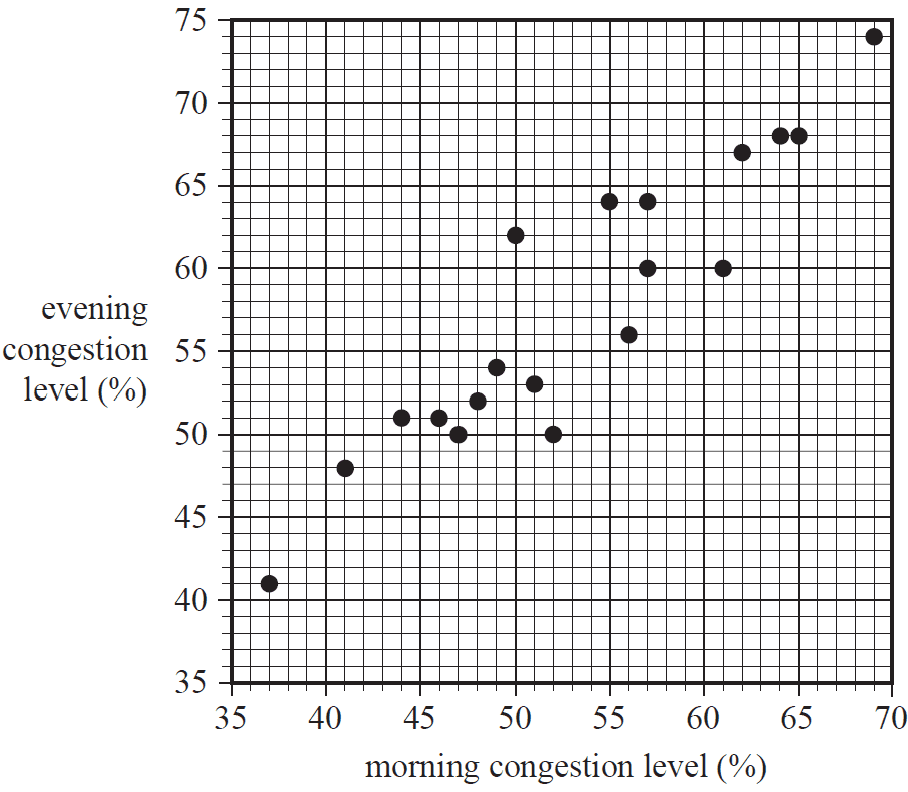
a. Determine the median percentage congestion level for the morning peak period and the evening peak period.
Write your answers in the appropriate boxes provided below. 2 marks
Median percentage congestion level for morning peak period %
Median percentage congestion level for evening peak period %
A least squares line is to be fitted to the data with the aim of predicting evening congestion level from morning congestion level.
The equation of this line is
evening congestion level = \(8.48 + 0.922 \times\) morning congestion level
b. Name the response variable in this equation. 1 mark
c. Use the equation of the least squares line to predict the evening congestion level when the morning congestion level is 60%. 1 mark
d. Determine the residual value when the equation of the least squares line is used to predict the evening congestion level when the morning congestion level is 47%.
Round your answer to one decimal place. 2 marks
e. The value of the correlation coefficient \(r\) is 0.92.
What percentage of the variation in the evening congestion level can be explained by the variation in the morning congestion level?
Round your answer to the nearest whole number. 1 mark
The total rainfall, in millimetres, for each of the four seasons in 2015 and 2016 is shown in Table 5 below.
| Year | Total rainfall (mm) | |||
|---|---|---|---|---|
| Summer | Autumn | Winter | Spring | |
| 2015 | 142 | 156 | 222 | 120 |
| 2016 | 135 | 153 | 216 | 96 |
a. The seasonal index for winter is shown in Table 6 below.
Use the values in Table 5 to find the seasonal indices for summer, autumn and spring.
Write your answers in Table 6, rounded to two decimal places. 2 marks
| Summer | Autumn | Winter | Spring | |
|---|---|---|---|---|
| Seasonal index | 1.41 |
b. The total rainfall for each of the four seasons in 2017 is shown in Table 7 below.
| Year | Total rainfall (mm) | |||
|---|---|---|---|---|
| Summer | Autumn | Winter | Spring | |
| 2017 | 141 | 156 | 262 | 120 |
Use the appropriate seasonal index from Table 6 to deseasonalise the total rainfall for winter in 2017.
Round your answer to the nearest whole number. 1 mark
End of Multiple-Choice Question Book
VCE is a registered trademark of the VCAA. The VCAA does not endorse or make any warranties regarding this study resource. Past VCE exams and related content can be accessed directly at www.vcaa.vic.edu.au
