VCE General Maths Data Analysis 2021 Mini Test 3
VCAA General Maths Exam 2
This is the full VCE General Maths Exam with worked solutions. You can also try Mini-Tests, which are official VCAA exams split into short tests you can do anytime.
Number of marks: 8
Reading time: 2 minutes
Writing time: 12 minutes
Instructions
• Answer all questions in the spaces provided.
• Write your responses in English.
• In all questions where a numerical answer is required, you should only round your answer when instructed to do so.
• Unless otherwise indicated, the diagrams in this book are not drawn to scale.
Data analysis - 2021 - Exam 2 (Part 3)
The time series plot below shows that the winning time for both men and women in the 100 m freestyle swim in the Olympic Games has been decreasing during the period 1912 to 2016.
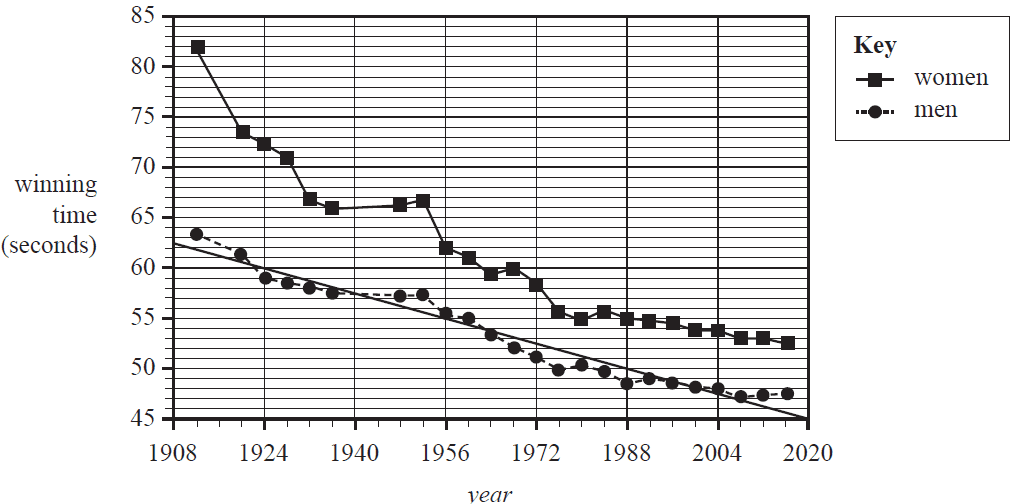
Least squares lines are used to model the trend for both men and women.
The least squares line for the men’s winning time has been drawn on the time series plot above.
The equation of the least squares line for men is
\( \textit{winning time men} = 356.9 - 0.1544 \times \textit{year} \)
The equation of the least squares line for women is
\( \textit{winning time women} = 538.9 - 0.2430 \times \textit{year} \)
a. Draw the least squares line for winning time women on the time series plot above. 1 mark
(Answer on the time series plot above.)
b. The difference between the women’s predicted winning time and the men’s predicted winning time can be calculated using the formula
\( \textit{difference} = \textit{winning time women} - \textit{winning time men} \)
Use the equations of the least squares lines on page 8 and the formula above to calculate the difference predicted for the 2024 Olympic Games.
Round your answer to one decimal place. 2 marks
c. The Olympic Games are held every four years. The next Olympic Games will be held in 2024, then 2028, 2032 and so on.
In which Olympic year do the two least squares lines predict that the winning time for women will first be faster than the winning time for men in the 100 m freestyle? 2 marks
A method for predicting future time differences in the 100 m freestyle swim is to use the formula
\( \textit{difference} = \textit{winning time women} - \textit{winning time men} \)
The resulting data and time series plot are shown below. The plot is clearly non-linear.
| Year | Difference (seconds) |
|---|---|
| 1912 | 18.8 |
| 1920 | 12.2 |
| 1924 | 13.4 |
| 1928 | 12.4 |
| 1932 | 8.6 |
| 1936 | 8.3 |
| 1948 | 9.0 |
| 1952 | 9.4 |
| 1956 | 6.6 |
| 1960 | 6.0 |
| 1964 | 6.1 |
| 1968 | 7.8 |
| 1972 | 7.4 |
| 1976 | 5.7 |
| 1980 | 4.4 |
| 1984 | 6.1 |
| 1988 | 6.3 |
| 1992 | 5.6 |
| 1996 | 5.8 |
| 2000 | 5.5 |
| 2004 | 5.7 |
| 2008 | 5.9 |
| 2012 | 5.5 |
| 2016 | 5.1 |
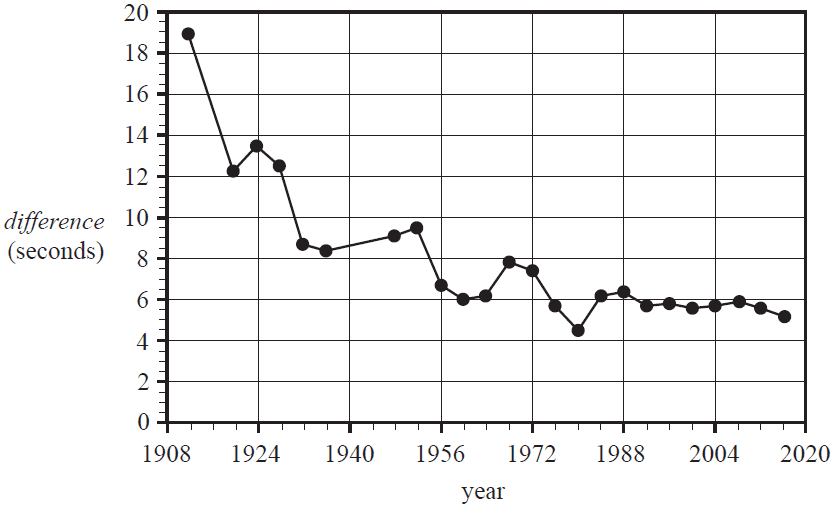
a. Apply a reciprocal transformation to the variable difference to linearise the data. Fit a least squares line to the transformed data and write its equation below.
Round the values of the intercept and the slope to four significant figures. 2 marks
b. Use the equation from part a. to predict, in seconds, the difference between the women's and men's winning times in the year 2032.
Round your answer to one decimal place. 1 mark
End of Multiple-Choice Question Book
VCE is a registered trademark of the VCAA. The VCAA does not endorse or make any warranties regarding this study resource. Past VCE exams and related content can be accessed directly at www.vcaa.vic.edu.au
