VCE General Maths Data Analysis 2022 Mini Test 2
VCAA General Maths Exam 2
This is the full VCE General Maths Exam with worked solutions. You can also try Mini-Tests, which are official VCAA exams split into short tests you can do anytime.
Number of marks: 9
Reading time: 2 minutes
Writing time: 13 minutes
Instructions
• Answer all questions in the spaces provided.
• Write your responses in English.
• In all questions where a numerical answer is required, you should only round your answer when instructed to do so.
• Unless otherwise indicated, the diagrams in this book are not drawn to scale.
Data analysis - 2022 - Exam 2 (Part 2)
The boxplots below show the distribution of relative humidity (%) at 9 am and 3 pm at a weather station for the 30 days of November 2021.
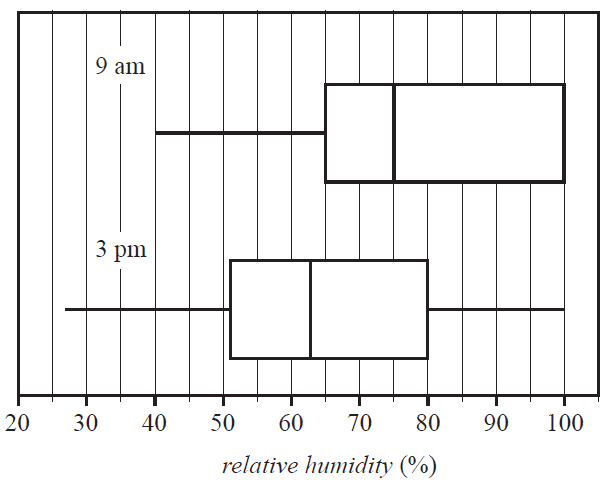
a.
i. Determine whether the relative humidity in November is more variable at 9 am or 3 pm. Give the approximate values of both the interquartile ranges in your answer. 1 mark
ii. Write down the percentage of days in November for which the relative humidity at 3 pm was less than 80%. 1 mark
iii. Complete the five-number summaries for the distributions of relative humidity at 9 am and 3 pm by writing the missing values in the table below. 1 mark
| Time | Minimum | First quartile (\(Q_1\)) |
Median | Third quartile (\(Q_3\)) |
Maximum |
|---|---|---|---|---|---|
| 9 am | 65 | 75 | |||
| 3 pm | 27 | 51 | 63 |
b. Do the boxplots support the contention that there is an association between relative humidity and time of day? Refer to the values of an appropriate statistic in your answer. 2 marks
Table 1 displays data for seven weather-related variables for the first eight days of December 2021.
Table 1
| Day number | Minimum temperature (°C) | Maximum temperature (°C) | Rainfall (mm) | Maximum wind speed (km/h) | Direction of maximum wind speed | Temperature 9 am (°C) |
|---|---|---|---|---|---|---|
| 1 | 19.4 | 28.3 | 0 | 35 | ENE | 22.9 |
| 2 | 17.6 | 29.7 | 1.0 | 35 | WSW | 24.2 |
| 3 | 7.6 | 16.5 | 11.6 | 26 | WSW | 12.7 |
| 4 | 7.5 | 15.9 | 0 | 30 | WSW | 10.9 |
| 5 | 5.7 | 19.0 | 0.2 | 24 | ESE | 10.4 |
| 6 | 9.9 | 23.8 | 0 | 39 | NE | 17.8 |
| 7 | 11.0 | 11.9 | 0 | 22 | SSW | 11.7 |
| 8 | 6.5 | 14.2 | 0 | 28 | ESE | 9.5 |
a. Write down
i. the number of numerical variables in Table 1 1 mark
ii. the median rainfall, in millimetres, for the eight-day period. 1 mark
b. A least squares line is used to model the association between daily maximum temperature and daily minimum temperature.
With unrounded values for the intercept and slope, the equation of the least squares line is
maximum temperature = 9.235946... + 1.002493... × minimum temperature
Round the intercept and slope to four significant figures. Write your answers in the boxes provided. 1 mark
maximum temperature = + × minimum temperature
c. Calculate the coefficient of determination for the association between the daily maximum temperature and the daily minimum temperature. Write down its value as a percentage, rounded to one decimal place. 1 mark
coefficient of determination = %
End of Multiple-Choice Question Book
VCE is a registered trademark of the VCAA. The VCAA does not endorse or make any warranties regarding this study resource. Past VCE exams and related content can be accessed directly at www.vcaa.vic.edu.au
