VCE General Maths Data Analysis 2024 Mini Test 2
VCAA General Maths Exam 2
This is the full VCE General Maths Exam with worked solutions. You can also try Mini-Tests, which are official VCAA exams split into short tests you can do anytime.
Number of marks: 10
Reading time: 2.5 minutes
Writing time: 15 minutes
Instructions
• Answer all questions in the spaces provided.
• Write your responses in English.
• In all questions where a numerical answer is required, you should only round your answer when instructed to do so.
• Unless otherwise indicated, the diagrams in this book are not drawn to scale.
Data analysis - 2024 - Exam 2 (Part 2)
The Olympic gold medal-winning height for the women’s high jump, \(Wgold\), is often lower than the best height achieved in other international women’s high jump competitions in that same year.
Table 2 lists the Olympic year, year, the gold medal-winning height, \(Wgold\), in metres, and the best height achieved in all international women’s high jump competitions in that same year, \(Wbest\), in metres, for each Olympic year from 1972 to 2020.
Table 2
| year | 1972 | 1976 | 1980 | 1984 | 1988 | 1992 | 1996 | 2000 | 2004 | 2008 | 2012 | 2016 | 2020 |
|---|---|---|---|---|---|---|---|---|---|---|---|---|---|
| Wgold (m) | 1.92 | 1.93 | 1.97 | 2.02 | 2.03 | 2.02 | 2.05 | 2.01 | 2.06 | 2.05 | 2.05 | 1.97 | 2.04 |
| Wbest (m) | 1.94 | 1.96 | 1.98 | 2.07 | 2.07 | 2.05 | 2.05 | 2.02 | 2.06 | 2.06 | 2.05 | 2.01 | 2.05 |
A scatterplot of \(Wbest\) versus \(Wgold\) for this data is also provided.
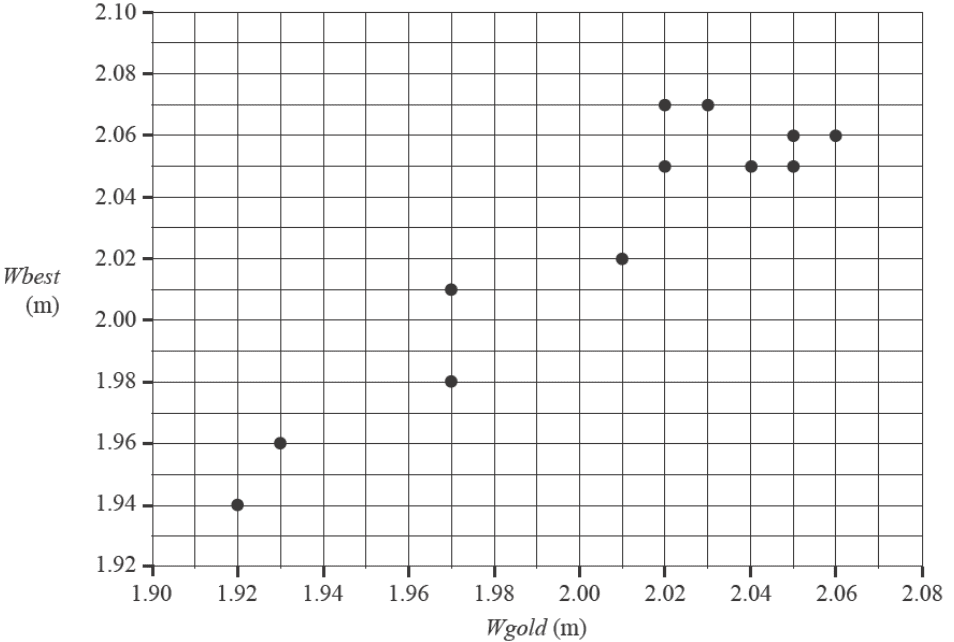
When a least squares line is fitted to the scatterplot, the equation is found to be:
\(Wbest = 0.300 + 0.860 \times Wgold\)
The correlation coefficient is 0.9318
a. Name the response variable in this equation. 1 mark
b. Draw the least squares line on the scatterplot above. 1 mark
c. Determine the value of the coefficient of determination as a percentage.
Round your answer to one decimal place. 1 mark
d. Describe the association between \(Wbest\) and \(Wgold\) in terms of strength and direction. 1 mark
| strength | |
| direction< |
e. Referring to the equation of the least squares line, interpret the value of the slope in terms of the variables \(Wbest\) and \(Wgold\). 1 mark
f. In 1984, the \(Wbest\) value was 2.07 m for a \(Wgold\) value of 2.02 m.
Show that when this least squares line is fitted to the scatterplot, the residual value for this point is 0.0328 2 marks
g. The residual plot obtained when the least squares line was fitted to the data is shown below. The residual value from part f is missing from the residual plot.
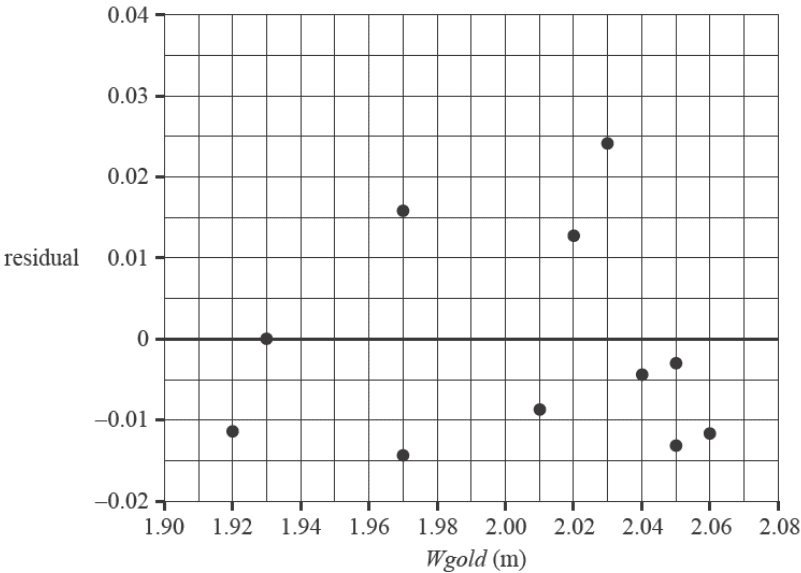
i. Complete the residual plot by adding the residual value from part f, drawn as a cross (X), to the residual plot above. 1 mark
ii. In part b, a least squares line was fitted to the scatterplot.
Does the residual plot from part g justify this? Briefly explain your answer. 1 mark
h. In 1964, the gold medal-winning height, \(Wgold\), was 1.90 m. When the least squares line is used to predict \(Wbest\), it is found to be 1.934 m.
Explain why this prediction is not likely to be reliable. 1 mark
End of Multiple-Choice Question Book
VCE is a registered trademark of the VCAA. The VCAA does not endorse or make any warranties regarding this study resource. Past VCE exams and related content can be accessed directly at www.vcaa.vic.edu.au
