VCE General Maths Data Analysis 2024 Mini Test 1
VCAA General Maths Exam 2
This is the full VCE General Maths Exam with worked solutions. You can also try Mini-Tests, which are official VCAA exams split into short tests you can do anytime.
Number of marks: 10
Reading time: 2.5 minutes
Writing time: 15 minutes
Instructions
• Answer all questions in the spaces provided.
• Write your responses in English.
• In all questions where a numerical answer is required, you should only round your answer when instructed to do so.
• Unless otherwise indicated, the diagrams in this book are not drawn to scale.
Data analysis - 2024 - Exam 2 (Part 1)
Table 1 lists the Olympic year, year, and the gold medal-winning height for the men’s high jump, \(Mgold\), in metres, for each Olympic Games held from 1928 to 2020. No Olympic Games were held in 1940 or 1944, and the 2020 Olympic Games were held in 2021.
Table 1
| year | Mgold (m) |
|---|---|
| 1928 | 1.94 |
| 1932 | 1.97 |
| 1936 | 2.03 |
| 1948 | 1.98 |
| 1952 | 2.04 |
| 1956 | 2.12 |
| 1960 | 2.16 |
| 1964 | 2.18 |
| 1968 | 2.24 |
| 1972 | 2.23 |
| 1976 | 2.25 |
| 1980 | 2.36 |
| 1984 | 2.35 |
| 1988 | 2.38 |
| 1992 | 2.34 |
| 1996 | 2.39 |
| 2000 | 2.35 |
| 2004 | 2.36 |
| 2008 | 2.36 |
| 2012 | 2.33 |
| 2016 | 2.38 |
| 2020 | 2.37 |
a. For the data in Table 1, determine:
i. the maximum \(Mgold\) in metres 1 mark
ii. the percentage of \(Mgold\) values greater than 2.25 m. 1 mark
b. The mean of these \(Mgold\) values is 2.23 m, and the standard deviation is 0.15 m.
Calculate the standardised z-score for the 2000 \(Mgold\) of 2.35 m. 1 mark
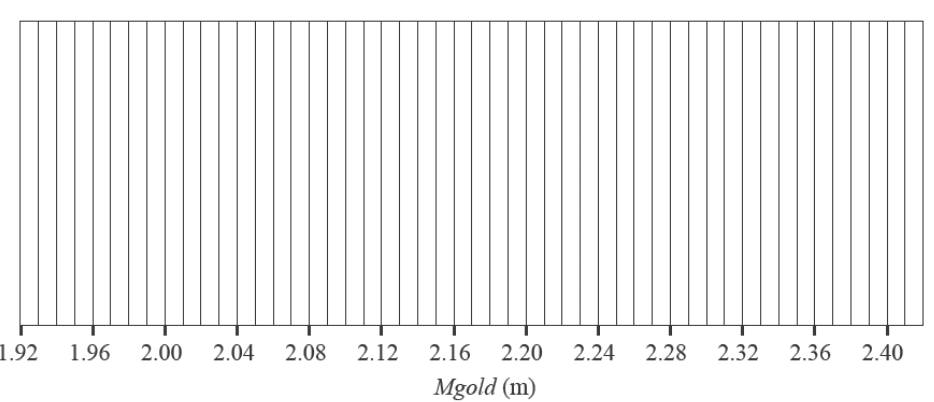
c. Construct a boxplot for the \(Mgold\) data in Table 1 on the grid below. 2 marks
d. A least squares line can also be used to model the association between \(Mgold\) and year.
Using the data from Table 1, determine the equation of the least squares line for this data set.
Use the template below to write your answer.
Round the values of the intercept and slope to three significant figures. 2 marks
\(Mgold = \) \(+\) \(\times \textit{year}\)
e. The coefficient of determination is 0.857
Interpret the coefficient of determination in terms of \(Mgold\) and year. 1 mark
The time series plot below shows the gold medal-winning height for the women’s high jump, \(Wgold\), in metres, for each Olympic year, year, from 1952 to 1988.
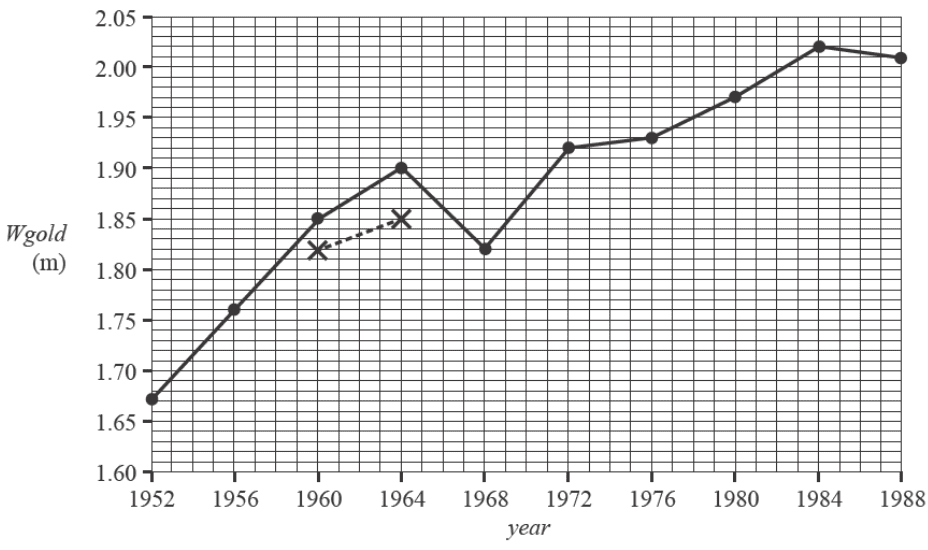
A five-median smoothing process will be used to smooth the time series plot above.
The first two points have been placed on the graph with crosses (X) and joined by a dashed line (---).
a. Complete the five-median smoothing by marking smoothed values with crosses (X) joined by a dashed line (---) on the time series plot above. 1 mark
b. Identify two qualitative features that best describe the time series plot above. 1 mark
End of Multiple-Choice Question Book
VCE is a registered trademark of the VCAA. The VCAA does not endorse or make any warranties regarding this study resource. Past VCE exams and related content can be accessed directly at www.vcaa.vic.edu.au
