VCE General Maths Data Analysis 2017 Mini Test 2
This is the full VCE General Maths Exam with worked solutions. You can also try Mini-Tests, which are official VCAA exams split into short tests you can do anytime.
Number of marks: 10
Reading time: 4 minutes
Writing time: 22 minutes
Instructions
• Answer all questions in pencil on your Multiple-Choice Answer Sheet.
• Choose the response that is correct for the question.
• A correct answer scores 1; an incorrect answer scores 0.
• Marks will not be deducted for incorrect answers.
• No marks will be given if more than one answer is completed for any question.
• Unless otherwise indicated, the diagrams in this book are not drawn to scale.
Data analysis - 2017 (Part 2)
The residuals for this least squares line have a mean of 0.02 cm and a standard deviation of 0.4 cm. The value of the residual for one of the data points is found to be –0.3 cm. The standardised value of this residual is
- A. –0.8
- B. –0.7
- C. –0.3
- D. 0.7
- E. 0.8
Which one of the following statistics can never be negative?
- A. the maximum value in a data set
- B. the value of a Pearson correlation coefficient
- C. the value of a moving mean in a smoothed time series
- D. the value of a seasonal index
- E. the value of the slope of a least squares line fitted to a scatterplot
Data collected over a period of 10 years indicated a strong, positive association between the number of stray cats and the number of stray dogs reported each year (\(r = 0.87\)) in a large, regional city.
A positive association was also found between the population of the city and both the number of stray cats (\(r = 0.61\)) and the number of stray dogs (\(r = 0.72\)).
During the time that the data was collected, the population of the city grew from 34 564 to 51 055.
From this information, we can conclude that
- A. if cat owners paid more attention to keeping dogs off their property, the number of stray cats reported would decrease.
- B. the association between the number of stray cats and stray dogs reported cannot be causal because only a correlation of +1 or –1 shows causal relationships.
- C. there is no logical explanation for the association between the number of stray cats and stray dogs reported in the city so it must be a chance occurrence.
- D. because larger populations tend to have both a larger number of stray cats and stray dogs, the association between the number of stray cats and the number of stray dogs can be explained by a common response to a third variable, which is the increasing population size of the city.
- E. more stray cats were reported because people are no longer as careful about keeping their cats properly contained on their property as they were in the past.
Use the following information to answer Questions 13–15.
The wind speed at a city location is measured throughout the day. The time series plot below shows the daily maximum wind speed, in kilometres per hour, over a three-week period.
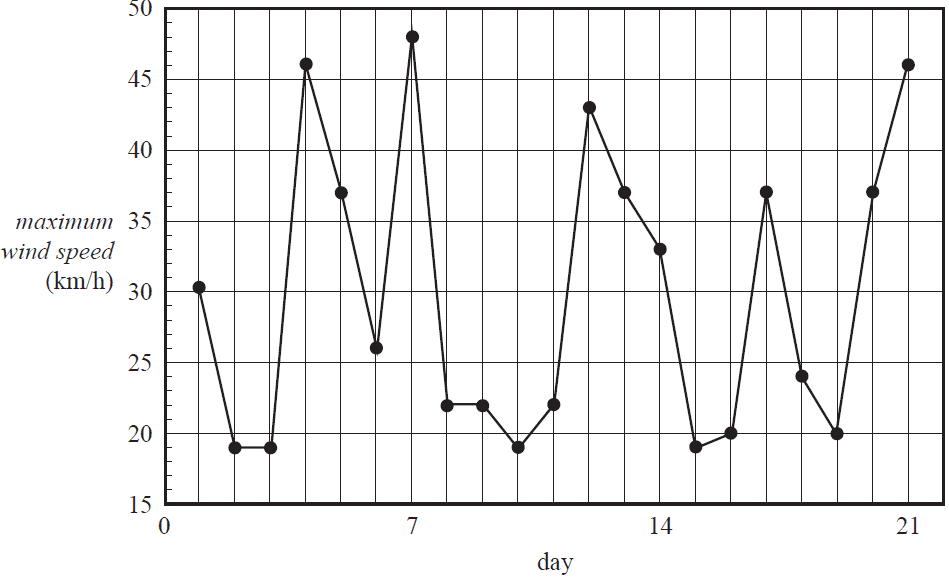
The time series is best described as having
- A. seasonality only.
- B. irregular fluctuations only.
- C. seasonality with irregular fluctuations.
- D. a decreasing trend with irregular fluctuations.
- E. an increasing trend with irregular fluctuations.
The seven-median smoothed maximum wind speed, in kilometres per hour, for day 4 is closest to
- A. 22
- B. 26
- C. 27
- D. 30
- E. 32
The table below shows the daily maximum wind speed, in kilometres per hour, for the days in week 2.
| Day | 8 | 9 | 10 | 11 | 12 | 13 | 14 |
|---|---|---|---|---|---|---|---|
| Maximum wind speed (km/h) | 22 | 22 | 19 | 22 | 43 | 37 | 33 |
A four-point moving mean with centring is used to smooth the time series data above.
The smoothed maximum wind speed, in kilometres per hour, for day 11 is closest to
- A. 22
- B. 24
- C. 26
- D. 28
- E. 30
The seasonal index for the sales of cold drinks in a shop in January is 1.6
To correct the January sales of cold drinks for seasonality, the actual sales should be
- A. reduced by 37.5%
- B. reduced by 40%
- C. reduced by 62.5%
- D. increased by 60%
- E. increased by 62.5%
Recursion and financial modelling
Question 8The value of a reducing balance loan, in dollars, after \(n\) months, \(V_n\), can be modelled by the recurrence relation shown below.
\(V_0 = 26\,000, \quad V_{n+1} = 1.003\,V_n - 400\)
What is the value of this loan after five months?
- A. $24 380.31
- B. $24 706.19
- C. $25 031.10
- D. $25 355.03
- E. $25 678.00
End of Multiple-Choice Question Book
VCE is a registered trademark of the VCAA. The VCAA does not endorse or make any warranties regarding this study resource. Past VCE exams and related content can be accessed directly at www.vcaa.vic.edu.au
