VCE General Maths Data Analysis 2017 Mini Test 1
This is the full VCE General Maths Exam with worked solutions. You can also try Mini-Tests, which are official VCAA exams split into short tests you can do anytime.
Number of marks: 9
Reading time: 3 minutes
Writing time: 20 minutes
Instructions
• Answer all questions in pencil on your Multiple-Choice Answer Sheet.
• Choose the response that is correct for the question.
• A correct answer scores 1; an incorrect answer scores 0.
• Marks will not be deducted for incorrect answers.
• No marks will be given if more than one answer is completed for any question.
• Unless otherwise indicated, the diagrams in this book are not drawn to scale.
Data analysis - 2017 (Part 1)
The five-number summary for the forearm circumference of these 252 people is closest to
- A. 21, 27.4, 28.7, 30, 34
- B. 21, 27.4, 28.7, 30, 35.9
- C. 24.5, 27.4, 28.7, 30, 34
- D. 24.5, 27.4, 28.7, 30, 35.9
- E. 24.5, 27.4, 28.7, 30, 36
The table below shows the forearm circumference, in centimetres, of a sample of 10 people selected from this group of 252 people.
| Circumference | 26.0 | 27.8 | 28.4 | 25.9 | 28.3 | 31.5 | 28.2 | 25.9 | 27.9 | 27.8 |
The mean, \(\bar{x}\), and the standard deviation, \(s_x\), of the forearm circumference for this sample of people are closest to
- A. \(\bar{x} = 1.58 \quad s_x = 27.8\)
- B. \(\bar{x} = 1.66 \quad s_x = 27.8\)
- C. \(\bar{x} = 27.8 \quad s_x = 1.58\)
- D. \(\bar{x} = 27.8 \quad s_x = 1.66\)
- E. \(\bar{x} = 27.8 \quad s_x = 2.30\)
The histogram below shows the distribution of the log10(area), with area in square kilometres, of 17 islands.
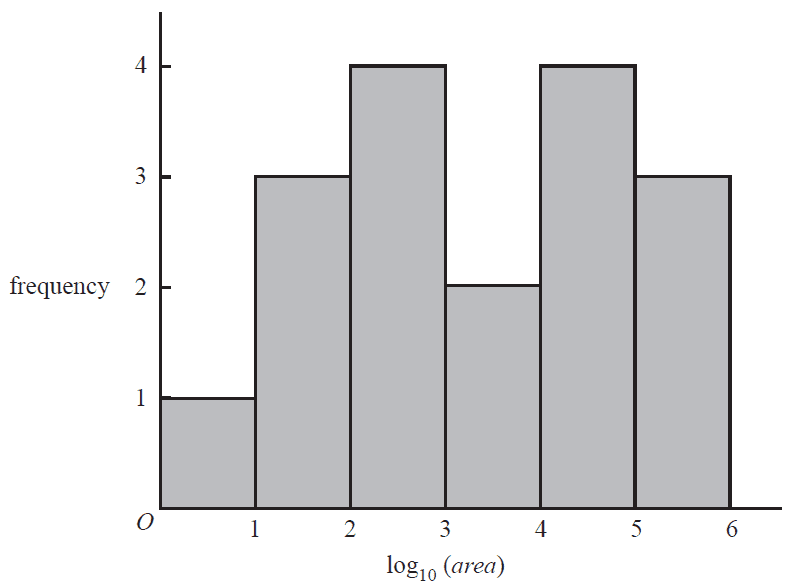
The median area of these islands, in square kilometres, is between
- A. 2 and 3
- B. 3 and 4
- C. 10 and 100
- D. 1000 and 10 000
- E. 10 000 and 100 000
Use the following information to answer Questions 5–7.
A study was conducted to investigate the association between the number of moths caught in a moth trap (less than 250, 250–500, more than 500) and the trap type (sugar, scent, light). The results are summarised in the percentaged segmented bar chart below.
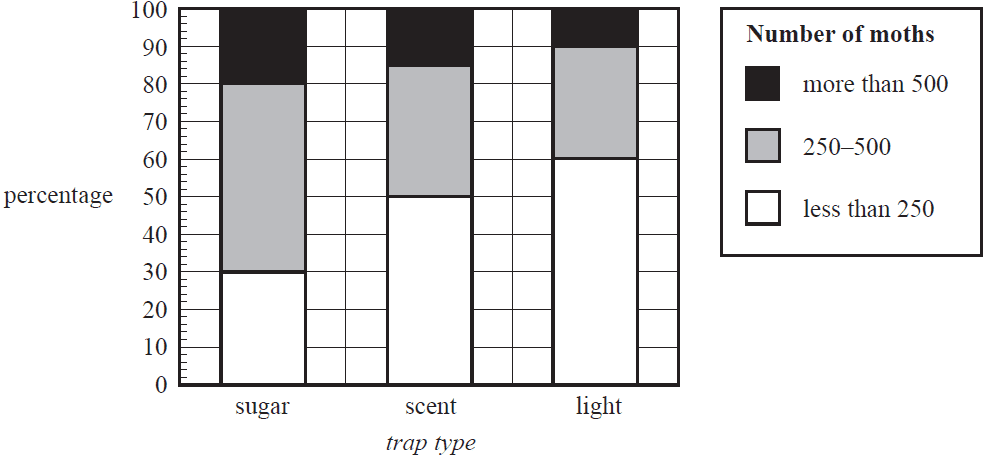
There were 300 sugar traps.
The number of sugar traps that caught less than 250 moths is closest to
- A. 30
- B. 90
- C. 250
- D. 300
- E. 500
The data displayed in the percentaged segmented bar chart supports the contention that there is an association between the number of moths caught in a moth trap and the trap type because
- A. most of the light traps contained less than 250 moths.
- B. 15% of the scent traps contained 500 or more moths.
- C. the percentage of sugar traps containing more than 500 moths is greater than the percentage of scent traps containing less than 500 moths.
- D. 20% of sugar traps contained more than 500 moths while 50% of light traps contained less than 250 moths.
- E. 20% of sugar traps contained more than 500 moths while 10% of light traps contained more than 500 moths.
The variables number of moths (less than 250, 250–500, more than 500) and trap type (sugar, scent, light) are
- A. both nominal variables.
- B. both ordinal variables.
- C. a numerical variable and a categorical variable respectively.
- D. a nominal variable and an ordinal variable respectively.
- E. an ordinal variable and a nominal variable respectively.
Use the following information to answer Questions 8–10.
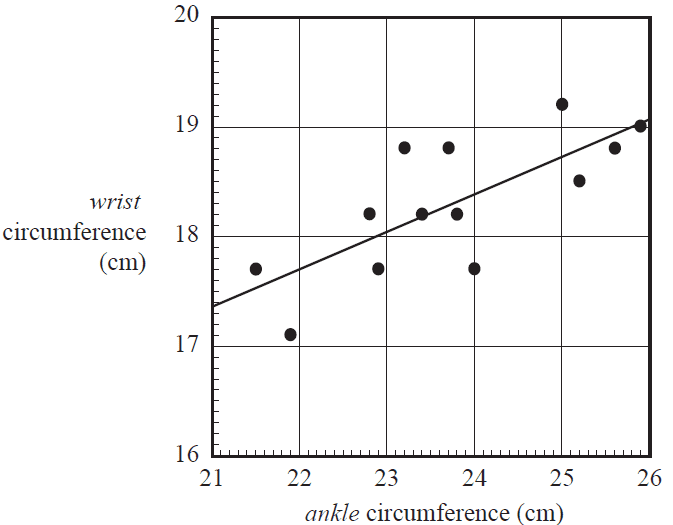
The scatterplot below shows the wrist circumference and ankle circumference, both in centimetres, of 13 people. A least squares line has been fitted to the scatterplot with ankle circumference as the explanatory variable.
The equation of the least squares line is closest to
- A. ankle = 10.2 + 0.342 × wrist
- B. wrist = 10.2 + 0.342 × ankle
- C. ankle = 17.4 + 0.342 × wrist
- D. wrist = 17.4 + 0.342 × ankle
- E. wrist = 17.4 + 0.731 × ankle
When the least squares line on the scatterplot is used to predict the wrist circumference of the person with an ankle circumference of 24 cm, the residual will be closest to
- A. –0.7
- B. –0.4
- C. –0.1
- D. 0.4
- E. 0.7
End of Multiple-Choice Question Book
VCE is a registered trademark of the VCAA. The VCAA does not endorse or make any warranties regarding this study resource. Past VCE exams and related content can be accessed directly at www.vcaa.vic.edu.au
