VCE General Maths Data Analysis 2019 Mini Test 2
This is the full VCE General Maths Exam with worked solutions. You can also try Mini-Tests, which are official VCAA exams split into short tests you can do anytime.
Number of marks: 10
Reading time: 4 minutes
Writing time: 22 minutes
Instructions
• Answer all questions in pencil on your Multiple-Choice Answer Sheet.
• Choose the response that is correct for the question.
• A correct answer scores 1; an incorrect answer scores 0.
• Marks will not be deducted for incorrect answers.
• No marks will be given if more than one answer is completed for any question.
• Unless otherwise indicated, the diagrams in this book are not drawn to scale.
Data analysis - 2019 (Part 2)
Use the following information to answer Questions 1 and 2.
A least squares line is used to model the relationship between the monthly average temperature and latitude recorded at seven different weather stations. The equation of the least squares line is found to be
\( \textit{average temperature} = 42.9842 - 0.877447 \times \textit{latitude} \)
Question 1When the numbers in this equation are correctly rounded to three significant figures, the equation will be
- A. \( \textit{average temperature} = 42.984 - 0.877 \times \textit{latitude} \)
- B. \( \textit{average temperature} = 42.984 - 0.878 \times \textit{latitude} \)
- C. \( \textit{average temperature} = 43.0 - 0.878 \times \textit{latitude} \)
- D. \( \textit{average temperature} = 42.9 - 0.878 \times \textit{latitude} \)
- E. \( \textit{average temperature} = 43.0 - 0.877 \times \textit{latitude} \)
The coefficient of determination was calculated to be 0.893743
The value of the correlation coefficient, rounded to three decimal places, is
- A. -0.945
- B. -0.898
- C. 0.806
- D. 0.898
- E. 0.945
A study was conducted to investigate the effect of drinking coffee on sleep.
In this study, the amount of sleep, in hours, and the amount of coffee drunk, in cups, on a given day were recorded for a group of adults.
The following summary statistics were generated.
| Sleep (hours) | Coffee (cups) | |
| Mean | 7.08 | 2.42 |
| Standard deviation | 1.12 | 1.56 |
| Correlation coefficient (r) | -0.770 | |
On average, for each additional cup of coffee drunk, the amount of sleep
- A. decreased by 0.55 hours.
- B. decreased by 0.77 hours.
- C. decreased by 1.1 hours.
- D. increased by 1.1 hours.
- E. increased by 2.3 hours.
The table below shows the values of two variables \(x\) and \(y\).
The associated scatterplot is also shown.
The explanatory variable is \(x\).
| x | y |
|---|---|
| 1 | 7.6 |
| 3 | 3.4 |
| 5 | 12.1 |
| 7 | 23.4 |
| 9 | 43.6 |
| 11 | 51.8 |
| 13 | 95.4 |
| 15 | 108 |
| 16 | 145 |
| 17 | 172 |
| 18 | 168 |
The scatterplot is non-linear.
A squared transformation applied to the variable \(x\) can be used to linearise the scatterplot.
The equation of the least squares line fitted to the linearised data is closest to
- A. \(y = -1.34 + 0.546x\)
- B. \(y = -1.34 + 0.546x^2\)
- C. \(y = 3.93 - 0.00864x^2\)
- D. \(y = 34.6 - 10.5x\)
- E. \(y = 34.6 - 10.5x^2\)
Use the following information to answer Questions 5 and 6.
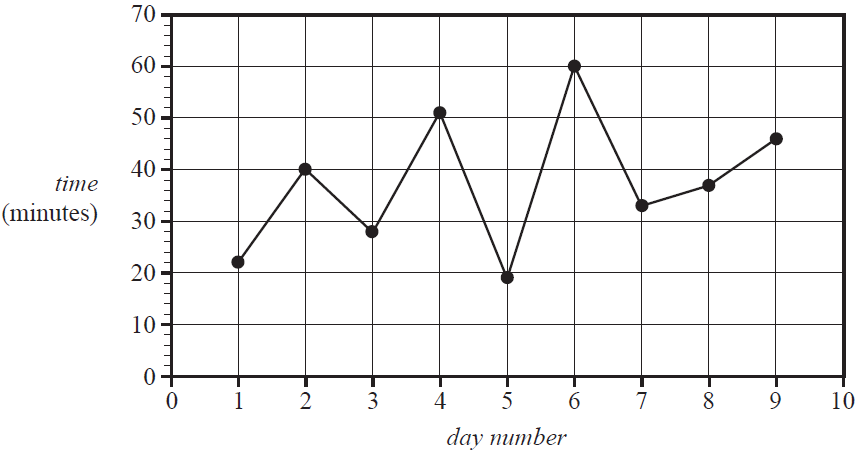
The time, in minutes, that Liv ran each day was recorded for nine days.
These times are shown in the table below.
| Day number | 1 | 2 | 3 | 4 | 5 | 6 | 7 | 8 | 9 |
| Time (minutes) | 22 | 40 | 28 | 51 | 19 | 60 | 33 | 37 | 46 |
The time series plot below was generated from this data.
Both three-median smoothing and five-median smoothing are being considered for this data.
Both of these methods result in the same smoothed value on day number
- A. 3
- B. 4
- C. 5
- D. 6
- E. 7
A least squares line is to be fitted to the time series plot shown above.
The equation of this least squares line, with day number as the explanatory variable, is closest to
- A. \( \textit{day number} = 23.8 + 2.29 \times \textit{time} \)
- B. \( \textit{day number} = 28.5 + 1.77 \times \textit{time} \)
- C. \( \textit{time} = 23.8 + 1.77 \times \textit{day number} \)
- D. \( \textit{time} = 23.8 + 2.29 \times \textit{day number} \)
- E. \( \textit{time} = 28.5 + 1.77 \times \textit{day number} \)
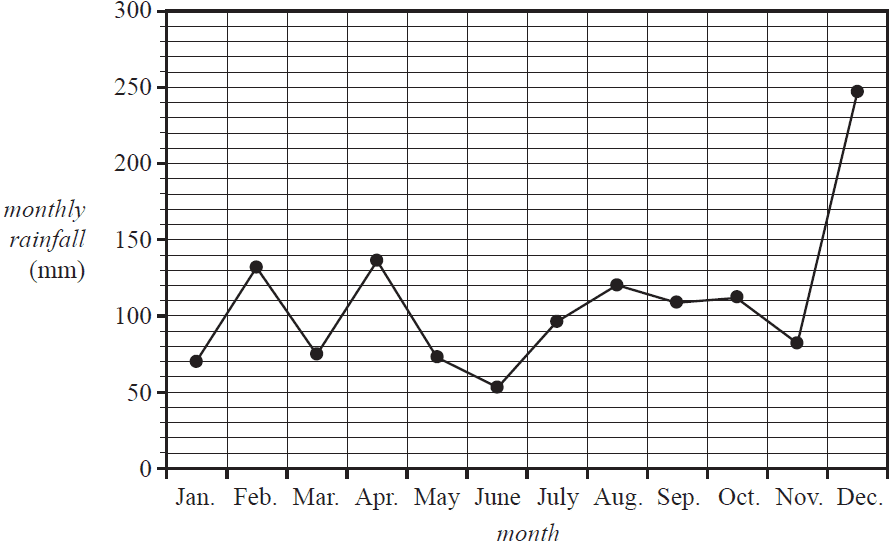
Use the following information to answer Questions 7 and 8.
The time series plot below shows the monthly rainfall at a weather station, in millimetres, for each month in 2017.

The median monthly rainfall for 2017 was closest to
- A. 53 mm
- B. 82 mm
- C. 96 mm
- D. 103 mm
- E. 111 mm
If seven-mean smoothing is used to smooth this time series plot, the number of smoothed data points would be
- A. 3
- B. 5
- C. 6
- D. 8
- E. 10
End of Multiple-Choice Question Book
VCE is a registered trademark of the VCAA. The VCAA does not endorse or make any warranties regarding this study resource. Past VCE exams and related content can be accessed directly at www.vcaa.vic.edu.au
