VCE General Maths Data Analysis 2019 Mini Test 1
This is the full VCE General Maths Exam with worked solutions. You can also try Mini-Tests, which are official VCAA exams split into short tests you can do anytime.
Number of marks: 9
Reading time: 3 minutes
Writing time: 20 minutes
Instructions
• Answer all questions in pencil on your Multiple-Choice Answer Sheet.
• Choose the response that is correct for the question.
• A correct answer scores 1; an incorrect answer scores 0.
• Marks will not be deducted for incorrect answers.
• No marks will be given if more than one answer is completed for any question.
• Unless otherwise indicated, the diagrams in this book are not drawn to scale.
Data analysis - 2019 (Part 1)
Data analysis
Use the following information to answer Questions 1–3.
The histogram below shows the distribution of the population size of 48 countries in 2018.
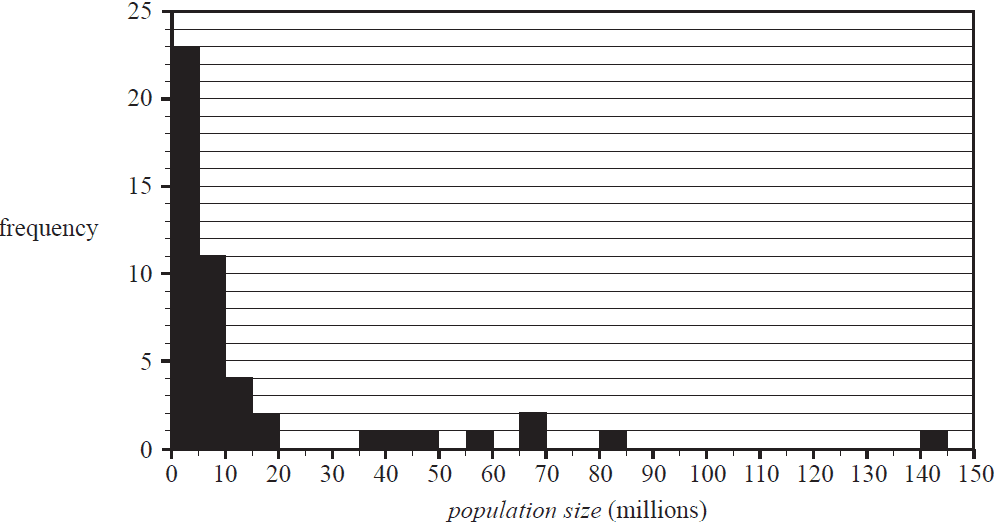
The number of these countries with a population size between 5 million and 20 million people is
- A. 11
- B. 17
- C. 23
- D. 34
- E. 35
The shape of this histogram is best described as
- A. positively skewed with no outliers.
- B. positively skewed with outliers.
- C. approximately symmetric.
- D. negatively skewed with no outliers.
- E. negatively skewed with outliers.
The histogram below shows the population size for these 48 countries plotted on a log10 scale.
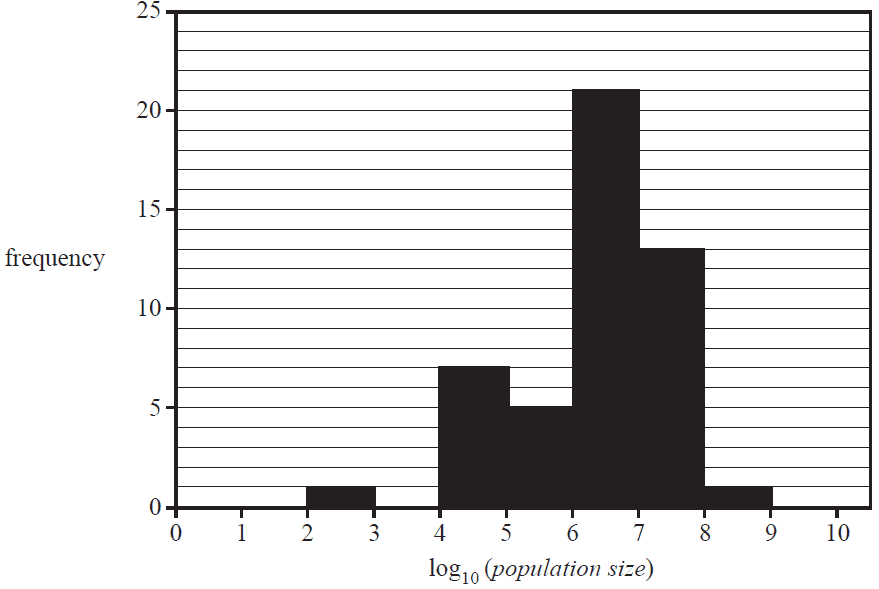
Based on this histogram, the number of countries with a population size that is less than 100 000 people is
- A. 1
- B. 5
- C. 7
- D. 8
- E. 48
Use the following information to answer Questions 4 and 5.
The stem plot below shows the distribution of mathematics test scores for a class of 23 students.
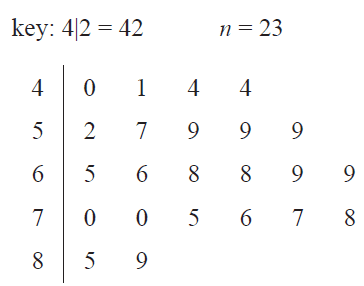
For this class, the range of test scores is
- A. 22
- B. 40
- C. 45
- D. 49
- E. 89
For this class, the interquartile range (IQR) of test scores is
- A. 14.5
- B. 17.5
- C. 18
- D. 24
- E. 49
The time taken to travel between two regional cities is approximately normally distributed with a mean of 70 minutes and a standard deviation of 2 minutes.
The percentage of travel times that are between 66 minutes and 72 minutes is closest to
- A. 2.5%
- B. 34%
- C. 68%
- D. 81.5%
- E. 95%
The volume of a cup of soup served by a machine is normally distributed with a mean of 240 mL and a standard deviation of 5 mL.
A fast-food store used this machine to serve 160 cups of soup.
The number of these cups of soup that are expected to contain less than 230 mL of soup is closest to
- A. 3
- B. 4
- C. 8
- D. 26
- E. 156
Percy conducted a survey of people in his workplace. He constructed a two-way frequency table involving two variables.
One of the variables was attitude towards shorter working days (for, against).
The other variable could have been
- A. age (in years).
- B. sex (male, female).
- C. height (to the nearest centimetre).
- D. income (to the nearest thousand dollars).
- E. time spent travelling to work (in minutes).
Use the following information to answer Questions 9 and 10.
A least squares line is used to model the relationship between the monthly average temperature and latitude recorded at seven different weather stations. The equation of the least squares line is found to be
\( \textit{average temperature} = 42.9842 - 0.877447 \times \textit{latitude} \)
Question 8When the numbers in this equation are correctly rounded to three significant figures, the equation will be
- A. \( \textit{average temperature} = 42.984 - 0.877 \times \textit{latitude} \)
- B. \( \textit{average temperature} = 42.984 - 0.878 \times \textit{latitude} \)
- C. \( \textit{average temperature} = 43.0 - 0.878 \times \textit{latitude} \)
- D. \( \textit{average temperature} = 42.9 - 0.878 \times \textit{latitude} \)
- E. \( \textit{average temperature} = 43.0 - 0.877 \times \textit{latitude} \)
End of Multiple-Choice Question Book
VCE is a registered trademark of the VCAA. The VCAA does not endorse or make any warranties regarding this study resource. Past VCE exams and related content can be accessed directly at www.vcaa.vic.edu.au
