VCE General Maths Data Analysis 2020 Mini Test 2
This is the full VCE General Maths Exam with worked solutions. You can also try Mini-Tests, which are official VCAA exams split into short tests you can do anytime.
Number of marks: 10
Reading time: 4 minutes
Writing time: 22 minutes
Instructions
• Answer all questions in pencil on your Multiple-Choice Answer Sheet.
• Choose the response that is correct for the question.
• A correct answer scores 1; an incorrect answer scores 0.
• Marks will not be deducted for incorrect answers.
• No marks will be given if more than one answer is completed for any question.
• Unless otherwise indicated, the diagrams in this book are not drawn to scale.
Data analysis - 2020 (Part 2)
Use the following information to answer Questions 10–12.
The data in Table 2 was collected in a study of the association between the variables frequency of nightmares (low, high) and snores (no, yes).
| Frequency of nightmares | Snores | Total | |
|---|---|---|---|
| No | Yes | ||
| low | 80 | 58 | 138 |
| high | 11 | 12 | 23 |
| Total | 91 | 70 | 161 |
The variables in this study, frequency of nightmares (low, high) and snores (no, yes), are
- A. ordinal and nominal respectively.
- B. nominal and ordinal respectively.
- C. both numerical.
- D. both ordinal.
- E. both nominal.
The percentage of participants in the study who did not snore is closest to
- A. 42.0%
- B. 43.5%
- C. 49.7%
- D. 52.2%
- E. 56.5%
Of those people in the study who did snore, the percentage who have a high frequency of nightmares is closest to
- A. 7.5%
- B. 17.1%
- C. 47.8%
- D. 52.2%
- E. 58.0%
A least squares line of the form \(y = a + bx\) is fitted to a scatterplot.
Which one of the following is always true?
- A. As many of the data points in the scatterplot as possible will lie on the line.
- B. The data points in the scatterplot will be divided so that there are as many data points above the line as there are below the line.
- C. The sum of the squares of the shortest distances from the line to each data point will be a minimum.
- D. The sum of the squares of the horizontal distances from the line to each data point will be a minimum.
- E. The sum of the squares of the vertical distances from the line to each data point will be a minimum.
In a study, the association between the number of tasks completed on a test and the time allowed for the test, in hours, was found to be non-linear.
The data can be linearised using a \(\log_{10}\) transformation applied to the variable number of tasks.
The equation of the least squares line for the transformed data is
\(\log_{10}(\text{number of tasks}) = 1.160 + 0.03617 \times \text{time}\)
This equation predicts that the number of tasks completed when the time allowed for the test is three hours is closest to
- A. 13
- B. 16
- C. 19
- D. 25
- E. 26
Use the following information to answer Questions 15 and 16.
Table 3 below shows the long-term mean rainfall, in millimetres, recorded at a weather station, and the associated long-term seasonal indices for each month of the year.
The long-term mean rainfall for December is missing.
| Jan. | Feb. | Mar. | Apr. | May | June | July | Aug. | Sep. | Oct. | Nov. | Dec. | |
|---|---|---|---|---|---|---|---|---|---|---|---|---|
| Mean rainfall (mm) | 51.9 | 52.3 | 52.8 | 66.6 | 87.1 | 69.4 | 73.0 | 79.9 | 82.6 | 82.4 | 81.1 | |
| Seasonal index | 0.728 | 0.734 | 0.741 | 0.934 | 1.222 | 0.973 | 1.024 | 1.121 | 1.159 | 1.156 | 1.138 | 1.072 |
To correct the rainfall in March for seasonality, the actual rainfall should be, to the nearest per cent
- A. decreased by 26%
- B. increased by 26%
- C. decreased by 35%
- D. increased by 35%
- E. increased by 74%
The long-term mean rainfall for December is closest to
- A. 64.7 mm
- B. 65.1 mm
- C. 71.3 mm
- D. 76.4 mm
- E. 82.0 mm
Use the following information to answer Questions 17 and 18.
Table 4 below shows the monthly rainfall for 2019, in millimetres, recorded at a weather station, and the associated long-term seasonal indices for each month of the year.
| Jan. | Feb. | Mar. | Apr. | May | June | July | Aug. | Sep. | Oct. | Nov. | Dec. | |
|---|---|---|---|---|---|---|---|---|---|---|---|---|
| Monthly rainfall (mm) | 18.4 | 17.6 | 46.8 | 23.6 | 92.6 | 77.2 | 80.0 | 86.8 | 93.8 | 55.2 | 97.3 | 69.4 |
| Seasonal index | 0.728 | 0.734 | 0.741 | 0.934 | 1.222 | 0.973 | 1.024 | 1.121 | 1.159 | 1.156 | 1.138 | 1.072 |
The deseasonalised rainfall for May 2019 is closest to
- A. 71.3 mm
- B. 75.8 mm
- C. 86.1 mm
- D. 88.1 mm
- E. 113.0 mm
Use the following information to answer Questions 9 and 10.
The time series plot below displays the number of airline passengers, in thousands, each month during the period January to December 1960.
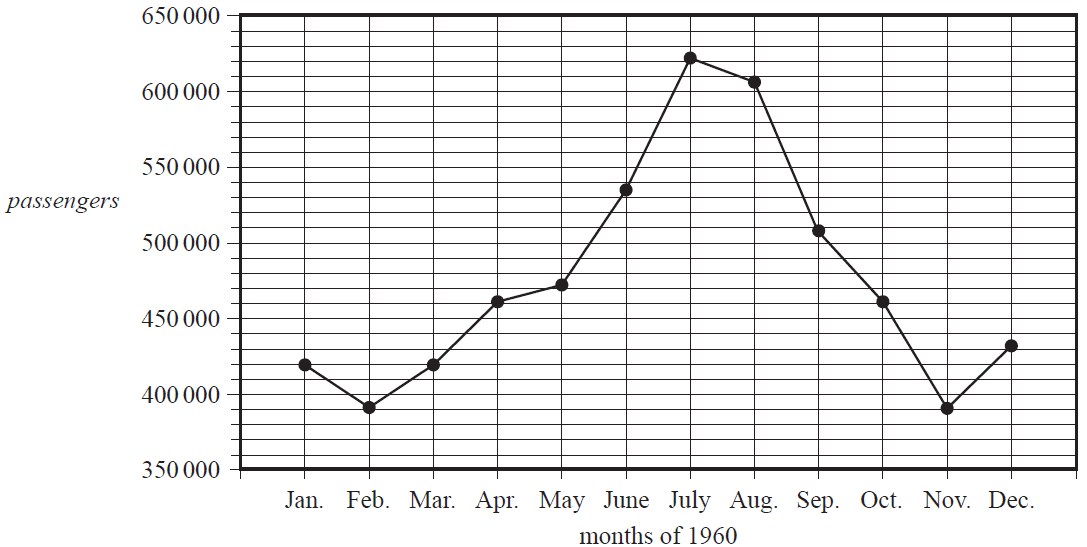
During 1960, the median number of monthly airline passengers was closest to
- A. 461 000
- B. 465 000
- C. 471 000
- D. 573 000
- E. 621 000
During the period January to May 1960, the total number of airline passengers was 2 160 000.
The five-mean smoothed number of passengers for March 1960 is
- A. 419 000
- B. 424 000
- C. 430 000
- D. 432 000
- E. 434 000
End of Multiple-Choice Question Book
VCE is a registered trademark of the VCAA. The VCAA does not endorse or make any warranties regarding this study resource. Past VCE exams and related content can be accessed directly at www.vcaa.vic.edu.au
